SCUOLA DOTTORALE IN BIOLOGIA
SEZIONE BIODIVERSITÀ E ANALISI DEGLI ECOSISTEMI
XXIV CICLO
Diachronic analysis of the Maremma Laziale (Latium) for the
conservation of the Natural and Cultural Landscapes
Analisi diacronica della Maremma Laziale (Lazio) per la
conservazione dei paesaggi naturali e culturali
1 A mia moglie Chiara
Table of contents RIASSUNTO 3 ABSTRACT 6 1. INTRODUCTION 9 2. RESULTS 11 2.1. Geodatabase 11 2.1.1. Biological feature 11 2.1.2. Abiotic features 15
2.2. Potential Natural Vegetation 16
2.3. Land Use Changes 22
2.3.1. Low resolution 22 2.3.2 High Resolution 24 2.4. Climate Changes 26 2.4.1. Rainfall distribution 26 2.4.2. Temperature regimes 29 2.4.3. Bioclimatic indexes 33
2.4.4. Climate change and vegetation 36
3. DISCUSSION 38
4. CONCLUSIONS 41
BIBLIOGRAPHY 43
3 RIASSUNTO
I cambiamenti della copertura del suolo, dovuti principalmente dall’uomo attraverso i cambiamenti di uso del suolo, sono fra i fattori determinanti nelle trasformazioni del paesaggio, soprattutto nel bacino del Mediterraneo. Essi rappresentano uno dei cinque fattori, chiamati ‘drivers’, che causano cambiamenti della biodiversità. Questo processo è iniziato con l’agricoltura e gli insediamenti umani sui paesaggi naturali, dando vita qualche volta a caratteristici paesaggi culturali.
Il cambiamento climatico è attualmente un altro importante fattore a livello globale, dal momento che potrebbe avere un forte impatto sugli esseri viventi, incluso l’uomo. Gli effetti previsti comprendono: evoluzione di nuove comunità vegetali, cambiamenti nella distribuzione spaziale delle specie forestali e perdita di terreni per l’agricoltura.
L’area di studio selezionata, situata nella Provincia di Roma (Lazio, Italia centrale), presenta un tipico paesaggio mediterraneo ed, essendo caratterizzata da particolari aspetti geografici, morfologici, vegetazionali e storici, può rappresentare un caso di studio paradigmatico per analizzare i cambiamenti climatici e di uso e copertura del suolo.
L’area di studio si estende su una superficie totale di 556 Km2 e rappresenta una buona parte delle pianure costiere e interne del Lazio settentrionale. La zona ha un una grande rilevanza storica, essendo abitata fin dal periodo etrusco e romano (es. sito UNESCO di Cerveteri e altri siti archeologici) e mostra rilevanti valori naturalistici e vegetazionali.
Tuttavia, gli estesi lavori di bonifica nella bassa ‘Maremma Laziale’ hanno causato la frammentazione o la perdita di zone umide (stagni, e foreste planiziali costiere) e favorito l’espansione urbana e le attività legate al turismo. La deforestazione, causata dall’espansione agricola, è stata maggiore nelle aree fertili e facilmente accessibili lungo la costa, le pianure e le colline più basse.
Lo scopo di questo progetto di ricerca è incrementare i dati ed analizzare i cambiamenti del paesaggio vegetale che si sono verificati lungo le aree costiere a nord del Lazio nell’ultimo secolo, per la conservazione dei loro paesaggi naturali e culturali.
Gli obiettivi di questa ricerca sono:
• creare un geodatabase informativo che riassuma le caratteristiche biologiche e ambientali dell’area costiera e semi-costiera a nord del Lazio;
• identificare e descrivere i paesaggi naturali e culturali del territorio; • investigare e analizzare le principali trasformazioni e fattori scatenanti.
Prima di tutto, è stato costruito un dataset sulla diversità vegetazionale presente e passata, utilizzando i dati ottenuti da una vasta ricerca bibliografica. Un database è stato implementato allo scopo di definire la distribuzione delle comunità vegetali (dal 1951 al 2011), usando il programma TURBOVEG 2.87 (il programma maggiormente utilizzato per l’archiviazione dei dati fitosociologici in Europa). In questo processo è stato testata e proposta una metodologia per valutare la qualità dei dati vegetazionali georeferenziati.
Un totale di 538 rilievi sono stati analizzati in merito a differenti sistemi di localizzazione usati nell’area di studio da parte di diversi studiosi nel tempo. Il nome di località più comune riguarda la forma e la dimensione variabile (rive, montagne, e manufatti), ma a volte è stato riportato semplicemente il comune della stazione del rilievo. Considerando i rilievi effettuati dopo il 2000, solo quelli più recenti (7%) hanno informazioni spaziali esplicitate (coordinate geografiche). Inoltre solo il 20% dei rilievi riportano l’accuratezza delle coordinate, della quota, della pendenza e dell’esposizione.
Al fine di interpretare il paesaggio attuale e capire le dinamiche in corso, è stata effettuata una classificazione gerarchica del territorio. L’analisi ha permesso di riconoscere gli aspetti principali del paesaggio e di risalire alla vegetazione naturale potenziale. Grazie a questa classificazione, è stato possibile definire una regione macroclimatica, 10 sistemi di paesaggio e differenti sottosistemi di paesaggio. È stato possibile riconoscere 53 associazioni vegetali e definire la loro posizione nella successione (nel contesto delle serie di vegetazione). Fra questi, sono state definite 10 teste di serie.
I cambiamenti di copertura del suolo sono stati esaminati attraverso 4 periodi a due differenti scale: una a bassa risoluzione (1:100.000) (1960, 1990, 2000, 2006) e una ad alta risoluzione (1:25:000) (1949, 1974, 1999, 2005) per analizzare in modo diacronico la distribuzione di 12 classi di copertura del suolo. I cambiamenti sono stati analizzati usando strumenti GIS. Durante il periodo analizzato due cambiamenti di uso del suolo sono stati evidenziati: le superfici forestali e le aree coltivate sono diminuite, soprattutto tra il 1960 e 1990. Mentre le superfici urbane sono drammaticamente aumentate, in relazione all’incremento demografico. I cambiamenti di uso del suolo sono avvenuti maggiormente lungo le coste e
5 definizione delle caratteristiche bioclimatiche, sono stati analizzati dati climatici attraverso la geostatistica (kriging) e la statistica descrittiva (media mobile, indici bioclimatici e grafici). Una mappa della vegetazione, prodotta dalla Provincia di Roma, è stata sovrapposta con alcune mappe climatiche. Le precipitazioni sono diminuite dal 1980, mentre le temperature sono in aumento, anche se non con un tendenza uniforme. La spazializzazione degli indici bioclimatici ha mostrato un passaggio dal bioclima mesomediterraneo a quello termomediterraneo. I trend climatici locali impattano particolari comunità vegetali (specialmente foreste mesofile, associazioni legate ai pascoli cespugliati, alcune cerrete termofile e associazioni relitte di prateria).
Le dinamiche ambientali osservate nell’area di studio sono un esempio paradigmatico per altre aree mediterranee caratterizzate da paesaggi e morfologie simili.
Questo studio può fornire una serie di dati e linee guida per comprendere le trasformazioni in corso e i loro impatti, interpretare i paesaggi e ipotizzare dinamiche future ed essere un strumento scientifico efficace per la gestione ambientale.
ABSTRACT
Land Cover Changes (LCCs) are mainly due to human induced land use changes and they are among the major drivers of landscape transformations, especially in the Mediterranean area. They represent one of the five factors, called drivers, causing biodiversity change. The process of LCCs began with agriculture and human settlements on natural landscapes, driving sometimes the creation of characteristic cultural landscapes.
Climate change is currently another mayor global concern, since it could have heavy impacts on living beings, included humans. Projected impacts encompass a broad range of effects: the evolution of new plant communities, shifts in the spatial distribution of tree species and loss in agricultural yield.
The selected study area, located in the Province of Rome (Latium, central Italy), presents a typical Mediterranean landscape and it is typified by particular geographical, morphological, vegetation and historical features and thus it may represent a paradigmatic case study to analyze land use/cover and climatic changes over time.
The study area covers a total surface of 556 Km2 and it constitutes a wide part of the coastal and internal plains of Northern Latium. That area has a great historical relevance, being inhabited since Etruscan and Roman periods (e.g., the UNESCO site of Cerveteri and other archaeological sites), and it shows relevant naturalistic and vegetation values. However, extensive drainage works in the lower Maremma Laziale caused fragmentation or loss of wetlands (ponds, coastal and forest marshes) and fostered urban expansion and tourist activities. Deforestation caused by agriculture expansion was more extensive in the fertile and easily accessible areas of the coasts, plains and lower hills.
The aim of this research project is to increase data on and analyze changes in the vegetation landscape that occurred along the coastal and semi-coastal areas of Northern Latium over the last century, for the conservation of their Natural and Cultural Landscapes.
The objectives of this research are:
- to create an integrate informative geo-database summarizing biological and environmental features of the coastal and semi-coastal areas of Northern Latium;
7 First of all, a dataset on past and present vegetation diversity was built using data obtained by an extensive bibliographic research. A database was set and implemented, through 180 new vegetation plots, aimed at defining the distribution of plant communities (from 1951 to 2011), using the computer package TURBOVEG 2.87 (the most widespread database program for storing phytosociological data in Europe). In this process it was tested and it is proposed a methodology to improve the quality of georeferenced vegetation data. A total of 538 relevés were analyzed as regards the different system of locating used in the study area by different researchers over time. The most common location name indicates areas of variable size and shape (rivers, mountains, or man-made structures), but sometimes it was simply reported the municipal area of the relevè station. Although data were collected mainly starting from 2000, only for very recent data (7%) spatial explicit information (geographical coordinates) are available. Moreover, only 20% of spatially-explicit records report the accuracy of coordinates, elevation, slope and exposure.
In order to interpret the present landscape and to understand the dynamic in progress, a hierarchical landscape classification was used.
It allowed to locate the main land facets of the study area and the main typologies of potential natural vegetation related to them. Using this classification it was possible to defined one land region, ten land systems and many environmentally homogenous land facets. It was possible to recognize 53 plant communities and to define their likely succession position (in the context of vegetation series). Among them, 10 potential natural vegetation units were defined.
LCCs were assessed in four steps at two different scale: low resolution (1:100.000) (1960, 1990, 2000, 2006) and high resolution (1:25.000) (1949, 1974, 1999, 2005) by analyzing diachronically the distribution of 12 land cover categories obtained from digital land cover maps. LCCs were analyzed using GIS tools and multi-way data analyses. During the analyzed period two main land use changes (LUCs) were assessed: the surface of forests and cultivated areas has decreased over the whole investigated period and especially between 1960 and 1990. Whereas, the surface of urban areas has dramatically increased, in relation to demographic density increase. LUCs occurred mainly along the coast and on plains, with a less extent to inland areas and hills.
The analysis of climatic data was carried out considering a long time period (1951-2007) of mean monthly data of rainfall and temperature measured at 18 gauging stations, within and close to the study area. Climatic data were analyzed using geostatistical methods (kriging) and descriptive statistics
(moving average, bioclimatic indexes and graphs) for the definition of bioclimatic features. Vegetation map was obtained from the Province of Rome and overlaid with climate trend maps. Rainfall has decreased starting from 1980s while temperature has increased, even if not with a uniform trend. The spatialization of bio-climatic indexes showed a shift from Mesomediterranean to Thermomediterranean bioclimate. Local climatic trends are likely to impact specific plant communities (especially mesophilous forests, endangered shrubland-pastures associations, some termophilous oak wood and relict associations of meadows) in the study area, thus affecting the whole system.
The environmental dynamics, observed in the study area, are taken as a paradigmatic example for other Mediterranean areas characterized by similar landscape and morphological features.
This study can provide series of data and guidelines to understand the ongoing environmental changes and their impacts, to interpret the landscapes and to hypothesize their future dynamics, to provide an effective scientific template for environmental management.
9
1. INTRODUCTION
Land cover changes result from the interaction between land use changes, ecological processes, climate variability and long-term climate changes (Petit and Lambin, 2002). The creation of cultural landscape is generally due to traditional techniques and practices that have shaped the territory for centuries. Human activities, indeed, have an important role in the alteration/modification of the natural environment, especially on vegetation. The spread of human population has a leading role in the land-use change. In many areas of the world, the vegetation is being significantly modified and fragmented by clearance for agriculture and logging, and is being markedly changed by current management practices (e.g., Tucker et al., 1986; Woodwell et al., 1986; Saunders et al., 1987; Lawrence et al., 1998). In some case these interactions can create outstanding cultural landscapes with high aesthetic, cultural and ecological value (Droste et al., 1995; Agnoletti, 2007), but may as well result in land degradation ( Thirgood, 1981; McNeill, 1992; Wrbka, 2004) or loss of biodiversity (Sala et al., 2000).
The availability of field information on vegetation and animal diversity and distribution represent an important challenge for biological research. As a matter of fact, large amounts of data stored in museum and herbarium collections are increasingly accessible electronically (Graham et al., 2004; Huettmann, 2005; Soberòn and Peterson, 2005). In most cases, however, data location is provided through a textual description which cannot be directly geo-referenced. Moreover, when available, georeferenced data are usually recorded in a non-standardized format with poor documentation (Chefaoui et al., 2005; Elith et al., 2006; Hortal et al., 2008; Rocchini et al., 2011). During the last decades many vegetation databases that contain species co-occurrence data have been created all over the globe (Dengler et al., 2011). Schaminée et al. (2009) have estimated that in Europe alone, nearly two million phytosociological relevés are stored electronically, and other databases are emerging outside Europe (Ewald, 2001). These databases can be useful for analyses ranging from simple mapping to testing fundamental hypotheses regarding biodiversity patterns (Chapman, 1999; Dengler et al., 2008; Schaminée et al., 2009).
Dealing with the influences vegetation patterns, climate change is currently a mayor global concern, since it could have heavy impacts on living beings, included humans (e.g., Thomas et al. 2004; Hoffman et al. 2009; Fiorillo and McCarthy 2010). Projected impacts encompass a broad range of effects: the evolution of new plant associations (Jackson and Overpeck 2000), shifts
in the spatial distribution of tree species (e.g., Iverson and Prasad 1998; Tchebakova et al. 2005; Téllez-Valdéz et al. 2006), animal and insect population decline or shifts (Parmesan et al., 1999; Gibbons et al., 2000; Bombi et al., 2009), reduced food availability and loss in agricultural yield (Ciais et al., 2003; Mendelsohn and Dinar, 2003; Eiji Maeda et al., 2010; Tirado et al., 2010).
Moreover, the effects of climate change, coupled with socio-economic forces, may trigger desertification processes (Puigdefabregas and Mendizabal, 1998; De Luis et al., 2001; Sivakumar, 2007; Salvati et al., 2008). Soil erosion rates and areas affected by salinization are expected to increase in response to changes in climate for various reasons (Favis-Mortlock and Savabi, 1996; Williams et al., 1996; Favis-(Favis-Mortlock and Guerra, 1999; Nearing 2001; Pruski and Nearing, 2002; Nearing et al., 2005).
Considering both the peculiarity of the natural and cultural landscapes both the climate changes occurred, the lower Maremma Laziale (a coastal and semi-coastal area in Central Italy, Northern Latium), was selected as representative of the phenomena that were previously introduced.
The area was described as a transitional zone from a Mediterranean to a Temperate bioclimate (Blasi 1994), and therefore it is likely to be a very sensitive area to climate condition shifts. Moreover, this area has distinctive geological features (Wimbledon et al., 2000, Cresta et al., 2005) vegetation features (Cutini et al., 2010; Di Pietro et al., 2010) and could be considered as a paradigmatic case study for the effects of climate and land use changes on plant communities.
Thus, the present PhD research project has the aim to increase the knowledge of vegetation landscape changes occurred in the coastal and semi-coastal areas of Northern Latium over the last century, for the conservation of their Natural and Cultural Landscapes.
- The objectives of this research are:
- (i) to create an integrate informative geo-database summarizing biological and environmental features of the coastal and semi-coastal areas of Northern Latium; (ii) to identify and describe the main natural and cultural landscapes of the area;
- (iii) to investigate and analyze the main transformations of the area and driving factors.
11
2. RESULTS
2.1 GEODATABASE 2.1.1. Biological features The georeferencing process
Rules have been defined for georeferencing the different types of records based on a classification of the available localities. This step is crucial because it affects the process of coordinate imputation and the associated uncertainty level. Wieczorek et al. (2004) suggest nine different categories to classify the type of locations, while Murphey et al. (2004) used 6 location categories, divided into 25 sub-categories. We used a system with 16 location classes (De Felici, 2009). In the case of data taken from herbaria and zoological museums, we considered the problem of record redundancy called "false duplication" (see also Proctor et al. 2004; De Felici, 2009). Calculating coordinates and their spatial uncertainty
The choice between automated and manual georeferencing methods is a compromise between precision, accuracy, and efficiency. In our case, the number of data to georeference, the degree of accuracy, and the financial and human resources available were considered. An increasing number of institutions have developed georeferencing tools and methods. Three automated georeferencing tools are currently available: (i) Georeferencing Calculator, University of California at Berkeley http://manisnet.org/gc.html (Wieczorek, 2004); (ii) Biogeomancer, University of Kansas http://www.biogeomancer.org/index.html (Guralnick et al. 2007); (iii) GEOLocate, Tulane University http://www.museum.tulane.edu/geolocate/ (Rios and Bart, 2008). These automated tools are less accurate and precise, and less time efficient, than the computer-assisted manual protocols (Murphey et al. 2004; Kronenfeld and Weeks, 2010). None of the available automated methods can be used for these types of spots in our dataset, because too much details are required.
We used the “point-radius“ method (Wieczorek et al., 2004), to estimate the maximum uncertainty associated with a locality description by summing the maximum errors from all uncertainty sources. This method provides a relatively easy and practical solution for georeferencing localities and estimating uncertainties (Murphey et al., 2004; Guo et al., 2008; Hill et al.,2009). We used the collection of toponyms available in the Italian Portal
Mapping Database (http://www.pcn.minambiente.it/PCN/) to standardize location’s names.
We considered the factors that mostly contribute to the uncertainty of a georeferenced locality description. They are usually grouped into two categories (Wieczorek et al., 2004; Guo et al., 2008): (i) uncertainty of the referenced object (including unknown datum, imprecision in coordinate measurements, map accuracy) and (ii) uncertainty of the spatial relationship (including imprecision in distance or direction measurements). A list of attributes for each georeferenced record was therefore proposed.
A total of 539 relevés were analyzed in the study site (Fig. 2.1). The most common location indicate areas of variable size and shape (rivers, mountains, or man-made structures), but sometimes it was simply reported the municipal area of the station. In some cases, the record location was implicitly provided by the name of the administrative region. Although data were collected mainly from 2000 onwards, only for very recent data (7%) spatial explicit information are available. Moreover, only 20% of spatially-explicit records report the accuracy of coordinates, elevation, slope and aspect. Most of the work shows the name of the place, but they don’t report on which map has been acquired. The 10% doesn’t include a table of vegetation plot.
Thanks to georeferenced, there are some site, in which more phytosociologists sampled the same vegetation type in different periods (1950, 1990, 2000 and 2011): termophilous beech forests with Ilex aquifolium (cod. 9120*), present in the actual Site of Community Importance (SCI, Habitats Directive 92/43/EEC) named “Boschi Mesofili di Allumiere” (IT6030003).
The 70% of relevés was made in forests. The phytosociological relevés have been included in 15 phytosociological classes, in particular, woods represent more than 70% of relevés.
Through this process of georeferencing, it was possible to characterize the land facets with vegetation type from vegetation point of view and so to confirm certain vegetation series and describe a new.
The georeferencing has also highlighted the areas least studied and therefore it was necessary a new vegetation sampling that has led to the production of 180 original phytosociological relevés (Fig. 2.2).
13 Fig. 2.1 In blue the georeferenced vegetation plots
15 2.1.2 Abiotic features
The hierarchical landscape classification (Fig. 2.3) provided one land region (bioclimatic features), 10 land systems (lithological features), 31 land facets (morphological nature and phytoclimatic types).
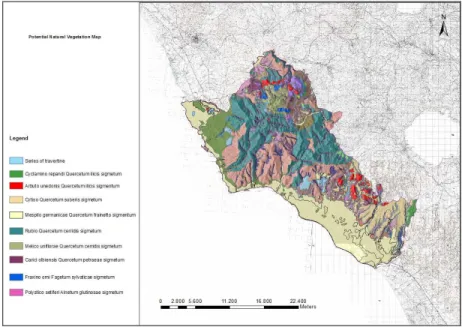
2.2. Potential Natural Vegetation
Through the process of georeferencing and join (Tab. 2.1, see in CD), it was possible to characterize the land facets with different vegetation type. So it has been possible to confirm certain vegetation series and describe a new. All Potential Natural Vegetation falls in the Mediterranean region classes. A summary of the environmental characteristics of the series was described below following a gradient from coast to the interior.
17
Geosigmetum of sandy shores
Diagnosis
Mediterranean Bioclimatic Region with sandy lithotypes and coastal plains. Lithomorphological and bioclimatic description
The geosigmetum is related to the Mediterranean Macroclimatic Region. It can be found within the sandy system, along the coastal side. It develops in an altitude range from 0 to 20 m on the sea level. From the bioclimatic point of view it can be located in middle thermomediterranean thermotype, with dry superior ombrotype.
Physiognomy, structure of stage
Different plant communities have been recognized, principally belonging to the following classes: Cakiletea maritimae, Ammophiletea australis, Juncetea maritimae, Sarcocornietea fruticosae, Helianthemetea guttati, Saginetea maritimae, Phragmiti-Magnocaricetea and Artmisietea vulgaris.
Cyclamino repandi Quercetum ilicis sigmetum Diagnosis
Mediterranean Bioclimatic Region with flysch lithotypes and less steep slopes
Lithomorphological and bioclimatic description
The series is related to the Mediterranean Macroclimatic Region. It can be found within the Flysch system, either along the coastal side. It develops in an altitude range from 50 to 150 m on the sea level. It can be located in middle mesomediterranean thermotype, with subhumid superior ombrotype.
Physiognomy, structure of stage
It is found in the coastal area extending from Santa Severa to Civitavecchia municipality. It is constrained on the flyschoid or marly-calcareous substrates, gentle slopes and southwestern exposures. Quercus ilex is a dominant tree species and several deciduous species such as Q. pubescens, Q. cerris, Fraxinus ornus and Acer monspessulanum may also occur.
Arbuto unedonis-Quercetum ilicis sigmetum Diagnosis
Mediterranean Bioclimatic Region with volcanic lithotypes and more steep slopes
Lithomorphological and bioclimatic description
It can be found within the trachytic volcanic system. It develops in an altitude range from 100 to 300 m on the sea level. From the bioclimatic
point of view it can be located in lower mesomediterranean thermotype, with subhumid superior ombrotype.
Physiognomy, structure of stage
It occurs exclusively on the volcanic substrate of the Tolfa-Ceriti mountains (Volcanic Domes) where they occupies both steep and gentle slopes, in southern exposure. The upper tree-layer is dominated by Quercus ilex, and Q. cerris is also well represented. The shrub-layer is composed of species of the evergreen sclerophyllic shrublands.
Cytiso-Quercetum suberis sigmetum Diagnosis
Mediterranean Bioclimatic Region with volcanic lithotypes and less steep slopes facet
Lithomorphological and bioclimatic description
The series is related to the Mediterranean Macroclimatic Region. It can be found within the trachytic volcanic system. It develops in an altitude range from 400 to 500 m on the sea level. Lower mesomediterranean thermotype, with subhumid superior ombrotype.
Physiognomy, structure of stage
These are mixed evergreen/deciduous communities where Quercus suber (slightly dominant) is accompanied by Q. cerris, Q. ilex and Castanea sativa. This stand is limited between 450 and 500 m (s.l.m.) on volcanic substrates of Tolfa area.
Mespilo germanicae - Quercetum frainetto sigmetum Diagnosis
Mediterranean Bioclimatic Region with Alluvial and Sandy lithotypes and coastal plains.
Lithomorphological and bioclimatic description
It can be found within the alluvial system, either along the coastal side or in the inner plain areas. It develops on the plain, with no inclination, in an altitude range from 10 to 30 m on the sea level. Middle thermomediterranean thermotype, with dry superior ombrotype.
Physiognomy, structure of stage
These woods have been usually converted to high forest coppice. The tree layer formed by Quercus cerris and Q. frainetto. We have only a few
19 “Macchia della Cerreta” in Civitavecchia). Series almost extinct due to urbanization and agriculture (see paragraph on land use changes).
Rubio - Quercetum cerridis sigmetum Diagnosis
Mediterranean Bioclimatic Region with flysch and marls lithotypes and less steep slopes
Lithomorphological and bioclimatic description
The series is related to the Mediterranean Macroclimatic Region, middle mesomediterranean thermotype, with subhumid inferior ombrotype. It can be found within the flysch and marls system. It develops on hillsides with western exposures, in an altitude range from 150 to 400 m on the sea level.
Physiognomy, structure of stage
These thermophilous Quercus cerris woodlands are developed on the marly-calcareous hills, especially on south-western slopes, and are interposed between the sclerophyllic vegetation of the coastal side and the mesophilous Q. cerris woodlands of the inner areas. These woodlands are usually coppiced and are mostly dominated by Q. cerris and in some cases co-dominated by Q. pubescens.
Melico uniflorae -Quercetum cerridis sigmetum Diagnosis
Mediterranean Bioclimatic Region with flysch and volcanic lithotypes and more steep slopes
Lithomorphological and bioclimatic description
The series is related to the mesomediterranean thermotype, with subhumid inferior ombrotype. I found this series within the flysch and volcanic system. It develops on hillsides with western exposures, in an altitude range from 300 to 500 m on the sea level.
Physiognomy, structure of stage
The mesophilous Quercus cerris woodlands are the most widespread in the study area, where it occurs on Flysch substrates in steep slopes over and on volcanic substrates in different morphologic types.
Carici olbiensis-Quercetum petraeae sigmetum Diagnosis
Mediterranean Bioclimatic Region with volcanic lithotypes and less steep slopes
Lithomorphological and bioclimatic description
Mesomediterranean thermotype, with humid superior ombrotype. It can be found within the volcanic system. It develops on hillsides with western exposures, in an altitude range from 400 to 500 m on the sea level.
Physiognomy, structure of stage
Quercus petraea woodlands was recognizable within the north-western sector of the Tolfa hills. They were developed on relatively deep soils on gentle slopes, where they came into spatial contact with beech woodlands at higher altitudes and mesophilous turkey oak woodlands at lower altitudes.
Fraxino orni-Fagetum sylvaticae sigmetum Diagnosis
Mediterranean Bioclimatic Region with volcanic lithotypes and more steep slopes
Lithomorphological and bioclimatic description
The series is related to the mesomediterranean thermotype, with humid superior ombrotype. It has been found within the volcanic system. It develops on hillsides with western exposures, in an altitude range from 500 to 600 m on the sea level.
Physiognomy, structure of stage
The beech woods of the Tolfa hills are restricted to the N-facing slopes of the upper part of the massif. These are old coppices dominated by Fagus sylvatica and co-dominated by Quercus petraea, Carpinus betulus, Castanea sativa, Ostrya carpinifolia and Q. cerris.
Polysticho setiferi-Alnetum glutinosae sigmetum Diagnosis
Mediterranean Bioclimatic Region with volcanic lithotypes and valley Lithomorphological and bioclimatic description
The series is related to the mesomediterranean thermotype, with humid superior ombrotype. It has been found within the volcanic system of valley.
21 Furthermore, thanks to original vegetation plots, I am now analyzing a new vegetation series of travertine. This series is related to the Mediterranean macroclimatic region. It can be found within the travertine system, either along the coastal side. It develops in an altitude range from 10 to 50 m on the sea level. The therophytic vegetation on travertine substrate seems strongly determinate by soil and closely related to the features of the station. Also the stage depends if the travertine is current, recent or ancient.
2.3 Land Use Changes
2.3.1. Low resolution
In the 1960s, the agriculture land-use classes dominated the landscape (57,03%), in particular with Arable lands (53,08%) and Heterogeneous agriculture areas (2,78%). Urban areas covered a small percentage of the territory (1,83%), while Forests and Pastures occupied, respectively, 29,29% and 11,69% (Fig. 2.5; Tab. 2.2, in CD).
In 1990, agriculture was still the dominant feature (50,73%), Arable lands (33,11%) and Heterogeneous agriculture areas (16,05%) being the two most important components. We found a marked increase for the Urban areas (from 1,83% in the 1960s to 5,02% in the 1990s). The increase is greater along the coast and particularly in the di Civitavecchia and Santa Marinella municipality (fig. 2). Also Pastures increased (from 11,69 to 15,78%), while we had a small decrease for Forests (from 29,29 to 28,34%)( Tab. 2.2, in CD).
In 2000 agriculture was still the dominant land-use class (50,55%). Urban areas increased from 5,02 in the 1990s to 5,20% in 2000, Pastures increased from 15,78 to 16%, Transitional woodland/shrub (cod. 3.2.4) from 6,04 to 6,37% and Forests decreased from 28,34 to 28,11% (Fig. 2.5; Tab. 2.2, in CD).
In 2006 agriculture was still the dominant feature (50,85%). Urban areas increased from 5,20 in the 2000s to 5,48% in 2006, Pastures increased from 16 to 16,72%, Transitional woodland/shrub (cod. 3.2.4) from 6,37 to 7,85% and Forests decreased from 28,11 to 26,81% (Fig. 2.5; Tab. 2.2, in CD).
23 Fig. 2.5 Principals land use changes from 1960 to 2006 (low resolution)
2.3.2. High resolution
In the 1949s, the agriculture land-use classes dominated the Tolfa-Ceriti landscape (56,34%), in particular with Arable lands (51,54%). Urban areas covered a small percentage of the territory (3,21%), while Forests and semi-natural areas occupied 40,44% % (Fig. 2.6; Tab. 2.3, in CD).
In 1974, forests and semi-natural areas agriculture was the dominant feature (50,13%). We found a significative increase for the Urban areas (from 3,21% in the 1949s to 4,11% in the 1974s). Also Forest and semi-natural areas increased (from 37% to 60%) (Tab. 2.3, in CD).
In 2000 forests and seminatural areas was the new dominant land-use class (50,17%). Urban areas increased from 3,17 in the 1974s to 7,06% in 2000. In 2005 forests and seminatural areas was still the dominant feature (49,85%). Urban areas increased from 4,06% in the 2000s to 4,31% in 2005. Pastures increased from 12,16 to 19,57%, Transitional woodland/shrub (cod. 3.2.4) from 6,37 to 7,85% and Forests decreased from 37,84 to 29,79% (Fig. 2.6; Tab. 2.3, in CD).
25 Fig. 2.6 Principal land use changes from1949 to 2005 (high resolution)
2.4 Climatic changes
The analysis of climate data was carried out considering the time series both as a unique series and as separated ones: results are showed in summary paragraphs. The analysis of climate change in relation to vegetation data are reported subsequently.
2.4.1 Rainfall distribution
Gauging stations with rainfall data are 13 in total. The Ordinary Kriging map of annual mean precipitation is reported in Fig. 2.7 along with the related standard error prediction map. It is noteworthy the increasing gradient from the coast to the uplands.
Gauging stations with rainfall data for the period 1951-1980 are 10. The average monthly and annual values of precipitation for this period are showed in Tab. 1. The rainiest months are in bold, while the driest months are in italics.
For this period, the rainiest month is November, while the driest month is July. The highest value of annual rainfall (1117.8 mm) was registered at Rota (191 m above sea level); only at four gauging stations the average annual rainfall is higher than 1000 mm. The highest value (166.5 mm) of monthly rainfall was registered at Bracciano 1 (228 m above sea level). The lowest value of annual rainfall (670.4 mm) was registered at Tarquinia 2 (14 m above sea level). The lowest value of monthly rainfall (7.8 mm) was registered at Ladispoli (5 m above sea level) in July.
During 1978-2007 (see Tab. 2.4 in CD) the rainiest month was October while the driest month was July. The highest value of annual rainfall (998.3 mm) was registered at Bracciano 1; at all the gauging stations the average annual rainfall is less than 1000 mm. The highest value (155.4 mm) of monthly rainfall was registered at Anguillara Sabazia (160 m above sea level) in October. The lowest value of annual rainfall (569.0 mm) was registered at Civitavecchia 1 (5 m above sea level). The lowest value of monthly rainfall (10.0 mm) was registered at Ladispoli (5 m above sea level) in July.
In the study area, a decrease of the annual rainfall in nine out of 10 stations was observed ranging from 18.5% (81.5 mm) at Maccarese to 4.4% (29.3mm) at Tarquinia 2. A slight (1.1 mm, 0.1%) increase in annual
27 Mediterranean region. The highest decrease in annual rainfall, considering the absolute value in mm, was calculated for the Rota station, with an estimated reduction of 203.8 mm (18.2 % of the total).
In Fig. 2.7 it is showed the Ordinary Kriging map of Annual mean precipitation (in mm) of the two considered periods (1951-1980; Fig. 2.7a – 1978-2007; Fig. 2.7b) The decreasing rainfall trend for the whole area, and especially for the hilly areas, is pointed out.
29 The moving average of the annual rainfall, calculated for the pluviometric stations, highlights a decreasing trend (Fig. 2.8), but not for all the stations. Generally, this decrease has started around 1980s.
Fig. 2.8 Moving average of annual rainfall measured at the Rota station with the related trend line and R-squared value.
2.4.2 Temperature regimes
Gauging stations with temperature data are 11 in total. The Ordinary Kriging map of annual medium temperature is showed in Fig. 2.9. The coastal area of Civitavecchia is the hottest area, while the coldest one is the Tolfa hilly area.
Gauging stations for the period 1951-1980 are only seven; however, we interpolated the missing values for temperature. The average monthly and annual values of medium temperature for this period are showed in Tab. 2.5 (present in CD). Considering this period, the hottest months are August and July, with average medium temperatures between 21.6° C (Allumiere) and 23.9° C (Civitavecchia 2). Gauging stations that are located along the coast (stations of Civitavecchia, Fregene, Ladispoli, Maccarese, Palo Laziale 2, Pantano Tarquinia, Tarquinia 1 and Tarquinia 2) registered an average annual temperature of 15.9 °C, while on the inner areas (Allumiere, Anguillara Sabazia, Bracciano 1, Cerveteri 2, Rota, Sasso Furbara and Vigna di Valle) the average annual temperature is lower (14.8° C).
The highest value of the monthly average of maximum temperature (27.5° C) was registered at the gauging station of Maccarese. The coldest month is January with lower values for Allumiere (6.5° C medium temperature and 3.3°C minimum temperature). The average minimum temperatures never fall below 0° C, except in one monthly registration at Vigna di Valle (-1.4°C in February 1956).
31 Fig. 2.9 Ordinary Kriging spatialization of annual mean medium temperature (in °C) considering the periods 1951-1980 (a) and 1978-2007 (b) with the standard error related to the whole period.
During the period 1978-2007 (see Tab. 2.5 in CD) the hottest months are July and August, with average temperatures between 22.2° C (Allumiere) and 25.1° C (Civitavecchia 1). At sea level (same stations as above), the average annual temperature is 16.6° C, while in the inner area it is lower (15.2° C). The highest values of maximum temperature are registered in August (mainly) with value ranging from 27.8°C (Civitavecchia 1) and 26.3°C in July at the station of Allumiere. The coldest months are January and February, with the lowest value for Allumiere (6.1°C medium temperature and 3.4°C minimum temperature). At the gauging stations the average minimum temperature never falls below 0° C, except in one monthly registration of Allumiere (-0,5° C, January of 1981).
From the comparison of the two temperature datasets it was possible to highlight that, in all showed stations, the annual average of medium temperature increased from 0.1°C to 1.0°C. The increase in temperature was higher for minimum temperature than for maximum temperature, generally for all the considered stations. It is worth to mention that in all stations, the maximum temperature increase during the summer, while the trend may be different in other seasons. The moving averages calculated for the thermo-gauging stations for the mean annual temperature generally show an increasing trend. Fig. 2.10 showed the moving average of the minimum annual temperature of the station of Vigna di Valle.
33 2.4.3 Bioclimatic Indexes
In relation to the period 1951-1980 (see Tab. 2.6 in CD), the calculation of Mitrakos Indexes shows that the station with the higher drought stress (both annual and Summer) is Civitavecchia 1. The station with the higher cold stress (both annual and Winter) is Allumiere. According to the bioclimatic classification of Emberger for the Pluviometric factor (Q), all stations with available data were classified as humid. According to the elaboration of Rivas Martinez indexes, all the gauging stations belongs to the Mediterranean area, excluding Bracciano, Anguillara Sabazia and Rota which can be classified within the Temperate area. Climate diagrams show a trend widely recognized as typically Mediterranean with one dry period. The values of the BGI indicate a humid climate for all the stations.
In relation to the period 1978-2007 (see Tab. 2.6 in CD), the calculation of Mitrakos Indexes shows that the station with the higher drought stress (both annual and Summer) is Fregene. The station with the higher cold stress (both annual and Winter) is Allumiere. According to the bioclimatic classification of Emberger for the Pluviometric factor (Q), Allumiere, Anguillara Sabazia, Bracciano 1, Cerveteri 2, Ladispoli, Rota, Sasso Furbara and Tarquinia 2 are humid, while Civitavecchia 1, Fregene, Maccarese, Pantano Tarquinia and Tarquinia 1 are sub-humid. According to the elaboration of Rivas Martinez indexes all the gauging stations belongs to the Mediterranean area. Climate diagrams show a trend widely recognized as typically Mediterranean with a dry period always present (Fig. 2.11).
Fig. 2.11 Walter & Lieth climate diagram for the Allumiere (LLPP) station for the period 1978-2007.
The comparison of Mitrakos indexes shows that, for all the stations, the annual and Winter cold stress have markedly decreased in a percentage ranging from 1.3% to 31.7%. Summer drought stress has increased for the majority of stations (not for Ladispoli); the annual drought stress has increased as well (but not for Ladispoli and Tarquinia 2). The Emberger index of Civitavecchia 1, Fregene, Maccarese, Pantano Tarquinia and Tarquinia 1 shifted from humid to sub humid. According to the Rivas Martinez classification all the stations that were classified as Temperate shifted into the Mediterranean belt. According to the Rivas Martinez classification three stations (Allumiere, Bracciano 1 and Rota) change their ombrotype from humid to sub-humid; other three other stations (Civitavecchia 1 and Maccarese and Pantano Tarquinia) changed from sub-humid to dry. The variations of the BGI values over the two periods are showed in Fig. 2.12c.
35 Fig. 2.12 Ordinary Kriging spatialization of the variation of the annual mean precipitation (a), annual mean of medium temperature (b) and of the BGI value (c), with the related standard errors.
2.3.4 Climate change and vegetation
Concerning the average annual precipitation, the broadleaf forests are the most affected by decrease in annual rainfall amount (see Tab. 2.7 in CD) in the study area. Woodlands belonging to the vegetation association Carpino betuli - Coryletum avellanae, which are located in narrow valleys on tuff substrata (Fanelli et al. 2007), face an average decrease of rainfall of 196.4 mm over thirty years (the whole area, on average, has a annual rainfall of 896.3 mm for the period 1951-1980 and of 767.2 mm for the second period). Temperate woodlands dominated by Quercus robur L. (-188.7 mm on average) range from a minimum decrease of 46.0 mm to a maximum decrease of 214.3 mm. Chestnut forests, located on acid vulcanite soils, lost an average of 187.0 mm while the Fagus sylvatica L. and Ilex aquifolium L. forests in Allumiere lost 180.0 mm of rainfall (Fig. 2.13).
The thermophilous sub-acidophilus woodland dominated by Quercus cerris L., which is the most widespread woodland, lost an average of 161.2 mm of rainfall. Quercus ilex L. forests are not really affected by a decrease in rainfall (only 27 mm) while the acidophilus maquis lost an average of 144.0 mm of rainfall. Some pastures also face an important reduction of rainfall: meadows with Gaudinia fragilis (L.) P. Beauv. and Cynosurus cristatus L. (-169.7 mm), prairies dominated by Dasypyrum villosum (L.) Borbàs (-92.0 mm).
As regards temperature variations, the plant communities that were more heavily affected by an increase of the medium temperature are the igrophilous broadleaf woodlands of the flood plains. Specifically, the alluvial forests dominated by Alnus glutinosa (L.) Gaertn. and the riparian poplar woodlands face a temperature increase of 0.8 °C (average of the annual medium temperature). The coastal vegetation faces an increase of 0.7°C. A moderate increase of temperature was also calculated for Castanea sativa and Quercus ilex forests (0.5 °C).
The aridity index elaborations show that the plant communities that face the highest increase of aridity are the shrub communities: evolving stadia of the Mediterranean Quercus cerris woodland (8.54), maquises dominated by Erica arborea L. (7.02). Woods of Carpinus betulus L. and Corylus avellana L. (5.81) also face an increase of aridity. Among the forests, it is noteworthy to mention an increase of aridity for the re-colonizing woodland dominated by Quercus pubescens (5.05) (BGI shifting from 0.58 to 9.98 in
37 Fig. 2.13 Location of the forest communities (from Fanelli et al. 2007, mod.) in the area that face the higher decrease in annual rainfall.
3.DISCUSSION
The present study investigated the biological and physical aspects and their correlations in the lower ‘Maremma Laziale’.
The bioclimatic features are associated with a rather complex lithological characterization, determined by the presence of different lithotypes (flysch, volcanic rocks, marls, clays and sands). This increases the diversification of soil chemistry, leading to a gradient of vegetation following both a coast-inland and altitude gradient (0-600 m a.s.l.).
A hierarchical landscape classification methodology and spatial analysis tools were used to identify landscape units homogenous from a bioclimatic, lithological and morphological point of view. This classification resulted in the spatialization of one land region, 10 land systems and 31 land facets. In the study area, land use changes occurred over centuries, but these seem not to affect the persistence of natural vegetation with different degrees of maturity in relation to agro-forestry-pastoral uses. In the hilly areas there are large woodland surfaces, framed with non-forest vegetation (e.g., pastures) creating mosaics. These mosaics represent a typical landscape system in the area, with grass stages (maintained by grazing) present on marly limestone lithotypes. Only a small part of the territory is characterized by vegetation in an evolution stadium due to the abandonment of pastoral practices. The type of substrate and morphology (slope) have a strong influence on land-use structure becaland-use it determines labour and input requirements. A wide part of the coastal area, in the alluvial plain, has been heavily modified, where most natural forests disappeared. In fact, the urban growth has primarily impacted the agricultural areas available at the coastal fringe. The conversion to urban uses was high only in defined cover classes: arable lands, degraded pastures, fallow lands, surfaces devoted to annual cultivations and vineyards. These land cover classes are traditionally concentrated at the urban–rural interface in the Mediterranean region (e.g., Mairota et al. 1998). Overall, this is a common growth model for a Mediterranean area (e.g., Leontidou 1990), which only moderately altered the traditional Mediterranean ‘landscape gradient’ that is well described in Brouwer et al. (1991). This gradient includes compact urban areas, high-diversification agricultural areas, pastures, and different types of woodlands. The spatial distribution of these land cover classes mainly
39 A lack of urban planning, coupled with relatively poor control of land appropriation, spontaneous settlements and, more recently, a subtle process of planning ‘deregulation’ were observed (Krumholz, 1992).
Recently, a management plan was enforced in ZPS Tolfa Mountains aimed at the conservation of threatened birds listed in the “Birds” Directive and of habitats and species listed in the “Habitat” Directive (92/43/CEE).
Moreover, besides the new, but sometimes only declared, ‘green-oriented policy’ of the local governments (i.e., municipalities and Università Agrarie), the establishment of a regional rules, obtained considering the scientific data, is needed. With some differences, such problems have been observed in other Mediterranean suburban areas (Salgueiro, 2001; Paul and Tonts, 2005; Christopoulou et al., 2007; Jomaa et al., 2008).
The bioclimatic diachronic analysis resulted very important in this research. The analysis and spatialization of climate data converge in depicting a climate change in the study area going towards aridity. The findings of this study support the general negative trend in precipitation amount that has been observed in other Mediterranean areas (Giorgi and Lionello, 2008). In fact, the different analyses allowed to depict various aspects of the climate change and each elaboration contributed in giving us a further piece of information. Specifically, it was observed a reduction in Autumn rainfall and this phenomenon may reduce the groundwater recharge. This reduction is partially balanced by a certain increase of rainfall during Summer, but this increase, which is expressed in percentage, correspond to a low increase in millimeters of rainfall. Geostatistical methods for the regionalization of rainfall were useful in defining its spatial distribution; the comparison of climate data over two periods provided a visual and immediate output of changes in precipitation patterns. This analysis spotlights a clear decrease in rainfall amounts, especially in the volcanic and flyschoid hilly belt, while this decrease is less marked along the alluvial coastal plain. This result may be useful in planning ad hoc management policies, especially as regards agriculture, irrigation, management of groundwater resources and natural vegetation conservation. It is worth mentioning that among the four forest communities that lost the higher amount of precipitation, two are listed in the Habitat Directive (92/43/CEE): the Castanea (9260) and Fagus forests (9210). The relevant observed reduction in rainfall (up to 200 mm/y) could seriously threat these plant communities (and in particular the beech forest) and it can give rise to a shift of the forests to a more thermophilous series. Changes in temperature are less evident, especially if considering not very long periods of time, and flattened by average values. However, it was possible to highlight a certain increasing trend in temperature, and this
increase was higher for minimum than for maximum temperatures. In the study area it seems also that hilly areas were more affected by this increase in temperature values. This phenomenon could be particularly worrying again for the Tolfa area since there grow extra-zonal forests of Fagus sylvatica and other broad leaf woodlands.
As regards the bioclimatic indexes, it is worth to mention the shift of the whole area into a Mediterranean bioclimatic belt. This may indicate an ongoing process of vegetation shift, and probably also a change in plant distribution patterns.
In general, it seems that vegetation is seriously threatened by a reduction of rainfall on the hilly belt and by an increase of temperature on the coastal areas. However, it is not possible to quantify the possible effects since this kind of analysis is original for the Mediterranean area. A reduction of rainfall and an increase of temperature, together, lead to an increase in climate aridity which, however, is more marked on the hilly belt. Also, it is noteworthy that many forest associations are facing this problem with a greater extent than other plant communities. Among them, the less vulnerable, and the most affected by aridity, are the riparian forest and the broadleaf tree communities.
41 4. CONCLUSIONS
In this study new data were established in the definition of the plant diversity, of the typical natural and cultural landscapes and of the driving factors giving rise to the changes.
The georeferencing of vegetation plots highlighted the need for further studies, especially as regards shrub and grassland communities, which are still poorly investigated in the study area.
The analysis of the hierarchical landscape classification along with the diachronic analysis of land cover maps showed that the vegetation series of the plains and valleys, are basically not represented. This fact may be explained by the occurrence of high population density in certain portions of the plains, where natural vegetation is rather fragmented, even if it was still possible to define the attribution of a specific series.
Some correlations between the different plant communities and environmental components at the landscape level were confirmed. The results, obtained by the phytosociological analysis, which relates different serial phytocoenoses, allowed to confirm some of the previously proposed series (Fanelli et al., 2007, Blasi, 2010) in homogeneous territorial units obtained by the hierarchical landscape classification (Blasi et al., 2000). Thus it was possible to define 11 Land Units (units where it is possible to allocate a series) corresponding to the basic unit of vegetation landscape. Overall, the hierarchical classification showed several issues dealing with its applicability in areas with complex geomorphology. It should be necessary to implement in further studies, the description of some other relevant parameter, such the soil, that was not possible to consider in this study. It should be important to create a soil map, using geostatistical analysis and a methodology similar to the one applied in this research. However the integration of the phytosociological and synphytosociological data, with the analysis of ecological factors and the hierarchical classification, provided an analytical method suitable for the interpretation of vegetation succession, thanks to potential natural vegetation models. The lower ‘Maremma Laziale’, and in particular the Tolfa Cerite area, even if it is one of the most typical rural landscapes of central Italy, need that measures being undertaken to contain urban sprawl. In fact, this phenomenon is still threatening the natural environment and the agricultural landscape close the urban region of Rome, which can represent, for its proximity, a possible factor of threat.
This study also highlighted a variation in climatic conditions using different analyses and approaches. It also highlighted that these variations occurred
in many areas covered by vulnerable plant communities. These variations may be particularly dangerous for extra-zonal forests that usually grow at higher elevations and represent a very distinctive element of the landscape of the area (e.g., beech woods). Moreover, a reduction in rainfall and a shift of precipitation patterns could reduce the recharge of groundwater, thus affecting both agriculture and water availability for the rapidly growing urban settlements in the area. Conservation policies and sustainable regional planning are needed to effectively protect these vulnerable plant communities. They may benefit of a permanent monitoring system following the approach that was illustrated in the present research.
Finally the creation of a geo-database, the analysis of land use and climate change, and the validation of vegetation series provided by this kind of studies should be taken into account when developing management policies, particularly considering the possible ecological implications for the preservation of biological diversity.
43 BIBLIOGRAFY
Agnoletti M. (2007) The degradation of traditional landscape in a mountain area of Tuscany during the 19th and 20th centuries: implications for biodiversity and sustainable management. Forest Ecology and Management, 249: pp. 5–17.
Anzalone B. (1961) Osservazioni fitosociologiche su alcune faggete depresse del Lazio. Ann Bot 27(1): pp. 120-134.
Bachelet D., Neilson R.P., Lenihan J.M., Drapek R.J. (2001) Climate change effects on vegetation distribution and carbon budget in the United States. Ecosystems 4: 164–185.
Bagnouls F., Gaussen H. (1953) Saison séche et indice xérothermique. Docum Pour les Cartes des Prod Veget Serie Generalité 1: 1-49.
Blasi C. (1994) Fitoclimatologia del Lazio. Fitosoc 27: pp. 151-175. Blasi C. (1996) Il Fitoclima d'Italia. Giorn Bot Ital 130(1): pp. 166-176. Blasi C. (2010) La vegetazione d’Italia con Carta delle Serie di Vegetazione in scala 1: 500 000. Palombi & Partner SrL, Roma 497 pages.
Blasi, C., Carranza, M. L., Frondoni, R. and Rosati, L.: (2000) Ecosystem classification and mapping: A proposal for Italian landscapes. Appl. Veg. Sci. 3, pp. 233–242.
Bombi P., D’Amen M., Gerlach J., Luiselli L. (2009) Will climate change affect terrapin (Pelusios subniger paritalis and P. castanoides intergularis) conservation in Seychelles? Phelsuma 17A: 1-12.
Brouwer F.B., Thomas A.J., Chadwick M.J. (1991) Land use changes in Europe. Processes of change, environmental transformations and future patterns. Dordrecht (The Netherlands): Kluwer Academic.
Chorianopoulos I., Pagonis T., Koukoulas S., Drymoniti S. (2010) Planning, competitiveness and sprawl in the Mediterranean city: the case of Athens. Cities. 27: pp. 249–259.
Ciais P., Reichstein M., Viovy N., Granier A., Ogee J., Allard V., Aubinet M., Buchmann N., Bernhofer C., Carrara A., Chevallier F., De Noblet N., Friend A.D., Friedlingstein P., Grunwald T., Heinesch B., Keronen P., Knohl A., Krinner G., Loustau D., Manca G., Matteucci G., Miglietta F., Ourcival J.M., Papale D., Pilegaard K., Rambal S., Seufert G., Soussana J.F., Sanz M.J., Schulze E.D., Vesala T., Valentini R. (2005) Europe-wide reduction in primary productivity caused by the heat and drought in 2003. Nature 437: 529–533.
Crookston N.L., Rehfeldt G.E., Dixon G.E., Aaron R., Weiskittel A.R. (2010) Addressing climate change in the forest vegetation simulator to
assess impacts on landscape forest dynamics. Forest Ecol Manag 260: 1198–1211.
Cutini M., Cancellieri L., Cioffi M.T., Licursi C. (2010) Phytosociology and phytogeography of fragmented Alnus glutinosa forests in a Tyrrhenian district (Central Italy). Ecol Medit 36(2): 55-73.
De Felici S. (2009) Sistema informativo e cartografia dell’Atlante. In: Amori G., Battisti C., De Felici S. (eds.), 2009. I Mammiferi della Provincia di Roma. Dallo stato delle conoscenze alla gestione e conservazione delle specie. Provincia di Roma, Assessorato alle Politiche dell’Agricoltura, Stilografica, Roma: pp. 64-68.
De Luís M., Francisca García-Cano M., Cortina J., Raventós J., Carlos González-Hidalgo J., Rafael Sánchez J. (2001) Climatic trends, disturbances and short-term vegetation dynamics in a Mediterranean shrubland. Forest Ecol Manag 147(1): 25-37.
De Martonne E. (1926) Une nouvelle fonction climatologique: L’indice d’aridité. La Meteorologie 2: 449-458.
Eiji Maeda E., Pellikka P.K.E., Siljander M., Clark B.J.F. (2010) Potential impacts of agricultural expansion and climate change on soil erosion in the Eastern Arc Mountains of Kenya. Geomorphology 123: 279–289.
Di Pietro R., Azzella M.M., Facioni L. (2010) The forest vegetation of the Tolfa-Ceriti Mountains (Northen Latium-Central Italy). Hacquetia 9(1): pp. 91–150.
Droste, B., Plachter, H., Rossler, M. (Eds.), (1995). Cultural Landscapes of Universal Value—Components of a Global Strategy. G. Fischer
and UNESCO, Jena, Stuttgart, New York.
Economidou E. 1993. The Attic landscape throughout the centuries and its human degradation. Landsc Urban Plan. 24: pp. 33–37.
Emberger L. (1955) Une classification biogéographique des climats. Rev Trav Lab Bot Fac Sci 7: 3-43.
Esteban-Parra M., Rodrigo F.S., Castro-Diez Y. (1998) Spatial and temporal patterns of precipitation in Spain for the period 1880-1992. Int J Climatol 18: 1557-1574.
Falcucci, A., Maiorano,L., Boitani,L., (2007) Changes in land-use/land-cover patterns in Italy and their implications for biodiversity conservation. Landscape Ecology 22, pp. 617–631.
45 Favis-Mortlock D.T., Guerra A.J.T. (1999) The implications of general circulation model estimates of rainfall for future erosion: a case study from Brazil. Catena 37: 329– 354.
Favis-Mortlock D.T., Savabi M.R. (1996) Shifts in rates and spatial distributions of soil erosion and deposition under climate change. In: Anderson MG, Brooks SM (eds) Advances in Hillslope Processes, Wiley, Chichester UK, 529– 560.
Fiorillo A.R., McCarthy P.J. (2010) Ancient polar ecosystems and environments: Proxies for understanding climate change and global warming – an introduction. Palaeogeogr Palaeoclimatol Palaeoecol 295: 345–347.
Giacobbe A. (1964) La misura del Bioclima mediterraneo. Ann Acc Ital Sci Forest 13: 37-69.
Giavante S., Di Giuseppe E., Esposito S. (2009) Flat steps models for the analysis of temperature and precipitation of Italian time series from 1961 to 2007. Statistical Methods for the analysis of large data-sets. In: AA.VV. (eds) Book of short papers, Società Italiana di Statistica, Cleup Padova. Gibbons J.W., Scott D.E., Ryan T., Buhlmann K.A., Tuberville T.D., Metts B.S., Greene J.L., Mills T., Leiden Y., Poppy S., Winne C.T. (2000) The Global Decline of Reptiles, Déjà Vu Amphibians. BioScience 50: 653–666. Giorgi F. (2006) Climate change hot-spots. Geophysical Research Letters 33: L08707.
Giorgi F., Lionello P. (2008) Climate change projections for the Mediterranean region. Global Planet Change 63(2–3): 90–104.
Guo Q., Liu Y., Wieczorek J.. (2008) Georeferencing locality descriptions and computing associated uncertainty using a probabilistic approach. International Journal of Geographical Information Science vol. 22 n. 10: pp. 1067-1090.
Guralnick R.P., Hill A.W. and Lane M., (2007) Towards a collaborative, global infrastructure for biodiversity assessment - Ecology Letters,10: pp. 663–672.
Hansen J., Ruedy R., Sato M., Lo K. (2006) GISS Surface Temperature Analysis. Global Temperature Trends: 2005 Summation. NASA Goddard Institute for Space Studies and Columbia University Earth Institute, New York, USA.
Hansen A.J., Neilson R.P., Dale V.H., Flather C., Iverson L.R., Currie D.J., Shafer S., Cook R., Bartlein P.J. (2001) Global change in forests: responses of species, communities, and biomes. BioScience 51: 765–779.
Hartkamp A.D., De Beurs K., Stein A., White J.W. (1999) Interpolation Techniques for climate variables. NRG-GIS Series 99-01, CIMMYT, Mexico.
Henderson-Sellers A., Robinson P.J. (1991) Contemporary Climatology. Longman, London.
Hill A.H., Guralnick R., Flemons P., Beaman R., Wieczorek J., Ranipeta A., Chavan V.5 and Remse D. (2009) Location, location, location: utilizing pipelines and services to more effectively georeference the world’s biodiversity data. Bioinformatics 10: pp.1-9.
Hoffmann V.H., Sprengel D.C., Ziegler A., Kolb M., Abegg B. (2009) Determinants of corporate adaptation to climate change in winter tourism: An econometric analysis. Global Environ Change 19: 256–264.
Houghton R.A. (1994) The worldwide extent of land-use change. Bioscience 44: pp. 305–309
Insolera I. 1993. Roma moderna. Un secolo di urbanistica romana 1870– 1970. Torino (Italy): Einaudi.
IPCC - Intergovernmental Panel on Climate Change (2000) Summary for policymakers: emissions scenarios. Special report of IPCC working group III.
Iverson L.R., Prasad A.M. (1998) Predicting abundance of 80 tree species following climate change in the eastern United States. Ecol Monogr 68: 465–485.
Jackson S.T., Overpeck J.T. (2000) Responses of plant populations and communities to environmental changes of the late Quaternary. Paleobiol 26: pp. 194–220.
Jomaa I, Auda Y, Abi Saleh B, Hamzé M, Safi S. (2008) Landscape spatial dynamics over 38 years under natural and anthropogenic pressures in Mount Lebanon. Landsc Urban Plan. 87: pp. 67–75.
Jones P.D., Parker D.E., Osborn T.J., Briffa K.R. (2001) Global and hemispheric temperature anomalies – land and marine instrumental records. In: Trends: a Compendium of Data on Global Change. Carbon Dioxide Information Analysis Center, Oak Ridge National Laboratory, Oak Ridge, TN, USA.
Jump A.S., Penuelas J. (2005) Running to stand still: adaptation and the response of plants to rapid climate change. Ecol Lett 8: 1010-1020.