Università Ca’ Foscari Venezia
Dottorato di ricerca in Analisi e Governance dello Sviluppo Sostenibile, 22° ciclo
(A. A. 2006/2007 – A.A. 2008/2009)
LINKING BIODIVERSITY, ECOSYSTEM SERVICES AND ECONOMIC ACTIVITIES:
AN INDICATOR-BASED ASSESSMENT
SETTORE SCIENTIFICO-DISCIPLINARE DI AFFERENZA:
SECS-P/06 ECONOMIA APPLICATA
Tesi di dottorato di Giulia Macagno , 955271
Coordinatore del dottorato Tutore del dottorando
prof. Giovanni Maria Zuppi prof. Paulo A. L. D. Nunes
A mia madre
Acknowledgements
This thesis is the result of three years of work which would not have been possible without the help and support of several people.
First and foremost, I would like to thank my supervisor, Prof. Paulo Nunes who helped me develop analytical and critical skills and guided me through all the steps of this work.
Prof. Maria Loureiro has been, and will always be, a teacher, a friend and a mentor.
A special acknowledgement goes to my colleagues at Fondazione ENI Enrico Mattei in Venice, at IDEGA in Santiago de Compostela and at the European Investment Bank in Luxembourg, for making me feel at home and providing superb work environments.
I would also like to thank my parents for unconditioned love and support and my sister Irene for always being there in the time of need.
A particular thanks to Viviana, because we talked and laughed all the way through, to Laura, Laurie, Hélène, Sama and Alessia for remembering me that there is more in life than work and to Yasmina for her projects and plans and for being the best flatmate ever.
My final grateful thought goes to Antonio who always sees the best there is in me.
Table of Contents
Introduction ...10
1. Developing biodiversity indicators: An empirical approach ...12
1.1 Introduction... 13
1.2 Biodiversity conservation in the international political context ... 14
1.3 Biodiversity indicators ... 15
1.3.1 The rationale and functions of biodiversity indicators ... 15
1.3.2 Review of existing indicators on the status and trends of the components of biodiversity ... 16
1.4 The Natura 2000 database as a source of biodiversity information... 20
1.4.1 The Habitats and Birds Directive and the Natura 2000 database ... 21
1.4.2 A protocol for constructing biodiversity indicators using the Natura 2000 database ... 23
1.5 Biodiversity indicators as policy decision and evaluation tools ... 25
2. Tourism demand and biodiversity: A worldwide analysis...31
2.1 Introduction and scope of the analysis... 32
2.2 Motivation of the study... 33
2.3 Literature review on the determinants of tourism demand ... 34
2.4 Description of the data sources ... 35
2.5 Selection of biodiversity indicators ... 36
2.6 Model for national tourism flows ... 37
2.6.1 Econometric model specification and estimation results... 37
2.6.2 A model for coastal tourism flows... 40
2.7 Synthesis ... 41
2.8 Conclusions and inputs for further research ... 42
3. Assessing the impact of biodiversity on tourism flows: A model for tourist behaviour and policy implications...50
3.1 Introduction... 51
3.2 Background and literature review on tourism demand modelling... 52
3.3 Description of data sources... 53
3.3.1 Travellers’ socio-demographic characteristics and trip information ... 53
3.3.2 Biodiversity and landscape indicators ... 54
3.4 Data treatment and construction of a biodiversity metrics ... 55
3.4.1 Review of existing indicators ... 55
3.4.2 Construction of biodiversity and landscape profiles... 57
3.5 Impact of biodiversity and landscape profiles on Irish tourism flows... 59
3.5.1 Irish biodiversity and landscape profiles ... 59
3.5.2 Socio-demographic characteristics and travel specific features ... 61
3.6 Demand for tourism ... 61
3.6.1 Econometric model specification ... 61
3.6.2 Estimation results... 63
3.7 Policy discussion... 65
3.7.1 Economic valuation of the welfare impact of a marginal change in the values of biodiversity indicators... 65
3.7.2 Further discussion... 67
3.8 Concluding remarks... 68
4. The influence of landscape diversity on tourist destination choice: A regional perspective...85
4.1 Introduction... 86
4.2 Literature review on the determinants of tourism demand and landscape amenities ... 86
4.3 Review of existing landscape metrics... 88
4.4 Construction of landscape metrics using the CORINE Land Cover inventory ... 90
4.5 The Tuscany case study ... 91
4.6 Description of the selected variables and data sources ... 92
4.6.1 Landscape diversity indicators for Tuscany ... 92
4.6.2 Tourism flows to Tuscany: state and trends ... 93
4.7 Model specification and estimation results... 94
4.7.1 Disaggregating the results according to the tourists’ origin: a model for international and domestic tourism ... 96
4.8 Discussion and further research needs... 97
5. Agricultural pressures on biodiversity conservation: An analysis of the effectiveness of Natura 2000 network in Italy...109
5.1 Introduction... 110
5.2 Literature review on the impacts of agricultural activities on biodiversity ... 111
5.3 Review of biodiversity and agricultural pressure indicators... 113
5.4 The Natura 2000 network and the structure of the database... 116
5.5 Developing biodiversity and agricultural pressure indicators using the Natura
2000 database ... 118
5.6 The Italian case study ... 120
5.6.1 Descriptive statistics of the Italian Natura 2000 sites... 120
5.6.2 Agricultural pressures... 121
5.6.3 Biodiversity profiles ... 123
5.7 Model specification and estimation results... 123
5.8 Further analysis: indirect impacts of agricultural activities on tourism flows... 125
5.9 Conclusions... 126
Conclusion...139
Estratto per riassunto della tesi di dottorato ...141
List of Tables
Table 1—1 -Biodiversity indicators identified by the European Union and the EEA within the CBD focal area “Status and Trends of the components of biological diversity”
...27
Table 1—2 -Development of biodiversity indicators from the Natura 2000 database...27
Table 2—1 Modelling tourism flows according to origin and type of destination ...44
Table 2—2 Description of the data sources...44
Table 2—3 Results of the worldwide model specification...45
Table 2—4 Regression after stepwise removal of insignificant variables (international tourists) ...45
Table 2—5 Regression after stepwise removal of insignificant variables (domestic tourists) ...45
Table 2—6 Results of the coastal model specification...46
Table 2—7 Regression after stepwise removal of insignificant variables (international tourists) ...46
Table 2—8 Regression after stepwise removal of insignificant variables (domestic tourists) ...46
Table 3—1 Streamlining of biodiversity indicators ...71
Table 3—2 Values of biodiversity indicators across Irish counties ...72
Table 3—3 Surface covered by protected habitats per county (km2) ...73
Table 3—4 Coverage of protected habitats per county (share of protected areas)...74
Table 3—5 Summary statistics of socio-demographic and trip-specific characteristics ..75
Table 3—6 GLS regression results...76
Table 3—7 Results of the Poisson regression analysis and incident rate ratios...77
Table 3—8 Annual welfare change due to a 10% change in biodiversity indicators...78
Table 3—9 Correlation between monetary value of a change in species abundance and scores for species richness...79
Table 3—10 Correlation between monetary value of a change in habitat abundance and scores for habitat richness ...80
Table 3—11 Results of the regression analysis of annual welfare change against the different components of species abundance and their cross products ...81
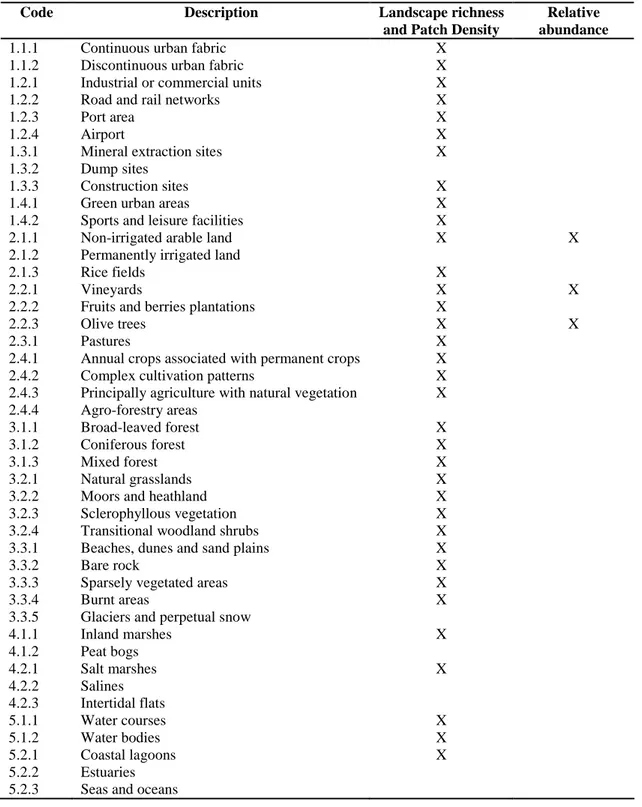
Table 4—1 CORINE Land Cover classification and classes considered in the development of landscape metrics...100
Table 4—2 Description of the data sources...101
Table 4—3 Scores in the landscape metrics for Tuscan provinces ...101
Table 4—4 Descriptive statistics of 2007 tourist arrivals in Tuscany by origin and tourism resource ...102
Table 4—5 Estimation results for total tourist arrivals ...103
Table 4—6 Stepwise removal of insignificant variables for total tourist arrivals...103
Table 4—7 Estimation results for international and domestic tourist arrivals ...104
Table 4—8 Stepwise removal of insignificant variables for international tourist arrivals ...105
Table 4—9 Stepwise removal of insignificant variables for domestic tourist arrivals...105
Table 4—10 Correlation coefficients among the selected landscape metrics ...105
Table 5—1 Influence and intensity of agricultural activities ...129
Table 5—2 Description of NUTS 2 regions in Italy ...129
Table 5—3 Typologies of institutional protection in the Italian sample...130
Table 5—4 Score of the agricultural pressure index by activity ...131
Table 5—5 Descriptive statistics and scores of the agricultural pressure indicators across Italian regions ...132
Table 5—6 Scores of biodiversity indicators across Italian regions ...133
Table 5—7 Estimation results for the linear model...134
Table 5—8 Estimation results for the model using the site area as a weighting factor..134
Table 5—9 Impact of biodiversity on regional tourist arrivals ...135
Table 5—10 Impact of agricultural activities on regional tourist arrivals...135
List of Figures
Figure 5-1 Classification of agricultural activities in the Natura 2000 database...128
10
Introduction
At the very basis of biodiversity conservation stands the need to be able to quantify status and trends of biodiversity. Since biodiversity is too complex to be fully quantified at scales that are policy relevant, its assessment can be done by means of indicators. There are three basic functions of indicators: simplification, quantification and communication. The first function refers to the identification of the main components of complex phenomena, while the second deals with making them quantifiable. Finally, indicators should be easily understandable so that the information they convey can be communicated (EEA, 2003).
Biodiversity indicators must supply significant and meaningful information to policymakers and other stakeholders. As far as policy makers are concerned, the indicators should describe the effectiveness of policy choices and must, therefore, be able to indicate cause-effect relationships and provide a reliable trigger for action. In addition, biodiversity is valuable for a vast array of stakeholders in many different ways. As a consequence, indicators should reflect these values and should be tailored on the requirements and degree of knowledge of the various audiences to which they are addressed.
The need for the development of biodiversity indicators has been acknowledged by international institutions as well as by national governments in the last two decades and the Convention on Biological Diversity of 1992 represents the starting point of this process.
Subsequently several attempts have been made to define the most important components of biodiversity and the relevant indicators to measure their status (EEA, 2003; EEA, 2007). In addition, various studies have reviewed advantages and shortcomings, as well as data availability for the computation of those indicators (Ten Brink, 2000; EASAC, 2005).
The literature review showed that conservation biologists use biodiversity indicators in order to establish conservation priorities and monitoring needs. However, although biodiversity protection can be an objective in itself, it seems important to underline that biodiversity provides direct benefits to human well-being, even though this linkages still show a large uncertainty component.
This thesis aims at establishing a link between biodiversity, measured via indicators, and human well-being, through the impact exerted by biodiversity on different economic sectors.
This analysis allows drawing some interesting conclusions on the potential for using biodiversity indicators in the definition of priorities in biodiversity conservation. This represents a step forward in the role of biodiversity indicators, from being measures of the status and trends of biodiversity to being adopted as policy and decision-making tools. This thesis is structured as follows.
Chapter 1 provides a description of the state of the art of the use of biodiversity indicators, through an extensive review of indicators already developed and used in literature, highlighting the main advantages and shortcomings of each of them. Subsequently, an indicator development process is described and applied to the information available from an existing database, the Natura 2000 Database.
In Chapter 2 indicators are used to define biodiversity and landscape profiles for 207 countries worldwide. The analysis then focuses on the differences between international and domestic tourism flows as far as their respective demand for biodiversity and landscape quality is concerned. A second stage of the analysis is centred specifically on tourism heading to coastal regions, in order to identify potential peculiarities of coastal tourism as far as the demand for biodiversity and landscape is concerned.
Chapter 3 provides an example of how biodiversity can be measured by means of the different indicators presented in Chapter 1, and how the latter can be used to assess the influence of the biodiversity profile of a destination on the tourism flows towards it. This analysis is implemented at the national level on domestic tourism flows, choosing Ireland as a case study.
In Chapter 4 landscape diversity indicators are constructed following a process analogous to the one implemented for biodiversity, using data retrieved from the CORINE Land Cover Database. These indicators are then included, together with climatic and socio-demographic variables, in a model aiming at describing tourist flow towards a destination. This analysis is implemented at the sub-national level, choosing the municipalities of Tuscany, Italy, as a case study.
Finally, Chapter 5 presents an alternative use of biodiversity indicators, evaluating the effectiveness of a network of protected areas in preserving species and habitat diversity from pressures arising from agricultural activities. The Italian Natura 2000 sites have been selected as a case study and the information contained in the Natura 2000 database has been used to develop two indices of pressures originating from agricultural activities. In addition to the impact of agriculture on biodiversity, a potential assessment of the impacts of biodiversity on tourism flows and of the indirect impact of agricultural pressures on tourism is provided.
1. Developing biodiversity indicators: An empirical approach
Giulia Macagno1
1School of Advanced Studies in Venice Foundation (SSAV), Università “Ca’ Foscari” di Venezia and Fondazione ENI Enrico Mattei (FEEM)
Abstract
Biodiversity is an extremely complex concept, whose aspects and features are difficult to describe as such. There is a widespread consensus on the need to develop indicators suitable for describing the different aspects of biodiversity and identifying their status and trends.
This paper analyses the progress made so far, both by the scientific community and international and European political institutions, in the development of biodiversity indicators. Against that background, an empirical approach to the construction of biodiversity indicators will be proposed, taking advantage of the Natura 2000 database, which incorporates information on species and habitats of European interest existing on the territory of the European Union Member States.
The process leading to the construction of biodiversity indicators will be presented in detail and their applicability will be discussed. Finally, some suggestion are put forward concerning the use of biodiversity indicators, not only as a means for assessing the progress towards policy objectives, but also as a useful tool to make policy decisions and evaluate their effectiveness.
Keywords: Biodiversity indicators, Natura 2000, Species diversity, Habitat diversity, Decision-making tool
1.1 Introduction
Providing a simple yet comprehensive definition of biodiversity is a challenging task. Noss (1990) suggests that, rather than looking for such a definition, the focus should be placed on the identification of the major components of biodiversity at several levels of organization.
This would allow identifying a set of measurable indicators, assessing the overall status of biodiversity and monitoring its trends.
Three primary attributes which constitute the biodiversity of an area can be identified:
composition, structure, and function. Composition concerns the variety of elements and includes species lists and measures of species diversity and genetic diversity. Structure refers to the physical organization of a system and it is mainly linked to habitat complexity and to the pattern of landscape patches. Finally, function involves ecological processes, including gene flow, disturbances, and nutrient cycling (Franklin et al., 1981).
Noss (1990) maintains that biodiversity can be monitored at multiple levels of organization, as well as at multiple spatial and temporal scales. According to the chosen scale and the objective of the analysis different levels of resolution appear to be appropriate. In addition, no single indicator can adequately account for all the relevant aspects of biodiversity and a set of different indicators is required to build a complete biodiversity profile of an area.
This paper reviews the main developments in the identification and construction of biodiversity indicators promoted by the scientific community and international political institutions. The need for further specification of several identified indicators is recognized and an empirical approach is proposed adopting an existing database, Natura 2000, as the starting point. A detailed description of the proposed indicator construction and computation process is provided, highlighting its consistency with the international and European action towards biodiversity conservation. Finally, several conclusions and recommendations on the use of the developed biodiversity indicators are formulated.
14
1.2 Biodiversity conservation in the international political context
In view of providing a suitable framework for analysing the issue of biodiversity indicators, it seems important to begin with a brief description of the milestones of the indicator development process, with a particular focus on instruments related to the European Union.
The Convention on Biological Diversity was one of two major treaties opened for signature at the United Nations Conference on Environment and Development (UNCED) held in Rio de Janeiro in 1992 and it entered into force in 1993.
The treaty defines biodiversity as "the variability among living organisms from all sources including, inter alia, terrestrial, marine and other aquatic ecosystems and the ecological complexes of which they are part; this includes diversity within species, between species and of ecosystems". The main objectives of the Convention are the conservation of biological diversity, the sustainable use of its components and an equitable sharing of the benefits arising from the utilisation of genetic resources.
The Convention acknowledges the role of indicators as information tools that summarise data on complex environmental issues and describe the overall status and trends of biodiversity. Moreover, it highlights seven focal areas in which the development of indicators seems to be necessary, namely the status and trends of the components of biological diversity, the threats to biodiversity, ecosystem integrity and ecosystem goods and services, sustainable use, status of access and benefit sharing, status of resource transfers and use and public opinion.
The European Community signed the convention in 1993 and in 1998 adopted a European Community Biodiversity Strategy, in order to provide a framework for the implementation of the convention. The strategy reflects the broad obligations the EC endorsed with respect to the convention, as well as a detailed description of the activities to be implemented1. The strategy explicitly calls for the development of a set of indicators corresponding to these focal areas, so as to be able to measure progress towards the objective of reducing biodiversity loss.
In April 2002, the Parties to the CBD committed themselves to achieve a significant reduction of the current rate of biodiversity loss at the global, regional and national level by 2010. A review of the implementation of the strategy was initiated in 2004 and it led to the EC Communication on halting the loss of biodiversity by 2010 (EEA, 2007). At the Pan-
1 The Strategy identifies eight policy areas: conservation of natural resources, agriculture, fisheries, regional policy and spatial planning, forests, energy and transport, tourism and development and economic cooperation. In addition, concrete objectives and the way to achieve them are laid down in four Biodiversity Action Plans, published in 2001.
15
European level, an analogous objective of halting biodiversity loss by 2010 was agreed upon by pan-European environment ministers in the Kiev Resolution on Biodiversity signed in 2003. In addition, at national level, several countries have also included the 2010 target as part of their national biodiversity strategies. This widespread political agreement on the 2010 target has been accompanied by a growing consensus on the need for long-term, structured, global and European coordination of biodiversity monitoring and indicator development (EEA, 2007).
1.3 Biodiversity indicators
1.3.1 The rationale and functions of biodiversity indicators
At the very basis of biodiversity conservation stands the need to be able to quantify status and trends of biodiversity. Since biodiversity is too complex to be fully quantified at scales that are policy relevant, its assessment can be done by means of indicators. These can be considered as information tools, summarizing data on complex environmental issues to indicate the overall status and trends of biodiversity. They can be used to assess performance of policy choices and to signal key issues to be addressed. In addition, they are important tools for monitoring the status and trends of biological diversity and, in turn, feeding back information on ways to continually improve the effectiveness of biodiversity management programmes.
It must be acknowledged that, while research on environmental indicators has made significant progress in some sectors, such as forestry, far less has been made in developing indicators for biological diversity. This is due to scientific uncertainty, such as poor understanding of complex ecosystem processes and functions, and the limited availability of time series data.
There are three basic functions of indicators: simplification, quantification and communication. The first function refers to the identification of the main components of complex phenomena, while the second deals with making them quantifiable. Finally, indicators should be easily understandable so that the information they convey can be communicated (EEA, 2003). Biodiversity indicators must supply significant and meaningful information to policymakers and other stakeholders. As far as policy makers are concerned, the indicators should describe the effectiveness of policy choices and must, therefore, be able to indicate cause-effect relationships and provide a reliable trigger for action. For high-level policymakers, instead, indicators should provide a broad description of the overall biodiversity status. In addition, biodiversity is valuable for a vast array of stakeholders in
16
many different ways. As a consequence, indicators should reflect these values and should be tailored on the requirements and degree of knowledge of the various audiences to which they are addressed. These considerations lead to the need to develop a set of different measures of biodiversity allowing highlighting the most relevant aspects, depending on the specific context and on the issues to be addressed.
A crucial consideration that needs to be taken into account when choosing the appropriate biodiversity indicators is the geographical scale of the analysis. Information on biodiversity is usually collected locally but biodiversity indicators report trends at different spatial scales and their level of detail and accuracy is inversely proportional to scale. Aggregation of data to wider geographical scales is useful in that it allows identifying trends at a policy-relevant level. However, this may mask significant changes in biodiversity occurring at the local scale.
1.3.2 Review of existing indicators on the status and trends of the components of biodiversity
The previous sections traced an overview of the international and European action and policy decisions towards the objective of reducing biodiversity loss and of developing appropriate indicators to monitor progress towards this target. The European Environmental Agency has elaborated fifteen headline indicators covering all the focal areas identified by the CBD. In addition, a set of 26 specific indicators have been developed to address the different aspects of each headline indicator (EEA, 2007).
Since the focus of this study is the identification of indicators for measuring status and trends of the different components of biodiversity, it seems interesting to describe in detail the specific indicators referring to this focal area. Table 1—1 displays the indicator hierarchy moving from the CBD focal area, to the European Union headline indicators and to the specific indicators proposed by the European Environmental Agency.
**Insert Table 1—1 about here**
The abundance and distribution of selected species is a state indicator, measuring the number of individuals of each species living in a particular area. This indicator appears to be policy relevant, since it contributes to the evaluation of conservation and land use policies, and biodiversity relevant, since viable populations indicate the presence of healthy habitats and ecosystems (EEA, 2007).
For most EU Member States, high-quality data are available for a large number of vertebrate
17
species, mainly birds, mammals, amphibians and fishes, some invertebrate species, especially butterflies, and several groups of plants. However, long-term data series would be necessary in order to properly assess trends and evolutions. This indicator can be easily aggregated and is cost-effective, since most of the information is collected by amateurs and professionals.
When dealing with species diversity it seems worth mentioning species richness. This indicator refers to the number of different species recorded in a particular site and it can be expressed both as the number per unit of area and the number per habitat type. The main shortcoming of this indicator is that trends must be assessed for a large number of species and this process is costly. Moreover, species richness depends on the considered spatial scale, since the larger the scale, the greater the diversity. Finally, this indicator appears to be rather insensitive to changes, since, before observing a reduction in the number of species, a long process of species abundance degradation takes place, without being reflected by the indicator (Ten Brink, 2000). On the other hand, this appears to be the most intuitive and easy to compute species diversity indicator. It can be suitable for wider spatial scales of analysis, for which it would not be possible to achieve a deep level of detail and, for smaller scale studies, it can be coupled with the abundance indicator and complete the information provided by the latter.
Conservation biologists use richness and abundance of selected species as indicators in order to establish conservation priorities and monitoring needs. Indicator species prove to be useful in describing the magnitude of anthropogenic disturbance (Medellin et al., 2000; Hill et al, 1995; Nummellin, 1998), to monitor the deterioration and loss of specific ecosystems (Altieri, 1999), to account for population trends in other species (Block et al., 1987, Suter, 2002) and to define biodiversity hotspots. In addition the geographical range of some species can be used to identify area surfaces that should be protected. Finally, the abundance and richness of particular species can be employed as a tourist attraction factor (Caro and O’Doherty, 1999).
The second indicator mentioned by the EEA is the Red List Index for European species reflects the proportion of species expected to remain extant in the near future in the absence of additional conservation action. The methodology for the computation of this indicator has been developed by Butchard et al (2004) and it considers the number of different species recorded in each IUCN Red List category. There are three main categories for species at high risk of extinction, namely critically endangered, endangered and vulnerable.2 Red List
2 The World Conservation Union (IUCN) has published lists of species at risk of extinction since the 1950s, compiling these as Red Data Books since the 1960s and as Red Lists since the 1980s. Initially,
18
Indices are calculated from the number of species in each category in each assessment, and trends are assessed through the number of species changing categories as a result of genuine improvement or deterioration status (Butchard et al., 2004).
This indicator is highly relevant to the 2010 target, explicitly addressing species extinctions, a key component of biodiversity loss. It is also biodiversity relevant, since it relates to the rate at which species are slipping towards extinction, and to the proportion of species expected to remain extant in the near future, barring additional conservation actions (EEA, 2003). Another significant strength of the RLI is that it is highly representative, being based on assessments of a high proportion of species in a taxonomic group across the world (Butchard et al., 2004). However, this indicator presents a resolution problem, since the size, trend or distribution of populations may have to undergo quite substantial changes before qualifying for a higher or lower Red List category, and hence before changing the RLI value.
The indicator species of European interest covers the species which are considered to be of European interest, selected because they were perceived to be under some sort of threat at an EU scale and listed in Annexes II, IV and V of the Council Directive 92/43/EEC on the conservation of natural habitats and wild fauna and flora, known as the Habitat Directive3. The considered species cover various taxonomic groups, trophic levels and habitats. The indicator directly reflects success of the Habitats Directive, therefore it is highly relevant for Member States and EU nature conservation policy. The main disadvantage of this indicator is the limited trend information since the data will only be reported in a six-year cycle. In addition, the indicator is based on the EU Habitats Directive, implying that a transfer to the global level would not be possible.
Ecosystem coverage reflects the proportional and absolute change in the extent of different land cover categories in the period 1990 – 2000, as defined by the CORINE Land Cover Database4. The database takes into account thirteen ecosystem types, namely forests,
species were assigned to qualitatively defined categories. To improve objectivity and consistency of application, the IUCN Species Survival Commission initiated the development of quantitative criteria in 1989. After several rounds of review and revision, a system was adopted in 1994 (IUCN 1994), with further revisions published in 2001 (IUCN 2001).
3 The Habitats Directive, together with the Birds Directive, forms the cornerstone of Europe's nature conservation policy. It is built around two pillars: the Natura 2000 network of protected sites and the strict system of species protection. All in all the directive protects over 1.000 animals and plant species and over 200 so called "habitat types", e.g. special types of forests, meadows and wetlands, which are of European importance.
4 The objective of the pan-European project CORINE Land Cover (CLC) is the provision of a unique and comparable data set of land cover for Europe. It is part of the European Union programme CORINE (Coordination of Information on the Environment). The mapping of the land cover and land use was performed on the basis of satellite remote sensing images on a scale of 1:100,000. The first CLC data base CLC1990, which was finalised in the 1990s, consistently provided land use information comprising 44 classes.
19
cropland, semi natural vegetation, wetlands, inland water systems, glaciers, permanent snow and urban, constructed, industrial and artificial areas. This indicator is based on the interpretation of satellite imagery.
Ecosystem coverage is highly relevant for the 2010 target, since it indicates the area of available habitats and ecosystems across Europe, in fact, a dramatic decrease in the area covered by a particular ecosystem will have a negative influence on the species dependent on it. The CORINE Land Cover methodology is well established and widely acknowledged;
nonetheless, the use of remote sensing data implies that some degree of detail is lost. As a matter of fact, the minimal unit is fixed at 25 hectares, meaning that smaller areas of certain habitat types may not be adequately detected.
Indicators of land cover change have been used in literature in the assessment of the environmental impact of urban expansion and green space dynamics (Pauleit et al., 2005), to assess the diversity and abundance of specific land cover types and biodiversity (Firbank, 2003) and as land quality indicators (Dumanski and Pieri, 2000). Habitats of European interest, as already pointed out for species, refer to protected habitats identified by the Habitats Directive, for which Member States have monitoring and reporting obligations concerning their conservation status. This is a policy relevant indicator, directly indicating the implementation and success of the Habitats Directive. Results can be aggregated to the European level. However, the data will be reported on a six-year basis and an extension of this indicator to a wider geographical scale will not be possible.
Livestock genetic diversity refers to the share of breeding female population between introduced and native breed species, namely, cattle and sheep, per country, as a proxy for the genetic diversity of these species. This indicator addresses each Member State’s responsibility to maintain native breeds, as a contribution to global genetic diversity, and the level of threat to which these native breeds are subject. In addition, it refers to genetic diversity, which is one of the three main components of biodiversity, and directly shows biodiversity loss. Livestock genetic diversity has been employed in the conservation policy literature in order to determine the optimal allocation of funding in order to minimize genetic diversity loss (Simianer et al., 2003) and to evaluate the loss of farm genetic diversity resources (Wollny, 2003).
The coverage of nationally designated protected areas, illustrates the rate of growth in the number and total area of nationally protected areas over time. There is international acceptance of the indicator at a global, regional and national scale and it provides information and can be used at different scales. Information on sites that have been designated for conservation purposes should be available in every country. However, this
20
does not describe the quality of management or whether the areas are protected from incompatible uses. The coverage and the effectiveness of protected areas has been employed as a measure of the progress towards biodiversity conservation targets (Chape et al., 2005).
The coverage of sites designated under the EU Habitats and Birds Directive shows trends in spatial coverage of proposed sites. As far as data collection and methodology are concerned, EU Member States have already put in place procedures for compilation of information on Natura 2000 sites at both national and regional levels. The main shortcoming of this indicator is that it only applies to EU Member States.
The analysis of the most widely acknowledged indicators of the status and trends of the components of biological diversity, shows that most of these indicators have already reached a good level of testing and they provide scientifically sound information. Moreover, most of them have already been employed in several studies aiming at assessing the effectiveness of conservation policies. The main obstacles to their further development seem to be data availability constraints and the limited comparability of data derived from different sources.
It is interesting to notice that an explicit reference is made by the European Environment agency to the Habitats and Birds Directives and the possibility to use the information collected by EU Member States to assess trends in the conservation of European biodiversity. Data collection has already started and the result of this process has been the creation of the Nautra 2000 database. However, both the analysis of official reports by EU institutions and the literature review concerning conservation policy choices highlight that no attempts have been made so far to use this database to compute indicators on the status of biodiversity. The remainder of this paper will provide a brief description of the structure of this database and propose an innovative indicator-building protocol employing this information.
1.4 The Natura 2000 database as a source of biodiversity information
The objective of this paper is to provide a further specification and an empirical application of the indicators proposed by the EEA, which are directly linked to the implementation of the Habitats and Birds Directives, namely species of European interest, habitats of European interest and coverage of sites designated under the EU Habitats and Birds Directives.
The Natura 2000 database can be considered as a sort of snapshot of the biodiversity profile of European countries. As highlighted by the literature review on indicators, in order to be able to evaluate the trends and changes in such profiles, data should be available over a long time span for all countries and all species and habitats. For the time being the database does not have such characteristics, nonetheless, it appears to be a remarkable source of
21
information and it can be used to construct biodiversity profiles at the national and sub- national level. This section will briefly describe the framework within which the European Natura 2000 network is included and the kind of information the Natura 2000 database can provide.
1.4.1 The Habitats and Birds Directive and the Natura 2000 database
The Directive 79/409/EC on the conservation of wild birds, commonly referred to as the Birds Directive aims at maintaining bird species at a level which guarantees the respect of ecological, scientific and cultural requirements, while, at the same time, taking into account economic and recreational needs (European Community, 1979). In order to achieve this result, the Directive formulates specific measures to be adopted by Member States, including the establishment of special protection areas (SPAs). Protected species are listed in Annexes I to V of the directive.
The Directive 92/43/EEC on the conservation of natural habitats and wild fauna and flora, commonly referred to as the Habitats Directive, aims at protecting biodiversity through the conservation of natural habitats and of wild fauna and flora in the territory of the EU Member States (European Community, 1992). In order to achieve its objective, the directive requires the establishment of a European ecological network, called Natura 2000, consisting of special areas for conservation (SACs), to be designated under the habitats directive, and the SPAs, designated under the Birds Directive. Habitats and species to be affected by the directive and special measures to be taken are listed in Annex I to VI of the Directive. In view of implementing the requirements of both directives, the European Commission has established a standard format for the collection of relevant information from member countries, in order to create an overall database.
The information each country must provide is related to site identification, location and description, ecological information on species and habitats, the level of institutional protection the site is granted and relation with CORINE biotope sites. In addition, information on activities implemented in and around the site must be provided, together with maps and other supporting material.
The ecological information concerning the sites appears to be the most relevant aspect, in view of developing biodiversity indicators. Member states must provide a detail description of all the habitat types, as listed in Annex I of the Habitats Directive, and all flora and fauna species, listed in Annex II, present in each site. An evaluation of each habitat according to different criteria is required. The criteria are representativity, relative surface, conservation
22
status and global assessment and site managing authorities need to attach a ranking to each of them for each habitat. Rankings are based on an ordinal scale, ranging from A to D. It is important to remind that those rankings are associated to different meanings depending on the criterion under consideration.
Representativity gives a measure of “how typical a habitat is” and in this case the rankings mean excellent, good, significant and non-significant representativity. Relative surface represents the area of the site covered by a particular habitat in relation to the total area it covers at the national level. In this case, the rankings indicate a share ranging from 100% to 15%, from 15% to 2% and from 2% to 0% respectively.
Conservation status reflects the degree of conservation of the structure and functions of the habitat as well as its restoration possibilities. Finally, global assessment implies an overall valuation of the previous criteria, taking into account the different weights that each criterion can assume in different circumstances and for different habitat types. For these last two criteria, rankings mean excellent, good and average or reduced conservation status or global assessment.
As far as flora and fauna species are concerned six taxa, amphibians and reptiles, birds, fishes, invertebrates, mammals and plants, are assessed separately. Since, the site can be important for different stages of the life cycle of a species, for each species it must be stated if it is resident, breeding, staging or wintering in the considered site.
Site managing authorities need to evaluate each species according to four criteria: population size, isolation, conservation status and global assessment. The rankings that can be attached to each criterion are once more based on a scale ranging from A to D.
The first criterion reflects the size and density of the population present in a site in relation to the population of the same species living on the national territory. Rankings A, B and C identify a percentage ranging from 100% to 15%, from 15% to 2% and from 2% to 0%, respectively.
The second criterion deals with the degree of geographic isolation of each population in each site with respect to the natural range of the species to which it belongs. This criterion can be interpreted as a measure of the contribution of a given population to genetic diversity of its species. A signals an almost complete isolation, B suggests that the population is not isolated but lives on the margins of the distribution area, while C implies that the population lives in an extended distribution range.
The conservation status refers to the degree of conservation of the habitat characteristics that are crucial for the survival of each species, as well as the restoration possibilities of those characteristics. The global assessment gives a measure of the value of each site for the
23
conservation of the considered species. As pointed out for habitats, the rankings must be interpreted as excellent, good and an average or reduced conservation status or global assessment.
In addition to the ecological information, a general description of the main features of the site, including geological, morphological and landscape characteristics, is required. Finally, all human activities or natural processes occurring inside or around protected sites need to be specified. Member states are required to specify the influence and the intensity of each activity, as well as the share of the site affected.
1.4.2 A protocol for constructing biodiversity indicators using the Natura 2000 database
The indicators relating to species and habitats of European interest and the coverage of protected areas proposed by the EEA, appear to need further specification. This section provides an example of how the Natura 2000 database can be used to obtain more precise indicators at the site level. The information contained in the database appears to be extremely detailed, thus it has been necessary to select the most relevant aspects in view of constructing biodiversity indicators.
As far as the species of European interest are concerned, three specific indicators have been developed, namely species richness, species abundance and species isolation; each of them reflects a different aspect of species diversity. Species richness provides information on the ratio between the number of species present in each site and the number of species existing at the national level. This indicator has been calculated for each taxon and then an average was computed among the six taxa, so as to obtain a single value per site. The underlying assumption is the concept of “inter-species democracy”, meaning that species are considered equally important, regardless for the taxon to which they belong.
Species abundance is constructed adopting the information provided by the population criterion specified by the database and reflecting the share of specimen present in a site out of the total species population living on the national territory. Species isolation represents the degree of isolation of a population living in one site with respect to the geographic range of the species to which it belongs. For the purpose of this study it has been used as a proxy to genetic diversity, since a population having limited contacts with other individuals of the same species is likely to preserve some peculiar genetic traits.
Habitat richness represents the ratio between the number of habitats recorded in each site and
24
the total number of habitats existing at the national level, while habitat abundance describes each habitat’s relative surface in a site with respect to the total area it covers at the national level. Finally, site coverage delivers the percentage of land covered by Natura 2000 sites with respect to the total surface of the national territory. Table 1—2 highlights the link between the EEA proposed indicators and the ones developed in this study.
**Insert Table 1—2 about here**
As pointed out when describing the structure of the Natura 2000 database, each protected species and habitat is evaluated by site managing authorities according to a set of criteria and the rankings are based on an ordinal scale ranging from A to C. It appeared crucial to attach a numerical value to those rankings, so as to develop the biodiversity indicators. When species population and habitat relative surface are concerned, the Natura 2000 database defines the rankings as indicating a share of the total species population, or total habitat surface, at the country level. Bearing in mind that “A” represents a share ranging from 100%
to 15%, “B” from 15% to 2% and “C” from 2% to 0%, it has been decided to associate ranking A to a value of 100, ranking B to a value of 15 and ranking C to a value of 2, choosing the upper limit of the interval defined by the database5.
The species abundance, species isolation and habitat abundance indicators have been computed according to Equation (1.1):
i i
i x
) No. "C"
No. "B"
(No. "A"
) n (Isolatio
Abundance = ×100+ ×15+ ×2
(1.1)
where xi represents the number of species or habitats present in the site.
Since species richness and habitat richness have been defined as the number of different species and habitats recorded in a site with respect to the number of species and habitats existing on the national territory, these indicators have been computed according to Equation (1.2):
j i
x Richness= x
(1.2)
5 This is an arbitrary choice and alternatives are possible. For instance, it could have been decided to attach the mean value of each interval to those rankings. However, since these indicators are used to produce biodiversity profiles at the site level, with the objective of comparing different locations, the choice of the value exerts a limited influence on the results of the analysis.
25
where xi represents the number of habitats or species present in the site and xj stands for the number of protected species or habitats existing on the national territory.
Finally, the coverage of Natura 2000 sites depends on the unit of analysis, according to Equation (1.3):
j n
i i
A A eas
otected Ar f
Coverage o
∑
= =1
Pr
(1.3)
where Ai represents the site area and Aj the total surface of the unit of analysis. The score of each indicator is normalised on an interval ranging from 0 to 1.
The result of this process has been the construction of a set of indicators addressing the most relevant aspects of species and habitat diversity. Furthermore, since they have been computed at the site level, they can be used for tracing biodiversity profiles of different areas of EU member states and can be aggregated at different spatial scales, from the national, to the regional and sub-regional level.
1.5 Biodiversity indicators as policy decision and evaluation tools
This paper has provided an overview of the policy scenario as well as of the progress achieved in the development of biodiversity indicators, with the aim of measuring status and trends of the different components of biodiversity. It must be highlighted that a remarkable effort, in terms of data collection, development and comparability of the indicators across different geographical scales has been done, both by the scientific community and international and European institutions. However, several gaps still need to be filled, with respect to both geographical coverage of the available datasets and the scientific understanding of anthropogenic and natural dynamics influencing biodiversity.
This analysis demonstrates that, on the one hand, the there is a need to further develop the indicators proposed so far, especially the ones relating to the species and habitats of European interest, and that, on the other hand, that the necessary information can be found in an existing database. The Natura 2000 database presents the advantage of establishing a common format for biodiversity data collection across European Member States and should guarantee a regular update of this information. In addition, since it provides information at the site level, the proposed indicators can be aggregated at any geographical scale.
The indicators proposed in this paper fulfil three different functions. Firstly, they measure the status of biodiversity in a particular area. Secondly, they can be employed in the
26
evaluation of conservation policies, since changes in their level score will reflect the effectiveness of the international and European action for biodiversity conservation. In addition, it could be possible to ascertain whether the level of protection granted to biodiversity manages to satisfactorily ensure its conservation, since a vast array of human activities, including agriculture, are implemented inside protected sites or in their surroundings and this could reduce the benefits of conservation policies.
However, the use of biodiversity indicators should not be limited to the description of status and trends and the evaluation of policy choices. Biodiversity plays a fundamental role in determining human wellbeing and, in many cases, this role is not fully understood and not thoroughly studied. It seems therefore important to remind that, although biodiversity conservation is certainly an end in itself, the benefits of conservation actions and policies can go well beyond the maintenance of the current levels of biodiversity.
Several economic sectors, in fact, can directly profit from high levels of biodiversity.
Against this background, biodiversity indicators could be considered as explanatory variables in models describing the profitability of those sectors. A useful example is tourism, where natural amenities, including biodiversity, play a remarkable role in determining tourism demand. A set of different indicators can be used to trace biodiversity profiles at the national and sub-national level and this, jointly with other variables, can be used to model tourism flows and tourist behaviour concerning the destination choice.
It seems possible to conclude that the construction of biodiversity indicators described in this paper, besides leading to an empirical measurement of status and trends of biodiversity, provides a useful tool for decision-making which may allow establishing priorities in biodiversity conservation policy choices.
Tables
Table 1—1 -Biodiversity indicators identified by the European Union and the EEA within the CBD focal area “Status and Trends of the components of biological diversity”
CBD Focal area EU headline indicators EEA specific indicator Trends in the abundance and
distribution of selected species
Abundance and distribution of selected species
Red List Index for European Species Change in the status of
threatened and/or protected
species Species of European Interest
Ecosystem coverage
Habitats of European interest Trends in the extent of
selected biomes, ecosystems and habitats
Livestock genetic diversity
Nationally designated protected areas Status and Trends of
the components of biological diversity
Coverage of protected areas
Sites designated under the EU Habitats and Birds Directives
Source: EEA, 2007
Table 1—2 -Development of biodiversity indicators from the Natura 2000 database EEA specific indicator Natura 2000 indicators Information from the Natura
2000 database
Species richness Number of different species in the site/ number of species in the country
Species abundance Species population Species of European Interest
Species genetic diversity Species isolation
Habitat richness Number of different habitats in the site/ number of habitats in the country
Habitats of European interest
Habitat abundance Habitat relative surface Sites designated under the EU
Habitats and Birds Directives
Site coverage Site area
Source: EEA, 2007; own elaboration
References
Altieri M (1999), The ecological role of biodiversity in agro-ecosystems, Agriculture, Ecosystems and Environment, Vol. 74, pp.19–31
Block W.M., Brennan L.A., Gutiérrez R.J. (1987), Evaluation of guild-indicator species for use in resource management, Environmental Management, Vol. 11, Issue 2, pp.265-269 Butchart SHM, Stattersfield AJ, Bennun LA, Shutes SM, Akçakaya H.R. (2004) Measuring Global Trends in the Status of Biodiversity: Red List Indices for Birds. PLoS Biol 2(12):
e383.
Caro, T. M.; O'Doherty G., (1999) On the Use of Surrogate Species in Conservation Biology, Conservation Biology, 13(4):805-814.
S Chape, Harrison J., Spalding M. and Lysenko I. (XXX), Measuring the extent and effectiveness of protected areas as an indicator for meeting global biodiversity targets, Phil.
Trans. R. Soc. B, Vol. 360, No. 1454, pp. 443 – 455
Dumanski J. and Pieri C. (2000), Land quality indicators: research plan, Agriculture, Ecosystems & Environment, Volume 81, Issue 2, pp. 93 – 102
Hill J. K., Hamer K. C., Lace L. A. and Banham W. M. T. (1995), Effects of Selective Logging on Tropical Forest Butterflies on Buru, Indonesia, Journal of Applied Ecology, Vol.
32, No. 4, pp. 754-760
Estrada A., Coates-Estrada R. and Meritt D. Jr. (1993), Bat Species Richness and Abundance in Tropical Rain Forest Fragments and in Agricultural Habitats at Los Tuxtlas, Mexico, Ecography, Vol. 16, No. 4, pp. 309-318
European Commission (1998), Communication from the Commission to the Council and the European Parliament on a European Community Biodiversity Strategy, COM (1998) 42, http://europa.eu/scadplus/leg/en/lvb/l28183.htm
European Environmental Agency (2003), An inventory of biodiversity indicators in Europe, 2002, Technical Report n. 92, Copenhagen, available on the website http://reports.eea.europa.eu/technical_report_2004_92/en/Technical92_for_web.pdf
Firbank L. G., Barr C. J., Bunce R. G. H., Furse M. T., Haines-Young R., Hornung M., Howard D. C., Sheail J., Sier A. and. Smart S. M (2003), Assessing stock and change in land cover and biodiversity in GB: an introduction to Countryside Survey 2000, Journal of Environmental Management, Volume 67, Issue 3, Pages 207-218
Franklin, J. F., K. Cromack, W. Denison (1981), Ecological characteristics of old-growth Douglas-fir forests, USDA Forest Service General Technical Report PNW- 1 18. Pacific Northwest Forest and Range Experiment Station, Portland, Oregon.
IUCN (1994), IUCN Red List categories, IUCN Species Survival Commission, Gland, Switzerland
IUCN (2001), IUCN Red List categories and criteria: version 3.1, IUCN Species Survival Commission; Gland, Switzerland
Medellin R. A., Equihua M., Amin M. A. (2000), Bat Diversity and Abundance as Indicators of Disturbance in Neotropical Rainforests, Conservation Biology, Volume 14, No. 6, pp.
1666-1675
Noss R. (1990), Indicators for monitoring biodiversity: A hierarchical approach, Conservation Biology, Volume 4, No. 4, pp.355 – 364
Nummelin M. (1998), Log-Normal Distribution of Species Abundances is not a Universal Indicator of Rain Forest Disturbance, Journal of Applied Ecology, Vol. 35, No. 3, pp. 454 – 457
Suter W. Graf R. F., Ruedi H. (2002), Capercaillie (Tetrao urogallus) and Avian Biodiversity: Testing the Umbrella-Species Concept. Conservation Biology, Vol. 16, No. 3, pp. 778 – 788
Pauleit S., Ennos R. and Golding Y. (2005), Modeling the environmental impacts of urban land use and land cover change—a study in Merseyside, UK, Landscape and Urban Planning, Vol. 71, Issues 2-4, pp. 295 – 310
Simianer H., Marti S.B., Gibson J., Hanotte O., Rege J.E.O. (2003), An approach to the optimal allocation of conservation funds to minimize loss of genetic diversity between livestock breeds, Ecological Economics, Vol. 45, pp. 377 – 392
Wollny C.B.A (2003), The need to conserve farm animal genetic resources in Africa: should policy makers be concerned?, Ecological Economics, Vol. 45, Issue 3, pp. 341 – 351
2. Tourism demand and biodiversity: A worldwide analysis
Giulia Macagno1, Paulo A.L.D. Nunes2
1School of Advanced Studies in Venice Foundation (SSAV), Università “Ca’ Foscari” di Venezia and Fondazione ENI Enrico Mattei (FEEM)
2Università “Ca’ Foscari” di Venezia and Fondazione ENI Enrico Mattei (FEEM)
Abstract
Tourism is the largest business sector of the world economy, accounting for 10% of global GDP and 35% of the world’s export services. The tourism industry heavily depends on a healthy environment since visitors tend to look for beautiful places to spend their holidays, characterised by warm weather, sunshine, pristine nature and clean air and water. It can be argued that tourists seek the same conditions that tend to be associated to high levels of biodiversity.
Against this background, this paper aims at the study of the impacts of biodiversity on tourism flows at the worldwide level, testing whether species and habitat diversity can exert a significant influence on the tourist’s destination choice. Tourist arrivals in 207 countries have been analysed and disentangled into an international and a domestic component.
International and domestic flows have been modelled as a function of the characteristics of the trip, the country’s socio-economic conditions, natural and cultural attractions and species and habitat diversity. Results allow concluding that, on the one hand, species and habitat diversity can influence tourists’ destination choice, and that, on the other hand, significant differences exist between international and domestic tourism demand. As a matter of fact, the former appears to be more heavily influenced by the number of different species and well-known natural and cultural attractions, while the latter seems to be more interested in the surface covered by specific habitats, especially forests, and in the conservation status, rather than in the number, of the species living in their country.
Keywords: International tourism, domestic tourism, species diversity, habitat diversity, biodiversity indicators
2.1 Introduction and scope of the analysis
Tourism is the largest business sector of the world economy, accounting for 10% of global GDP and 35% of the world’s export services. Since 1985, tourism flows have been growing an average of 9% per year. In 2005, receipts from international tourism reached US$ 6.82 trillion, an increase of $49 billion over 2004 (Honey and Krantz, 2007). Tourism, shows a stronger dependency on a healthy environment than other industries and economic sectors. A recent study commissioned by the WWF highlighted that tourists seek beautiful places to spend their holidays and they tend to look for the same conditions that are generally associated to high biodiversity, namely warm weather, sunshine, pristine nature and clean air and water (Honey and Krantz, 2007).
This paper aims at analysing the impacts of biodiversity on tourism flows at the worldwide level. The underlying hypothesis to be tested is that species and habitat diversity can exert a significant influence on the tourist’s destination choice. Furthermore, the demand for a country’s tourism services can be disentangled into an international and a domestic component, which may follow distinct patterns and may be sensitive to different aspects of the biodiversity profile of the destination. Therefore we shall focus on both international and domestic tourism arrivals in 207 countries, adopting 1995 as a reference year, and explore the links between tourism flows and species and habitat diversity. In order to describe each country’s biodiversity profile, a set of suitable species and habitat diversity indicators have been selected, using data published by the World Bank and the World Resource Institute.
In this context, the present paper builds upon the state of the art literature extending the current tourist destination choice models to include biodiversity variables in addition to the widely used socio-economic characteristics of the destination, climate factors as well as the proximity of natural and cultural heritage sites. Moreover, two sets of models will be proposed. The first will describe tourism flows at the national level, while the second will focus on each country’s coastal regions, performing a separate analysis for international and domestic arrivals, as displayed in Table 2—1.
**Insert Table 2—1 about here**
The paper organized as follows. Section 2.2 highlights the features of the global tourism demand and its growth perspectives. Section 2.3 provides a review of the relevant literature on the determinants of tourism destination choice. Section 2.4 describes the data sources used for this analysis and Section 2.5 justifies the choice of the selected biodiversity indicators. The model specification and the estimation results are discussed in Section 2.6, while Section 2.7 uses those results to trace two distinct profiles for international and