9
Chapter 2
GROWTH, MELTING, DISSOLUTION, CHEMICAL ZONING
AND MORPHOLOGY OF FELDSPARS
2.1 Growth and Dissolution
2.1.1. General considerations
Crystal growth theory and mechanisms were reviewed by Carmichael et al. (1974), Tiller (1977), Kirkpatrick (1975, 1981), Lasaga (1982) and Baronnet (1984) and data on growth in silicates and feldspars by Lofgren (1980) and Kirkpatrick (1981). Crystal growth may be constrained or unconstrained (Tiller 1977). In constrained growth the temperature of growing crystal is held lower than that of the melt from which it grows (normal single crystal growth in the laboratory or in industry, growth of crystals inward from the walls or roof of an intrusion [Lofgren and Donaldson 1975), from the surface of a lava flow or lake]. In unconstrained growth the temperature of growing crystal is higher, due to latent heat, than the melt (isothermal growth experiments, free growth of crystal in a magma).
Crystal growth rate may be controlled by:
1. Interface kinetics which depend on the rearrangement of atoms or groups of atoms at the crystals/liquid interface;
2. Transport and diffusion of material in the liquid toward and away the interface; 3. Removal of latent heat of crystallization from the interface;
4. Changes in volume between the liquid and crystal.
(2) Only applies if growing crystal differs in composition from the liquid; (2) and (3) are transport phenomena; (4) is unimportant in free growth. Transport of heat and matter may also occur by convection. Generally, interface kinetics dominate at low undercoolings, while either transport of heat and matter becomes more important at larger undercoolings. As heat flow from a growing crystal is generally considerably faster than the flow of matter, local temperature gradients should be less pronounced than compositional gradient. However, diffusion of matter becomes slower as T decrease so that transport of matter will undoubtedly be rate limiting at moderate to large undercoolings. Interaction occurs between interface kinetics and the shape of the growing crystal, the curvature of possibly faces and defects incorporated during growth. Where crystal growth forms are dendritic or spherulitic, pressure
differences may arise at the head of tube-like constrictions due to volume changes (Tiller 1977), leading to the production of melt or vapor inclusions. Where diffusion is required, density differences may arise at the interface due to concentration of light or dense components leading to convection. Defects include dislocations, which may arise in part through stress related to growth (Tiller 1977) and point defects.
Whereas the flow of heat may not be the rate-determining factor for the growth of an individual crystal (as it is faster than both diffusion of matter and the rearrangement of species at the interface), this is not for the overall rate of crystallization of a body of magma. The latter depends directly on the on the rate of removal of heat, unless this rate is too fast and nucleation is inhibited. In large bodies of magma, individual crystals may grow rapidly but growth of crystals is probably intermittent.
At very large undercooling, nucleation may not occur and a liquid can be quenched to a glass or an amorphous solid. If the interface kinetics permit it, crystallization may occur without diffusion even in complex systems giving rise to stable or metastable phases with the same composition as the melt, so called partitionless crystallization (JW Cahn 1967). Partitionless crystallization has been considered unimportant, because of the complexity of the interface mechanism. It should be easier in less polymerized minerals, such as olivine or pyroxene, than in feldspar. In general, the crystals that grow differ in composition from the melt and from the equilibrium composition at a given ∆T-.
As crystal growth is a dynamic process that may occur far from equilibrium, growth of a given crystal may not occur regularly, but irregularly or periodically due to coupling of interface kinetics and diffusion of chemical species and heat. This aspect is strongly related to compositional zoning in feldspars. As diffusion is much more difficult in a feldspar crystal than in a melt, compositional gradients should be much more important in the crystals, especially if Al and Si are involved.
The rate laws for crystal growth are relatively complex (Tiller 1977, Kirkpatrick 1981, Lasaga 1982, Baronnet 1984) and depend on a balance between the rates of attachment and detachment. The rate of growth is negative above the liquidus temperature, zero at this temperature, and increase rapidly with undercooling, reaches a maximum, and falls again to zero at very large undercoolings.
Growth mechanisms may be divided into two extreme types, continuous and layer spreading. In continuous growth the crystal boundary is considered to be rough and atoms or groups attach themselves at all sites on the surface. Growth should be relatively fast and occur most readily in materials of simple structure or at large undercoolings. Layer-spreading
11 growth gives rise to smooth surfaces on a molecular scale, except at steps that are the favored sites for attachment. The main mechanisms are growth by screw dislocations or by surface nucleation. Growth by screw dislocations is self-perpetuating as the energetically favored step is preserved. Where dislocations are absent, a growth step disappears each time the layer extends laterally to the edge of the crystal and growth can only start again if surface nucleation occurs. Computer simulating has been used in the study of (Loomis 1982). The growth mechanism can be determined experimentally at low ∆T- where diffusion is not rate-controlling from variation of the growth rate with ∆T- (Kirkpatrick 1975). Certain faces may change from layer-spreading to continuous growth at critical temperature (Baronnet 1984).
2.2 Growth Rate, Morphology and Undercooling
Many of the data on growth of feldspars in melts were obtained by measuring in length of crystals after quench in blocks of glass as
a function of run time at a given temperature; the crystals usually nucleated on the surface of the blocks. Data were also obtained directly in the melt on a microscope heating stage by recording with a motion camera the growth of a seed crystal. In both, growth rates are the slopes of the plots of crystals length versus time. Growth rates are linear with time except where two crystals approach each other. Generally little information is available about the direction of growth.
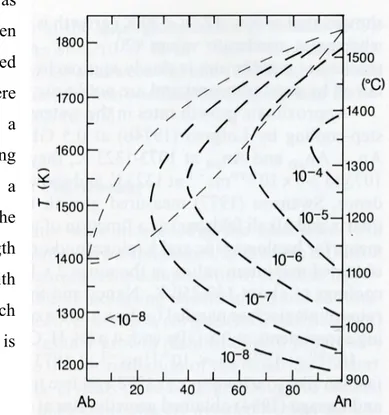
Fig. 2.1 Growth rate (ms-1) of plagioclase as a function of melt composition and temperature constructed from data sources in Fig. 2.1. Light dashes lines give liquidus and solidus in dry Ab-An system
Data for plagioclase growth from dry melts in the system Ab-An (Fig. 2.1) were obtained for An100 by Klein and Uhlmann (1974) at undercoolings of ~50-650 K using quenched-glass
method and by at undercoolings from 14-200 K using a microscope heating stage, for melts An75 and An50 using the same two methods and for An20 using the quench method alone
Kirkpatrick et al., (1979). (Fig. 2.1)
The rapid changes of growth rates with undercooling are associated with large changes in growth mechanism and morphologies, and where diffusion in the melt is necessary to large changes in the composition of crystals. Layer-spreading growth becomes unstable at increasing undercooling and continuous growth starts: this is most effective on edges, corners (skeletal or hopper) and protuberances giving rise to cellular growth (dendritic) with progressive decrease in diameter and increase in misorientation of the dendrites (fibers). In order to study morphology, the crystals must be large enough to be seen under the microscope; abundant nucleation sites are avoided by first melting the charges to a certain ∆T+ and then cooling to the desired temperature below the liquidus (Fenn 1972, Swanson et al. 1977), either in one or several steps or continuously.
Lofgren (1974a) systematically studied plagioclase morphology in the system Ab-An-H2O
at 0.5 GPa between 1473 and 773 K, using composition between An0 and An60.
Approximately 10 wt% H2O was added to the charges. They were first melted at ∆T+ of
20-200 K for 6-50 h, cooled rapidly in 4-7 min to ∆T- of 5-430 K, held for 1-8 days, and then quenched. For a given melt composition crystal morphology changed gradually from tabular to spherulitic with increasing undercooling, with skeletal or dendritic intermediate stages for compositions >10 wt% An. (Fig. 2.2) Tabular {010} crystals were obtained for ∆T- <100-150 K. Crystals are homogeneous with few glass inclusions. Acicular or skeletal crystals were obtained for ∆T- between 100 and 200 K. Crystals are generally reversed zoned (both at external and internal faces) and contain many imperfections and glass inclusions. Dendritic crystals are dominant in the range of ∆T- of 150-250 K and vary from cluster of parallel crystals to tree-like or box-like dendritic forms. Spherulitic crystals were obtained at ∆T- >250 K, the diameter of the fibers decreasing from 20 to 1 µm as the undercooling and also An decrease. Spherulitic generally occur at subsolidus temperatures (Lofgren 1971). In certain runs spherulitic grew on pre-existing crystals during the quench. Similar forms were observed by Swanson (1977).
13 In several runs the temperature was dropped stepwise (Lofrgren 1974 a,b). When the temperature drops were small (50 K), successive zones were produced of tabular form; larger drops of 100 K produced acicular projections, whereas a drop of 250 K gave dendritic projections (see also Naney and Swanson 1980). Under conditions of continuous cooling (10-130 Kh-1) of water-undersaturated melts of An40 compositions, plagioclase morphology
changed from tabular (<10 Kh-1) through elongated (16 Kh-1) to curved incipiently branching (32 or 66 Kh-1) and to complex branching crystals (130 Kh-1) (Lofrgren and Donaldson 1975)(Fig.2.3.); they also discussed the development of comb layering by constrained growth (heat extraction through the walls). At slow cooling rates (2 Kh-1) skeletal crystals formed at first fill in to become tabular (Lofgren 1980, Fig. 2.2)
2.2.1 Effects of Undercooling on the Chemical Composition
In the previous sections the effect of undercooling on the growth rate and morphology was described; the effect in the chemical composition of the crystals growing from a melt of fixed composition is discussed in this section. Plagioclase is particularly suitable for study of variation in the distribution of the major components, Ab and An, as small changes can be detected optically by variation in the extinction angle of refractive indices. Variation in Or and in minor elements such as Fe, Mg, Ba etc. can only be detected by microprobe methods.
When a crystal grows from a melt of different composition, interdiffusion of components in the melt is necessary for growth to continue. Components incorporated in the crystal must
diffuse towards the interface and rejected components away from the interface; a local compositional (and density) gradient will thus be set up in the melt outwards from the crystal/melt interface. At the same time latent heat will be liberated, but since growth rates of feldspars are slow compared to metals (latent heat thus being liberated more slowly) and heat flow fast compared with chemical diffusion, the crystal/melt interface in unconstrained growth has essentially the same or only a slightly higher temperature than the bulk liquid (Klein and Uhlmann 1974), i.e. crystallization is isothermal or nearly so. Many treatments of the initial and subsequent stages of isothermal crystallization at a given undercooling assume either that initial crystal composition is on the solidus or that local equilibrium applies at the interface. The first is not true and the second may or may not be, depending on the growth rate and growth mechanism. It is generally not possible to predict the exact composition of the initial crystal and, furthermore, growth requires a certain undercooling at the interface (Tiller 1977, Kirkpatrick 1981, Tsuchiyama 1985b), which depends on the growth rate and mechanism.
In the simplest growth-rate model, the pure melt-transport controlled growth model, the only limiting factor on growth rate is transport within the melt. The melt composition at the interface reaches the equilibrium value for the imposed undercooling. Such a model cannot account for the existence of crystal faces (JW Cahn 1967). In the pure interface-controlled growth, processes at the interface are not infinitely fast compared with diffusion, so that the growth rate will be lower than that allowed by transport, it will be limited by both and the interface melt composition will not reach the equilibrium value.
15 F ig . 2 .3 O pt ic al m ic ro gr ap hs o f pl ag io cl as e cr ys ta ll iz ed is ot he rm al ly f ro m m el t c om po si ti on A n50 Ab 50 a t i nc re as in g un de rc oo li ng ( a 50 K , b 1 00 K , c 2 00 K , d 3 00 K ). (F ro m L of rg en 1 97 4a ).
2.2.2 Disequilibrium Crystallization
The possible range of initial solid compositions that may crystallize from a given undercooled bulk liquid L0 was discussed by Tiller (1977) and Tsuchiyama (1985b). Fig. 2.4a
represents the dry binary Ab-An diagram at low pressure and Fig. 2.4b a purely schematic free-energy representation at a given undercooling ∆T-. All possible solid compositions are limited by the points of intersection of the tangent to the free-energy curve for the liquid, Gl,
at the bulk composition L0, with the
free-energy curve for the solid, Gs. All points on
the Gs curve between the two intersections
S1 and S4 are possible initial solid
composition as they represents a reduction by ∆G in the free energy, relatively to the same components in the liquid. The composition SM occurring with the
maximum change in free energy is the one for which the tangent to GS is parallel to the
tangent to the GL curve at the initial
composition L0; the equilibrium
composition LE and SE are given by the
common tangent to GL and GS. For a bulk
liquid of composition LE the undercooling
is nil and the only solid, which could crystallize from it, is the solid SE and that
only in infinitesimal amount and at a zero rate as the driving force is zero. As the undercooling increases, the range of possible compositions increases (Fig. 2.4).
Following Baker and JW Cahn (1971) we can divide the range into three regions, in terms of chemical potential changes on crystallization, by drawing tangents to Gs
from € µAb L0 and € µAn L0
at S2 and S3 respectively.
Fig. 2.4 a Range of possible plagioclase composition (schematic) which can crystallize from a melt, L0, as a function of undercooling
€ C1 _ ⇔ I1 _ transformation neglected. b Corresponding schematic free-energy diagram (see text). GS does not extend continuously at this
T towards Ab as plagioclase cannot be
17 In region I (between S2 and S3) the chemical potential of Ab, the “solvent”, increases, and that
of An, the “solute”, decreases, so-called trapping; in region III (between S3 and S4) the
chemical potential of An increases, so-called solute trapping.
The distribution of a component between the melt and crystal phases depends on the stage of growth and the growth rate law (Tiller 1977). If the component is a minor or trace component or its variation in concentration as growth proceeds is small (e.g. Or in basic plagioclase), we may use a simple partition coefficient. On nucleation and early growth the melt has the initial bulk composition, CL (in moles per unit volume), and the crystal composition, CS, will be determined by the effective distribution coefficient, k, (not the equilibrium coefficient, k0, Albarede and Bottinga 1972), so that CS=kCL. If the component is a major component such as An and Ab in plagioclase, we must use an exchange coefficient,
€
DK
=
C
AnS€
Ab LC
An LC
€
Ab SC
(Lasaga 1982) where C is the concentration in moles per unit volume of the components in the solid (S) or liquid (L) phases. For the plagioclase but not the alkali feldspars, where the molar volumes are almost independent of Ab content, one may make use of mole fractions (X) so that€
An S
X
≅K
DX
AnL[
1−(
K
D− 1)
]
X
AnL . The crystal will have the same composition as the liquid (partionless crystallization) and if€ D
K
=K
D0 where € D 0K
is the equilibrium coefficient, the crystal will have the composition given by the approximate mole-fraction exchange equation. Kd will vary with the stage of growth andapproach
€
D 0
K
as the liquid approaches LE. (Fig. 2.4).If solvent trapping occurs, the composition of the initial crystal formed S0 may lie inside
the binary loop (Fig. 2.4) and with growth the crystallizing composition may move towards, but not reach, the equilibrium composition SE, unless the growth rate is determined solely by
diffusion (melt-transport controlled growth). Composition profiles will develop within the growing crystal and the liquid and the composition of the solid SI at the interface will lie
somewhere between that of S0 and SE, and that of the liquid LI between L0 and LE
(interface-controlled growth). As diffusion in plagioclase is very much slower than in the melt, perhaps by a factor of ~104 to 106 times (Tsuchiyama 1985b), diffusion may be considered to occur only in the melt. Temperature may be considered to be nearly constant throughout (Klein and Uhlmann 1974, Loomis 1981, 1982). A boundary layer or depleted zone extends out a certain distance, ∂, from the interface towards the bulk liquid composition, L0 (Fig. 2.4), and its
thickness depends inversely on the easy of diffusion at constant growth rate, ∂ decreasing as T decrease. Boundary layers are usually on the scale of tens of micrometers around feldspars (Lofgren 1974b, Loomis 1981, 1982). The boundary layer thickness is given by
€
where
€
˜
D is the interdiffusion coefficient and
€
υ is the growth rate. For growth of intermediate plagioclase from a liquid in the system Di-An-Ab, the calculated thickness at 1473 K is ~10 µm m2s-1 (Tsuchiyama 1985c) and
€
υ ~10-7 ms-1. The undercooling, ∆T-1, increases away from the interface through the boundary layer. The effective undercooling at the interface,
€
ΔTI −, is
the driving force for atomic rearrangement at the interface and
€
ΔTD
−
= ΔT−− ΔTI
− is the driving
force for diffusion through the boundary layer towards the interface (Fig. 2.4 see Tiller 1977). In diffusion-controlled growth
€
ΔTI− is zero.
Solvent trapping (i.e. trapping of the lower melting component, albite) should lead to reversely zoned crystals. Solute trapping (i.e. trapping of the higher melting component, anorthite) should give initial composition
€
S0' lying outside the binary loop and normal zoning
should occur (Fig. 2.4).
The effect of the boundary layer on morphology may be quite large. At low undercoolings growth of planar faces generally occurs, whereas at very high undercoolings, where the boundary layer is narrow, planar growth may be unstable and continuous growth may occur; any instability which arises may become enhanced and grow outwards into the depleted zone giving dendritic or spherulitic morphology. Kouchi et al. (1985) showed that stirring greatly reduced the thickness of the boundary layer and that, as a result, only acicular crystals developed independently of
€
ΔT−. They suggested that at a given
€
ΔT−, flow reduced the
compositional difference between LI and SI, and hence also
€
ΔCD= LI − L0 and increased
€
ΔCI = LE − LI. Thus, interface kinetics become more important.
Plagioclase. The only experiments involving the compositions of crystals grown from dry
binary melts are those of Tsuchiyama and Takahashi (1983) who crystallized homogeneous melts of composition An90, An80, An70 and An60 at 50 K below their expected solidus for
40-80 h. The quenched charges consisted of tabular crystals showing chemical zoning and interstitial glass of very Ab-rich composition. The average core compositions from electron microprobe analysis were more calcic (An91.5, An83.4, An75.8 and An66.0) than the starting
materials, clearly indicating that crystallization was far from being partitionless. For bulk compositions An10 to An40, Muncil and Lasaga (1987) found no gradients in crystals or
quenched glass for low
€
ΔT− (~12 K). At larger values of
€
ΔT− (25 K) crystals were unzoned whereas the glass was zoned. Compositions at the glass/crystal interfaces were close to the equilibrium ones.
19 All other experiments on the plagioclases in the binary system were performed under hydrothermal conditions, thus involving possible concentrations of H2O at the crystal/liquid
interface (Loomis 1981, 1982). Slight differences in compositions between runs at given temperature may be due in part to different degrees of water saturation which have a strong effect on the liquidus and solidus temperature.
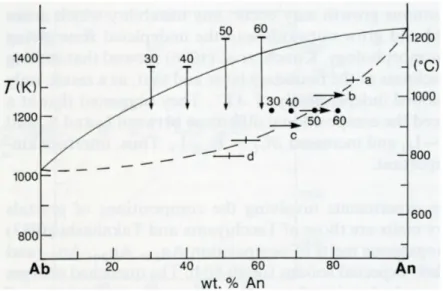
Lofgren (1974a) determined the composition in isothermal experiments on early crystals formed from bulk liquid composition An30-An60 in the system Ab-An-H2O at 0.5 GPa at
different degrees of undercooling. These are plotted on the An-Ab-H2O diagram at 0.5 GPa in
Fig. 2.5-2.6. Whereas the liquidus is well determined, the solidus of Yoder et al. (1957) was only based on two points; Johannes (1978) showed that it probably lies further to the right, thought he did not reversibly determine it. All of Lofgren’s compositions except one plot outside the position for the solidus given by Yoder et al. (1957). For bulk composition An50 at
undercoolings of approximately 50, 100, 150, 200, 250 and 300 K, all composition lie very Fig. 2.5. Compositions of plagioclase
crystallized isothermally at different undercooling from melts of composition An50 (bars) and An30, An40, An50 and An60 (dots, vertical arrows give initial and final temperatures). Letters apply to photographs in Fig. 2.4 and horizontal arrows show directions of zoning. Data from Lofgren (1974)
Fig. 2.6. Compositions of
plagioclase crystallized in
stepcooling experiments from
melts of compositions An50 (dots and bars joined by dashed lines), An60 (squared) and An30 (circles) and of glass after quench. Data from Lofgren (1974b) and RK Smith and Lofgren (1983).
close to Johannes’ supposed solidus, but are reversely zoned. The reverse zoning is stronger at intermediate degrees of undercooling. At an undercooling of 300 K the crystals are spherulitic and have the same composition as the bulk liquid. The crystal composition obtained at a constant temperature of 1223 K for four bulk compositions (An30, An40, An50 and An60) are
not identical but become systematically richer in An (63, 68, 74 and 81 wt% An all ±4) as the bulk
€
ΔT− increases. The crystals are slightly reversed zoned. If total equilibrium applied at
the interface, all four bulk compositions should give the same solid compositions. The differenced in composition cannot be explained by local equilibrium or by differences in H2O
content of total pressure. The bulk undercooling appears to play a role as the morphology changes from tabular to dendritic.
Lofgren (1974b) carried out step-cooling experiments in which the temperature was lowered in steps of 50 K and the compositions of successive zones obtained were measured by electron microprobe. The crystal obtained for An50 with ~ 10 wt% H2O (run 68) is shown
in Fig 2.6. Successive growth zones are sharply delimited without change of morphology (except for differences due to variable growth rates on the two faces), and all shown reverse chemical zoning. All similar experiments shows unambiguous results indicate reverse zoning (see RK Smith and Lofgren 1983, Fig). Lofgren (1974b) explained the reverse zoning being due to a change in composition of the liquid at the interface from the bulk composition towards the equilibrium composition, LE, leading to a reduction in undercooling and hence in
the growth rate. At a slower growth rate, the partition coefficient would increase towards
€
KD0
and the composition of the growing layers approach more closely the equilibrium composition, SE. Naney and Swanson (1980) described on step-cooling experiments with a synthetic granodiorite composition with 4% H2O at 0.8 GPa and 50 K intervals from 1323 K.
Five plagioclase growth zone were observed, each successive zone being poorer in An and slightly richer in Or, but chemical zoning was apparently absent within each zone.
In both isothermal and step-cooling experiments at 1223 K, different starting compositions give different plagioclase compositions, so that local equilibrium does not apply at the interface. As the possible range of solid composition increases with undercooling (Fig. 2.6) the range of compositions and the difference between the observed ant the “equilibrium” crystal compositions should both increase with undercooling, all other factors being supposed constant. As this is not so, other factor such as growth rate, magma viscosity, etc. must play a role in determining the bulk KD.
21
2.3 Melting and Dissolution
If one-component crystal melts to give a liquid of the same composition, it coexists in equilibrium with the liquid at a definite temperature at fixed pressure known as the melting point, Tm. At Tm the growth rate is zero and above it, the growth rate of one super-heated
crystal is negative. Most one-component crystals cannot be heated much above Tm (only to an
extent which depends on the interface detachment kinetics) and thus the free energy curve GS
versus T ceases to exist slightly above Tm. Such crystals also shown premonitory or
premelting effectsat temperatures just below Tm. Of the common feldspars only anorthite has
such melting behavior, whereas KAlSi3O8 transform incongruently to leucite plus a more
siliceous melt. The melting of albite may be slightly incongruent with a maximum temperature displaced slightly towards nepheline, hence explaining part of the apparent range of superheating (Navrotsky et al. 1982). All other common feldspars melt incongruently. If feldspar melts to give feldspar of a different composition plus a melt, the feldspar is only metastable above the melting temperature (rather than unstable as for a one-component phase), so that its free energy curve continues above this temperature.
Except for congruent melting, rates of melting depend on: (1) interface detachment kinetics, (2) diffusion in the crystal and (3) transport in the melt boundary layer (diffusion and convection). The term melting is used for both congruent and incongruent transformation of feldspars in the absence of other components and dissolution when the melt has components other than feldspar ones. Both congruent and incongruent meting requires nucleation of the melt phase, whereas in dissolution a melt or a fluid phase is already present. The less feldspar can be superheated, the easier is melt nucleation. Until recently all experiments involving melting or dissolution were designed to determine phase relations; phase compositions were explored only in compositional and not in real space.
2.3.1 Melting of Plagioclase
Data are lacking on the mechanism, kinetics and spatial distribution of melting in end-member feldspars. Tsuchiyama and Takahashi (1983) melted a labradorite (An60.2 Ab38.0 Or1.8)
from Chihuahua, Mexico. Parallelepipeds a few millimeters long with edges parallel to a*, b and c were cut from a clear homogeneous crystal (only a few Albite twins were present), sealed in Pt capsules to prevent volatilization of sodium, and heated to 1571-1645 K (the temperatures of the solidus and liquidus being about 1593 and 1643 K respectively) for 1 min and 1 week, and quenched in water. The times required to reach 1273 K and the run
temperature were about 20 s and 4 min. respectively so that the early stages are hard to study. Thin sections were prepared [usually parallel to (100)] and studied optically and by electron microprobe; care being taken to avoid Na-volatilization from the quenched melts. Apart from those from very short runs, all melts were very homogeneous. The residual solids are strongly zoned and it was very hard to obtain precise compositions. The average compositions of the solid were determined using revised ∆131 curve obtained from crystals grown below the solidus, whose compositions were measured by electron microprobe.
Melting began at the surface and/or interior of the crystal by heterogeneous nucleation at defects (cracks and possibly dislocations) and developed a dendritic morphology with an arm spacing of few micrometers, which did not change as the proportion of melt increased (Fig. 2.7 a,b). Melting is crystallographically controlled (Fig. 2.8), and the extent depends on the temperature and time. Partial melting absent only in runs up to 1632 K of ≤ 2 min (Fig. 2.9). In runs of 5-6 min partially melting occurred with a little change of plagioclase composition Fig. 2.7 a, b. Photomicrographs (reflected light) of
surface of melted plagioclase at 1724 K, a for 5 min, b for 1440 min. Width of photos 0.16. (from Tsuchyiama and Takahashi 1983.
23 up to 1660 K and more pronounced change up to 1724 K. The plagioclase is first partially, then fully covered by melt before melt segregation occurs. Even at very beginning of melting, the melt has the equilibrium composition, whereas the solid composition changes at first only at the melt interface and then finally throughout the volume and reaches the equilibrium composition after 50 to 1000 h; the structural state of plagioclase changes very rapidly (~ 10 min) to a high state. Tsuchiyama and Takahashi (1983) concluded that melt enlargement is controlled by diffusion in the crystal; they estimated interdiffusion coefficients in plagioclase. The textures obtained closely resemble sieve textures observed in natural plagioclase from andesite and other rocks.
Melting of plagioclase/diopside pairs was studied by Tsuchiyama (1985c) for Chihuahua labradorite and synthetic diopside crystals. Polished parallelepipeds were placed in contact with plagioclase above, held together with Pt wire and placed in a Pt capsule. For a molar ratio of plagioclase to diopside near 2, the solidus temperature is about 1483 K and diopside and plagioclase should disappear at 1508 and 1668 K (liquidus) respectively (Weill et al. 1980). The pairs were heated in a vertical furnace at 1463 to 1580 K for 1.5-192 h and then quenched in air. Melting occurred mainly at the plagioclase-diopside contact and a reaction
Fig. 2.8 a, b. Photomicrographs of thin sections of
partially melted plagioclase. a 5 min at 1962 K showing fine dendritic melt to the left and platy melt parallel to b to the right. Width of photo 0.28 mm. b 6 min at 1658 K. Width of photo 0.33 (from Tsuchiyama and Takahashi 1983)
zone due to partial melting composed of a fine mixture of calcic plagioclase and melt develop only from the surface of the plagioclase crystal inwards. The diopside/melt interface was smooth. With increasing temperature and time, melt first leaked out from the contact to cover the side faces then increased until diopside disappeared.
Restricted melting (only few percent) occurs below ~ 1515 K due to the slowness of Al/Si diffusion in plagioclase. Above this distinctive (or “critical”) temperature the degree of melting increased rapidly with time at a given (Tsuchiyama and Takahashi 1983); however, an equilibrium degree of melting was not reached. The distinctive temperature corresponds to that at which the line joining the compositions of plagioclase and diopside cuts the cotectic line. Above this temperature the system act as a pseudobinary and disequilibrium melting occurs without change of composition of the plagioclase. Melts are zoned and compositions are strung out along the mixing line (Fig. 2.9), and melting is controlled by transport in the boundary melt. Below this distinctive temperature melt compositions are cotectic and the melting of plagioclase is controlled by transport in boundary melt. Below the distinctive temperature melt compositions are cotectic and the melting of plagioclase is incongruent and rate-controlled by detachment kinetics and diffusion in the plagioclase crystal.
Fig. 2.9 Time-temperature diagram showing partial melting texture of plagioclase. Large
25
2.4 Dissolution in Silicate Melts
In dissolution by a melt or fluid phase, nucleation is not needed. Depending on the experimental procedure, hydrothermal experiments may involve melting or dissolution. Data are available on the dissolution of solid minerals in simple synthetic silicate melts (plagioclase – Tsuchiyama 1985a, various minerals – Kuo and Kirkpatrick 1985) or in rock melts (plagioclase – Lofgren and Norris 1981, plagioclase, olivine, quartz – Donaldson 1985, olivine – Thornber and Huebner 1985), and of quartz and molten feldspar (K-feldspar and oligoclase) in molten basalts (Watson 1982). Tsuchiyama (1985a) reviewed melting and dissolution kinetics and applied them to residence times of xenoliths in magmas.
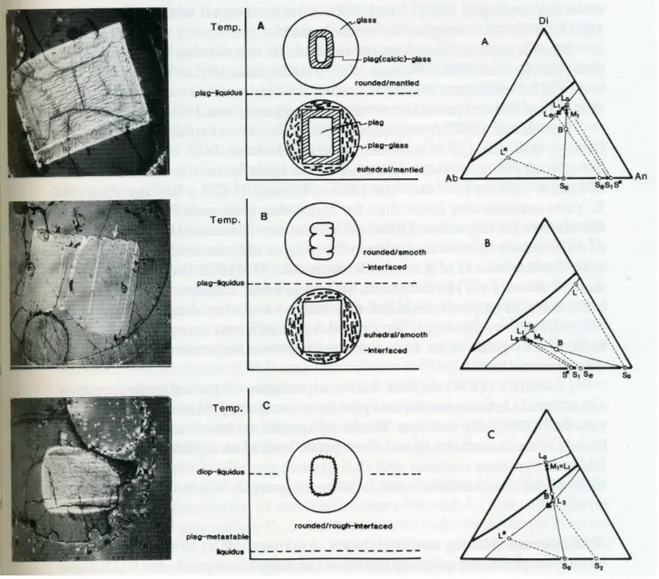
Tsuchiyama (1985a) studied the chemistry and texture of dissolution of plagioclase (An95.9, An59.4, An22.2 and An20.8, Or increasing from 0.3 to 4.1%) in melts in the system
Di-An-Ab, five in the plagioclase field and one in the diopside field. Plagioclase crystal were surrounded by glass and heated to 1473-1683 K for 0.5 to 88 h. At temperatures below the liquidi, plagioclase crystals retained their original shape, whereas above the liquidi crystals became smaller and rounded, their exact behavior depending on the relationship between their composition, S0, and that of plagioclase S* in equilibrium with liquid L0 at given T.
(1) If S0<S*, i.e. the crystal is less An-rich than the equilibrium composition whatever
the T, the interface becomes rough and complicated, sieve-like structures developing on the scale of a few micrometers with the formation of a mantled plagioclase (Fig. 2.10). This behavior, called partial dissolution, is similar to partial incongruent melting (Tsuchiyama and Takahashi 1983) as the low-melting Ab component dissolves preferentially (i.e. reacts) leaving a more An-rich mantled, the plagioclase keeping its original shape it T is below the liquidus and becoming smaller if above; the fraction of melt increases.
(2) If S0>S*, i.e. the crystal is more An-rich than the equilibrium composition; it is
unaffected at T below the liquidus and dissolves with a smooth rounded interface at T above the liquidus (Fig.). This behavior is called dissolution, and, if sufficient time were available for diffusion, the composition of the rim of the remaining crystal would change towards S* and the liquid would become richer in An, the crystal becoming encapsulated by Ab-rich feldspar or even by a more Ab-rich feldspar.
(3) If no feldspar is in equilibrium with the melt (which is in the diopside field), it will dissolve congruently until the liquid reaches the plagioclase liquidus (L2). This liquid would
be in equilibrium with a more An-rich plagioclase S2 so that S0<S2 (case 1) and the
In the above experiments dissolution rates were time-dependent and depend on diffusion, probably in the crystal. The mantled plagioclase resembles those found in andesites in which sodic plagioclases (but not calcic ones) are surrounded by dusty or sieve textures of more basic plagioclase.
Drake (1976) showed that plagioclase crystals more basic than the supposed equilibrium composition reacted with synthetic basalts to rhyolite melts at undercoolings of 10-50 K to give a rim of the supposed equilibrium composition. Lofgren and Norris (1981) dissolved natural plagioclase in a DSDP Leg 45 olivine-basalt melt between 1448 and 1498 K for 2 to 8 days and obtained sieve textures for plagioclase An55 and An24 but not for more basic ones.
Fig. 2.10 A-C. Summary of textures, and corresponding photomicrographs (width 2.8 mm), produced by
reaction between plagioclase, S0, and melt, L0 plotted in the Di-Ab-An diagram (thick line – boundary curve, thin lines – isotherms. S* is plagioclase in equilibrium with L0. A Partial dissolution (S0 less calcic than S*). B Overgrowth (S0 more calcic than S*) C Simple dissolution and partial dissolution (L0 in diopside field). (From Tsuchiyama 1985a)
27 On cooling at 2Kh-1 to 1273 K after isothermal treatment at 1458 or 1473 K, euhedral overgrowth was obtained.
Most crystal of rock-forming mineral do not develop facets on dissolution (Watson 1982, Tsuchiyama 1985a, Kuo and Kirkpatrick 1985) but rather become or remain rounded. Faceted dissolution is more probable when superheating is small (Donaldson 1985a).
Donaldson (1985a) measured dissolution rates of spheres of plagioclase (An52.5 and An29.0)
in tholeiitic basalt melt at 1423 to 1573 K. Rates are not direction or time-dependent. For labradorite the rate varies from 213 µm h-1 (5.9 x 10⁻⁸ ms-1) at the 1573 to 86 mm h-1 (2.4 x 10⁻⁸ ms-1) at 1483 K, rates considerably faster than for magnesian olivine and quartz but about the same as for oligoclase. Dissolution rates are determined by a combination of diffusion and convection rates in the magma near the interface. This agrees with the conclusions of Kuo and Kirkpatrick (1985) that the dissolution rates depend directly on the difference in composition between the interface and bulk melts (transport–controlled dissolution) and that dissolution rates are only affected by stirring if the crystal has a different composition from the melt. For diopside in its own melt, melting rates are controlled by interface detachment kinetics.
2.5 Melt and Fluid Inclusions
During growth from a melt, feldspars vary in the speed of growth in certain directions or sites so that skeletal forms may develop at a moderate undercooling. These may become completely filled in during further growth (this will show in zoning patterns) or only incompletely so (Lofgren 1980), so that melt inclusions may results. On the other hand other phases may nucleate on the growing face giving rise to solid or fluid (vapor) inclusions. Melt and fluid inclusions are briefly discussed here but solid inclusions arising by crystallization from melt inclusions are not.
Spherical, tubular or angular inclusions and “voids” occur in natural feldspar, but care must be taken to distinguish primary inclusions from secondary ones and from microcracks produced in various ways (Montgomery and Brace 1975). Montgomery and Brace (1975) showed that feldspars from “dry” environments (basic igneous rocks, dry granites and metamorphic rocks) have fewer pores than those from “wet” granites and pegmatites. Considering that feldspars suffer widespread deuteric and hydrothermal alteration (Parson 1978), many of these may well be secondary.
Tiller (1977) discussed the conditions for the formations of “bubbles” of second phase at a growing interface. Such “bubbles” form regular or irregular arrays and they may migrate during growth. They may arise by periodic saturation of the melt in H2O at the grown front.
Gutmann (1974) described tabular “voids” in transparent labradorite magacrysts from Sonora, Mexico which range in diameter from 0.1-2 mm and may be up to 10 mm or more long. They often occur in parallel families nearly perpendicular to a crystal face, generally (010) or (001). They may pinch and swell. Gutmann suggested that they arose through nucleation of fluid on the growing interface and they subsequently leaked. Only those tubes open the crystal margin may contain films of basaltic glass. The crystals are remarkably homogeneous, but may show very weak oscillatory zoning, which is truncated by empty tubes or may wrap down into the tube, if it contains glass.
Melt inclusions form a very high proportion of the volume of skeletal plagioclase crystals (Kuo and Kirkpatrick 1982b); the form and distribution of the inclusions are crystallographically controlled. Other plagioclases have a sieve-like texture on a coarse scale and up to one third of the volume may be occupied by glass (Gutmann 1977). This texture is quite different in scale from the very fine-scale sieve texture produced by partial melting (Tsuchiyama and Takahashi 1983) or partial dissolution (Tsuchiyama 1985a) and found in certain andesitic plagioclase.(Grove 1982)
2.6 Considerations on Growth and Dissolution in Magmatic Rocks
Because of the much longer time scale and grater physical extension of magmatic environments, laboratory experiments cannot duplicate all the crystallization processes. This is especially so for growth at very small undercoolings and for dynamic aspects of crystallization. The first is apparently less serious, as growth at smaller undercoolings represents a nearer approach to equilibrium and could be modeled by extrapolation, unless complex interactions leading to oscillatory zoning occur. The second present s great practical difficulties and only comparative studies on water-salt systems have so far been carried out. Both detailed study of magmatic rocks and careful laboratory experiments are essential, however. Until recently, progress in our understanding of rocks was hindered by the absence of well planned experiments on nucleation, growth rates and mechanisms and dissolution, from both chemical and spatial viewpoints. Recent experimental results not, however, be applied indiscriminately to the interpretation of magmatic rocks, as most of the experiments were performed under conditions which may be far from those in nature: large initial
29 superheating, large undercoolings, large temperature gradients in the capsules, strong surface effects either of the melt or the capsule, very small sample volume etc.
Most basic magmas originate in feldspar-free regions of the mantle and rise by poorly understood processes. They may transport (1) partly resorbed xenoliths or xenocrysts from the mantle or crust and (2) crystals, groups of crystals or rock fragments which have crystallized from the magma or earlier magmas during uprise. Most magmas had little or no superheat on emplacement. Little is known about nucleation of feldspars in most rocks or weather nucleation is homogeneous or heterogeneous though the latter is more probable. That heterogeneous nucleation is common (but not ubiquitous) in laboratory experiments does not necessarily mean that this is so in magmatic rocks. Many magmatic rocks contain isolated feldspars, others contain glomerocrysts (consisting of crystals of feldspar and other minerals in intimate contact), whereas plagioclase cumulates appear to be a three-dimensional assembly of touching feldspar crystals.
Particular care must be taken in the interpretation of all such textures and structures. The general relationship between morphology and inferred cooling rates applies to lunar and terrestrial rocks. Most igneous rocks contain tabular plagioclase; skeletal swallow-tailed plagioclase is common in rapidly cooled basalts, in impact melts and in pseudotachylites. Dendritic plagioclase and comb layering occur in some intrusions or at their margins.
The dominant control of crystallization is the overall cooling rate, which depends on the depth of emplacement, the size of the magma body, the magma composition and the nature and temperature of country rocks. Magma dynamics depend on all the above factors, as well as on the viscosity, which in its turn depends on the water content. Intruded magmas cool from the roof and walls, so from a naïve point of view, crystallizzation shoulg occur most readily by heterogeneous nucleation and constrained growth downward and inward as in lava lakes (e.g. Kirkpatrick 1977, 1981) and comb-layering.
2.7 Chemical Zoning
2.7.1 General considerations
Chemical zoning occurs in nearly all minerals of variable chemical composition. Its origin lies in part in the failure of diffusion inside a growing crystal to keep up with changing chemical and physical conditions outside the crystal. The main physical parameters are P and T. PH2O is not an indipendent variable. If zoning were exclusively controlled by external
addition to the above broad zoning, some minerals show growth-controlled zoning which is very fine in scale and may vary in different growth sectors.
2.7.2 Preservation of Zoning
For zoning to be preserved, cooling must be sufficientl rapid to prevent diffusion after growth from levelling out chemical differences in the crystal (Muncil and Lasaga 1987) or producing new ones by exsolution. Under isothermal conditions the scale, x, for diffusion is given by Einstein approximation
€
x ≅ ˜ D t, where
€
˜
D is the interdiffusion coefficient and t, time.
Zoning is most easily preserved in minerals of low diffusivity, of which one of the most favorable is plagioclase (
€
˜
D plagioclase < pyroxene < garnet < olivine < alkali feldspar; Tsuchyiama 1985b), and on rapid cooling. Zoning is preserved in alomost all igneous and metamorphic plagioclase, because of very low value of
€
˜
D .
Zoning can be observed easily, from variation of some simple physical property: extinction angle, refractive index, and more recently, differential etching. Plagioclase has been extensively studied because of the very large variation in extinction angle up to 70° with composition and the presence of well developed cleaveges and twin composition planes, which can be used as crystallographic guides. Very small differences in extiction angle corresponding to a few percent An can easily measured in coarse plagioclase zoning; fine growth fronts of micrometer scale can be observed but it is more difficult to determine compositions.
Qualitative variations in chemistry can be easily visualized using an electron microspcope and quantitative analysis can obtained “in-situ” by electron microprobe.
2.7.3 Oscillatory Zoning
One of the most spectacular zoning patterns in crystals consists of fine concentric ehedral zones of contrasting compositions, usually referred to as “oscillatory zoning”. It is common in many igneous as well as hydrothermal minerals (Shore and Fowler 1996). Oscillatory zoning in plagioclase is frequent due to low interdiffusion of Si-Al and easy to observe under optical microscope. It is found in various volcanic rocks ranging in composition from basaltic (Anderson 1984; Kuritani 1998), to andesinic and rhyolitic (Nixon and Pearce 1987; Pearce and Kolisnik 1990; Singer et al. 1995) as well as intrusive rocks (Wiebe 1968; Loomis and Welber 1982; Blundy and Shimizu; 1991.
Zoning in plagioclase is characterized by changes in An-content, with variations generally ranging from 1 to over 30 mol% An. Zoning are generally studied by quantitative profiles
31 with analytical precision ± 1 mol% An at variable spatial point resolution (≤3 µm), obtained by electron microprobe (EMP). Other techniques such as optical microscopy and Nomarsky interference contrast microscope (NDIC) provide high-resolution images of zoning (Anderson 1984; Nixon and Pearce 1987; Pearce et al. 1987; Pearce and Kolisnik 1990; Singer et al. 1995).
Most of the recent studies on this common plagioclase features distinguish irregular or rounded resorption surfaces, often correletad between different crystals (Loomis and Welber 1982), from euhedral oscillatory zoning, which cannot be correlated between crystals. Many author attempt to interpret zoning in plagioclase in terms of processes that occur in magma chamber (see reviews in Pearce 1994; Shore and Fowler 1996).
Major resorption surfaces are generally atributed to profund changes in temperature, pressure, melt composition and water content in the magma at large scale caused, for exemple, by magma recharge (Nixon and Pearce 1987; Davidson and Tepley 1997). Minor resoprtion surfaces are attributed to local effects of minor changes in the same parameters caused by magma dynamics (convection). “Oscillatory zoning” is genarally attributed to local kinetic effects in boundary layer at the crystal/melt interface. Kinetic effects are difficult to constrain and have been theoretically and numerically modeled (Haase et al. 1980; Allegre et al. 1981; Lasaga 1982; Loomis 1982; Ortoleva 1990; L’Heroreux and Fowler 1994, 1996a, 1996b; Wang and Wu 1995). Other interpretations involve the periodic destruction of this boundary layer (Loomis 1982; Anderson 1984).
Despite this abundant literature on the topic, the interpretation of oscillatory zoning remains controversial. One reason is the lack of an unequivocal definition of oscillatory zoning. It appears that each author uses the term in a different sense and there is consensus neither in the shape, nor in the waveleght and amplitude of variation. These problems in defining oscillatory zoning are probably caused by (1) the variability of such zoning patterns in plagioclase and in other minerals, and (2) the analytical difficulty in characterrizing small-scale zoning patterns.
Ginibre et al. 2002 try to clarify these problem studing oscillatory zoning using high-resolution quantitative imaging taken by electron microscope. Authors defined three type of oscillation:
1. LAO: Low Amplitude Oscillations, chacterized by 1-20 µm wave length and 0.5-2 mol % An amplitude;
2. HFA: High Frequency and Amplitude, with 3 µm wavelenght and >10 mol% An amplitude:
3. STR: Saw Tooth pattern with Resorption: 10-20 µm width and 5-10 mol % An amplitude.
A similar classification between small-large scale oscillations was made by Pearce and Kolisnik (1990) in a large range of rock types. They distinguish small-scale oscillations (type I), which they attributed to kinetic effects, from larger oscillations that show resorption (type II) caused by changes in the bulk melt (temperature, composition etc.).
In recent literature on oscillatory zoning, there seems to be a consensus to explain planar “oscillatory” zoning by local kinetic effects (Lofgren 1974, 1980: Kirkpatrick et al. 1979; Muncil and Lasaga 1987, 1988, Cashman 1990). When the system is sufficiently undercooled with a correspondingly high crystal growth rate, element diffusion is too slow to replenish the melt at the interface. A chemical boundary layer then develops, where the supersaturation is lower than in the bulk melt. This influences the composition of the growing crystal. Kinetic models of oscillatory zoning are based on this competition between interface and diffusion kinetics. These models, however, never imply resorption because the melt is always saturated in plagioclase.
Ginibre et al. (2002) interpret STR oscillatory zoning to dynamic processes such as (turbulent) convention, which can include resorption phases, as assumed for the type II oscillations of Pearce and Kolisnik (1990). Whereas, LAO patterns (amplitude <2% An) may be true oscillations caused by kinetic effects.