3. RESULTS
3.1 Chx10Cre expression results in the mosaic inactivation of
Dicer in the mouse retina
Crossing of the two mouse lines Dicer flox
/Dicer flox and Chx10Cre results in a progeny that is viable and fertile (CKO mice; genotype Dicer flox
/Dicer flox ; Chx10Cre). To confirm the genetic functional ablation of Dcr-1 gene in CKO animals, we performed in situ hybridizations (ISH) on retinal sections using a 260nt antisense RNA probe specific for the floxed exon 23 (Harris et al., 2006). The expression of Cre recombinase in the Chx10Cre mouse line does not drive Cre expression in all retinal cells. As reported, the transcription of transgene ranges from 10% to 90% of all retinal progenitors (Rowan and Cepko, 2004). As a result, not all cells in the mature Dicer CKO retinas are supposed to lack a functional Dicer protein.
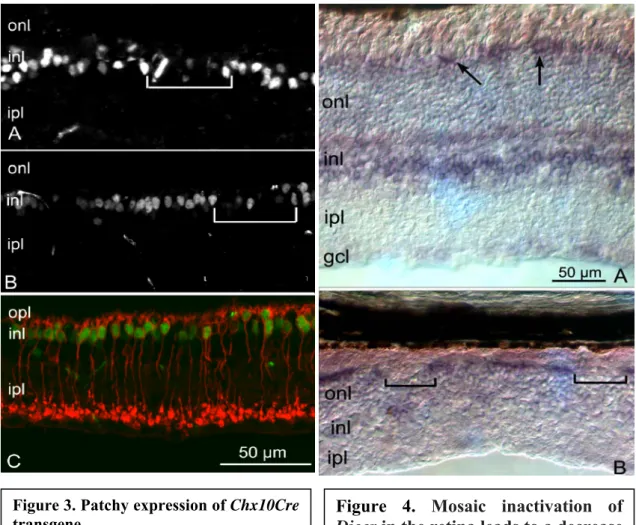
In wild-type retinas, native Dicer was expressed in the vast majority of retinal cells, albeit it is interesting to notice different levels of expression in the various cell types (Fig. 1A). Staining in photoreceptors appears localized in the inner segments. All photoreceptors seem to be equally marked, with the ISH signal forming a continuous line. Many cells of the inner nuclear layer and ganglion cell layer also show intense labelling. Ganglion cells, possibly because of their abundant cytoplasm, appeared stained more strongly than other cell types. Instead, in the CKO retinas (Fig. 1B), Dicer expression was found to be patchy, with groups of labeled cells interdigitated with unlabeled cells into INL. Cells in the ganglion cell layer were negative in some areas and positive in adjacent regions. In addition, the labelling in inner segment of photoreceptors appeared alternating (Fig. 1B, age P16).
Figure 1. Expression of native Dicer transcript in wt and Dicer CKO retinas
In situ hybridization for the exon 23 of the Dicer gene in wild-type (A) and CKO (B) retinas at P16. A, In the wild-type animal, virtually all retinal cell types were labeled. Photoreceptor staining was concentrated within the inner segments (is; arrows) that contain the protein synthetic machinery, whereas the outer nuclear layer (onl), mostly containing their nuclei, was devoid of staining. The cytoplasm of cells of the inner nuclear layer (inl) and ganglion cell layer (gcl) also showed intense Dicer expression. B, In the CKO, expression was more patchy than in the wild type. Most photoreceptors were negative, whereas cells in the gcl were either very intensely or relatively weakly stained (arrows). The inset shows a high magnification of the stained cells in the gcl. Arrows point to the somas of two negative cells adjacent to a larger cell, darkly stained (asterisk), all presumably ganglion cells. ipl, Inner plexiform layer.
To determine whether patchy expression of Dicer in CKO retinas was a reflection of the mosaic expression of the Chx10Cre driver, we examined Cre expression in CKO animals by means of anti-Cre antibodies. As Chx10 gene is expressed in bipolar neurons in the adult retina, it was expected a related expression of Cre recombinase. Additionally, in the transgene used in this study the cre gene is fused to GFP, thus localizing the green fluorescence deriving from the fusion protein into the nucleus (Rowan and Cepko, 2004).
In this way, it was possible to reveal Cre-positive cells using anti-GFP antibodies. The pattern of staining obtained with either Cre or GFP antibodies was identical (data not shown).
In the retinas of CKO and control mice, immunocytochemistry demonstrated labelling of nuclei in the central and upper INL, most likely bipolar cells (Fig. 3).
Cre-positive cells were found to be immunoreactive for markers of rod bipolar (protein kinase C-α, PKCα), ON cone bipolar (inhibitory G-protein α, G0α) and OFF cone bipolar cells (Neurokinin-3 receptor, NK3R). Rarely, Müller glial cell (labelled with anti-glutamine synthase, GS) were shown to contain Cre-GFP. Conversely, co-localization was never observed in the other retinal cell types. The pattern of staining was not uniform but contained patches of Cre-negative cells contiguous to clusters of Cre-positive cells.
Cre-expressing mature retinal bipolar neurons derived from Cre-expressing retinal progenitors, while unlabelled cells derived from retinoblasts that did not express the transgene during development (Rowan and Cepko, 2004). Thus, patchy expression of the transgenic Cre drives mosaic ablation of Dicer in CKO retinas.
The peculiar expression pattern of Dicer in the CKO retinas was also visible in the crossing CKO animals with mice containing the Rosa26R transgene (with a resulting genotype of Chx10Cre; R26R; Dicer flox
/Dicer flox). In the Rosa26R transgene, the gene LacZ, coding for the β-galactosidase, is located upstream to a floxed stop element. In this way, the activity of the recombinase will excide the DNA allowing the expression of the reporter, and this characteristic will be maintained in the entire lineage (Soriano, 1999). Hence, cells that had undergone a recombination event owed to expression of Cre from the Chx10Cre transgene were revealed by β-gal histochemistry on retinal sections. In this case, columns of stained retinal tissue clearly alternated to unstained ones (fig. 2).
Figure 2. Ablation of Dicer revealed by β-gal histochemistry. Crossing the Dicer CKO mouse with the Rosa26r strain renders possible the direct observation of Cre activity upon DNA recombination.
In our case, the hystochemical procedure revealed the mosaic inactivation of Dicer in CKO mice. In this section, stained retinal columns are formed by mutant cells (“ – “), while remaining neurons are presumed to possess functional Dicer activity (“+”).
Figure 3. Patchy expression of Chx10Cre transgene.
A, Immunofluorescence staining with Cre
antibodies in the CKO retina showing patchy expression of the transgene.
B, Patchy expression was also observed in
the wild-type retina. Cre-negative cells (in brackets) alternated with Cre-positive, fluorescent nuclei in the inner nuclear layer at the presumptive location of bipolar cells.
C, Immunostaining for Cre (green) and
PKCα (red) for rod bipolar cells. With few exceptions, rod bipolar cells were Cre positive.
onl, Outer nuclear layer; opl, outer plexiform layer; inl, inner nuclear layer; ipl, inner plexiform layer.
Figure 4. Mosaic inactivation of Dicer in the retina leads to a decrease in retinal-specific miRNAs.
In situ hybridization for a retinal-specific miRNA (miR-183) in wild type (A) and Dicer CKO retinas (B).
The staining in the inner nuclear layer is practically absent in the second. In addition, the labelling in the inner segments of photoreceptors appears alternating, probably reflecting the patchy expression of the Chx10Cre cassette. Both sections derive from 7 months-aged wt and control retinas.
3.2
Mosaic inactivation of Dicer in the retina leads to a decrease
in retinal-specific miRNAs
An indirect, but very important confirmation of Dicer ablation was given by in situ hybridization on retinal specific miRNAs. Theoretically, mature miRNAs are not produced in the absence of an active Dicer protein.
In wild type and control animals, we found miR-182 and miR-183 to be highly expressed in retinal tissue. Expression of miR-183 takes place in photoreceptors and neurons belonging to INL, while miR-182 exhibit an additional expression domain in GCL. As also observed for Dicer transcripts, expression in photoreceptors occurs mainly in inner segments, forming an uninterrupted line of staining. Scrambled probes, taken as control, gave no signal at all (data not shown).
In CKO animals, the signal had a discontinuous pattern in the inner segment of photoreceptors (fig. 3). Moreover, faint or no signal was detectable in INL expression domain of some retinal areas surrounded by patches stained as in the control.
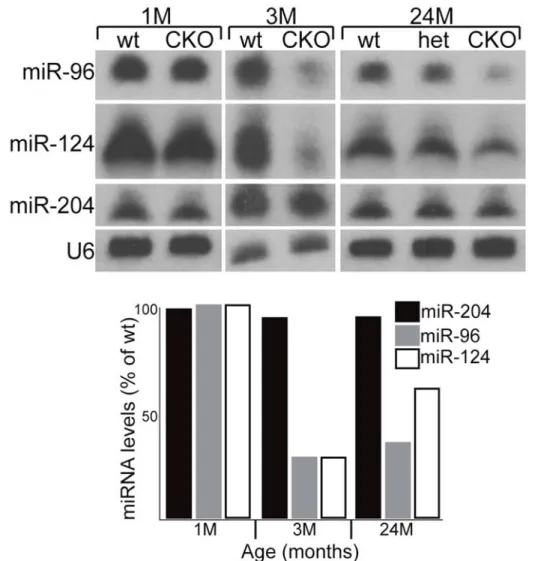
To determine whether partial Dicer inactivation in CKO retinas resulted in aberrant miRNA processing, Northern blots for miRNAs known to be expressed specifically in the retina or elsewhere in the CNS (miR-96, miR-124a, and miR-204) were performed on retinal extract by the collaborators at the University of Florida (fig. 5).
miR-96 and miR-204 are highly expressed in the developing and adult retina, whereas miR-124a is expressed throughout the entire CNS (Ryan et al., 2006; Karali et al., 2007). Experiments were performed on pooled retinas from control and CKO animals. At 1 month of age, the mature form of all three miRNAs examined was unchanged, while at 3 months mature miR-96 and miR-124a were found to be decreased 70% compared to control retinas. At 2 years, mature miR-96 was decreased 63% and miR-124a was decreased 36%.
A decrease in the production of mature miR-96 and miR-124 was found too in heterozygous retinas. In spite of that, at all ages examined, miR-204 levels were unaffected (Fig. 5). miR-204 has been reported to be specifically expressed in a subset of cells in the INL (Deo et al., 2006).
The mosaic nature of Chx10Cre allele used in this study may be the cause of our inability to detect alterations in the expression of this particular miRNA in mutant animals. (Karali et al., 2007; Xu et al., 2007). After removal of Dicer from the retina, cells undergo progressive cell death (see Figs. 9D, 10A). The increase in mature miRNAs found in Dicer null retinas at the 2 year time point compared with 3 months could be explained as a consequence of decrease of Dicer null cells present in the retina at this late stage.
Figure 5. Decrease of retinal-specific microRNAs in Dicer CKO retinas.
Northern blot analysis of mature miRNA levels from retinal homogenates of wildtype (wt), heterozygous (het), and mutant animals. A, Northern blot analysis of equal amounts of RNA obtained from pooled samples of wild-type, mutant, and, at the 24 month time point, heterozygous retinas (see Materials and Methods). The small RNA U6 was used as a loading control.B, Histogram of the relative expression levels for each miRNAexamined on the Northern blot shown in A. At the 24 month time point, miR-96 and miR-124a were decreased 18 and 10%, respectively, in heterozygous retinas. No decrease in miR-204 expression was observed at any time point examined (see Results). Expression levels were normalized to wild type as described in Materials and Methods. M, Month.
3.3
Characterization of cell types in CKO retinas
We first analyzed the gross retinal morphology at P16 with the purpose to obtain information about the possible presence of major defects in retinal development. The temporal point of P16 is screened because at this age synaptogenesis has just concluded. Immunocytochemistry on retinal sections showed that, the general retinal architecture appeared normal. The normal complement of retinal cell types, comprising neurons and glia (Jeon et al., 1998; Haverkamp and Wässle, 2000), was represented in the CKO retinas and exhibited normal features. All cell types analyzed, including rod and cone photoreceptors (Fig. 6A), horizontal cells (Fig. 6B), rod and cone bipolar cells (Fig. 6C, D), various types of amacrine cells (PKCα-positive and cholinergic, Fig. 6C, E), and ganglion cells (Fig. 6F) were present in CKO retinas.
All cells displayed normal morphology, pattern of stratification and their processes had appropriate lamination in the plexiform layers. Retinal glial cells, in particular astrocytes and Müller cells (Fig. 6A and B), were also indistinguishable from control specimens. As aforesaid, the majority of rod bipolar cells were Cre-positive, as demonstrated by double immunostaining with anti-PKCα and anti-Cre (Fig. 6C) or anti-GFP antibodies (data not shown). As expected, Cre staining was nuclear and showed a similar pattern in the CKO and wild-type retinas (Fig. 3A, B). Cre-positive nuclei occupied the presumptive bipolar cell layer; both rod and cone bipolar cells were Cre-positive and presumably Dicer-null. A few nuclei from Cre-positive, PKCα-negative cells were larger in size and were presumably derived from Müller cells. All these data imply that removal of Dicer in retinal progenitors did not affect retinal cell fate or migration of cells to their wild-type locations during retinal development.
Figure 6: Characterization of cell types in Dicer CKO retina
A, Rods and cones, labelled red by recoverin antibody, in a 3-month old CKO retina; cones
are counterstained green with peanut lectin. Their synaptic terminals formed a regular row in the outer plexiform layer, similar to what is observed in a normal retina. B, Horizontal cells, labelled red by calbindin antibody, formed a tier in the outer part of the inner nuclear layer. Some of these sprouted ectopic neuritis toward the outer retina (arrows). The green signal denotes Cre staining. The section is from a P35 retina. C, Cre-positive nuclei (green) belong mostly to rod bipolar cells, the membranes of which are appropriately labelled red by an antibody against PKCα. The section is from a P45 retina.
Figure 6: Characterization of cell types in Dicer CKO retina (continue)
lar cells.
D, In this section Anti-G0α antibodies (green) label ON-center cone and rod bipo
PKCα antibody labels only rod bipolar cells (red), orange-yellow cells, labelled by both antibodies, are rod bipolar cells. Green cells are ON-center cone bipolar cells (CB). Some of these cells (arrow) appeared displaced toward the outer retina at a location adjacent to a photoreceptor rosette. The section is from a P45 retina. E, Cholinergic
amacrine cells (ChA; red) are seen in the CKO retina at the expected location. Their cell bodies formed two mirror-symmetric populations (arrows) in the inner nuclear and ganglion cell layers, respectively, whereas their processes formed two bands in the inner plexiform layer, characteristic to what is observed in the normal retina. Blue staining is a nuclear dye. The section is from a P30 retina. R, Rosette. F, Antibodies against the 200 kDa subunit of neurofilaments (red) revealed the axonal arborizations of horizontal cells (HCa) and the somata of large ganglion cells (Gc) in the appropriate retinal layers. Green cells are stained with Cre antibodies. The section is from a P35 retina. Ph, Photoreceptors; onl, outer nuclear layer; opl, outer plexiform layer; ipl, inner plexiform layer; gcl, ganglion cell layer.
The most remarkable abnormal trait present in all CKO retinas aged P16 and older
rwise normal retinal outer surfa
ng bipol
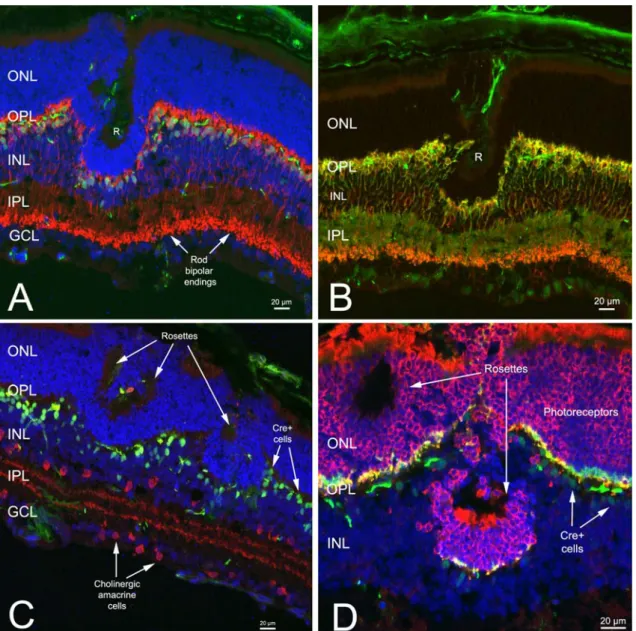
was a focal loss of lamination in the ONL, with the presence of photoreceptor rosettes (Fig. 7, 8). Rosettes are spherical structures, formed by photoreceptors only, that are oriented toward an internal lumen with photoreceptor outer segments protruding inward. Presence of infiltrating retinal pigmented epithelium (RPE) cells are also occasionally observed inside rosettes (data not shown).
In P16 mutants, rosettes were spread along an othe
ce and were primarily composed of photoreceptors and their synaptic terminals (Fig. 7D ). The number and density of rosettes are variable in each retina, probably due to differential expression of the transgene; however, each rosette was distinct from the others and clearly identifiable even at low magnification and, for a trained eye, without staining. Curiously, the presence of rosettes did not appear to disrupt the typical laminar organization of the underlying retina: inner retinal layers were unaltered by overlying rosettes, and the number of rows of photoreceptor nuclei in areas adjacent to rosettes was found to be normal, as detected by fluorescent nuclear counterstaining.
Rosette structures were always associated with the presence of Cre-expressi ar cells (fig. 7A and B), putative to belong to Dicer ablated retinal columns. Nevertheless, a strict correlation between location of green cells (Cre is fused to GFP) and loss of lamination in the ONL was not observed (fig. 7).
Figure 7. Loss of lamination in Dicer CKO retinas
Immunocytochemical analysis of mutant retinas at the age of P16 reveal occurrence of rosettes. At this time, these structures are formed by photoreceptors exclusively. In facts, nuclear staining (blue) colocalizes only with photoreceptors (D, labelled red by recoverin). Other cell types, like rod bipolars (A and B, stained red with anti-PKCα), ON-center cone bipolar cells (B, stained with an antibody against G0α) and cholinergic amacrines (labelled red in C by anti-choline acetyl-transferase, or ChAT), do not participate to rosette structure. In all sections, green nuclei into the inner nuclear layer are immunoreactive for Cre recombinase. R, rosette.
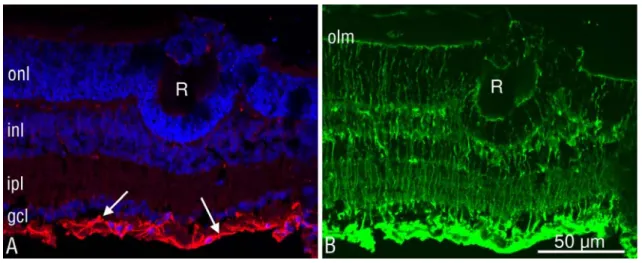
It is interesting to notice at this stage that this morphological abnormality was not accompanied by a concomitant overexpression of glial fibrillary acidic protein (GFAP) in Müller cells (Fig. 8), known as unambiguous sign of glial activation and often associated with retinal degeneration or impairment in laminar organization (Marc et al., 2003).
Figure 8. Müller glia is not hyperactivated at the end of synaptogenesis.
Representative rosette in a P16 Dicer CKO retinal section. A, Nuclear staining (blue) demonstrated that the rosette (R) at this stage of development was composed exclusively of photoreceptors (identified by their distinctive nuclear morphology). GFAP staining (red) was limited to astrocytic processes in the ganglion cell layer (arrows), indicating that macroglial reactivity was virtually absent after removal of Dicer. B, Rosettes did not appear to contain Müller cells because the Müller cell-specific enzyme glutamine synthase (green signal) did not colocalize with cells in the rosette. olm, Outer limiting membrane; onl, outer nuclear layer; inl, inner nuclear layer; ipl, inner plexiform layer; gcl, ganglion cell layer.
3.4 The formation of rosettes is not associated with a proliferation
defect
Rosettes have been described in the past as a consequence or a side-effect of many pathological retinal conditions as retinoblastoma (Yuge et al., 1995), diabetic retinopathy (Lahav et al., 1975), and retinitis pigmentosa (Tulvatana et al., 1999). In these diseases, retinal degeneration and/or abnormal proliferation are present (Lin et al.,
2001). hence, this, we hypothesized that an uncontrolled cell proliferation could be the cause of the early phenotype observed in Dicer CKO retinas.
To test this hypothesis, we stained sections from several P16 retinal samples with antibodies against phosphorilated histone 3 (PH3), a specific marker of cell proliferation. PH3 is known to mark about 10% of all proliferating cells, as this post-translational modification in 3H histones occurs only at mitosis (Dhomen et al., 2006) (Fig. 9). In addition, we treated P35 animals with BrdU.
Using either method, we failed to detect dividing cells in CKO retinas. As a positive control, mitotic cells were observed in other ocular tissues such as the cornea (Fig. 9). Thus, rosette formation did not appear to be caused by an up-regulation in retinal cell proliferation.
Figure 9. Absence of proliferation in Dicer CKO retina
Vertical sections of P16 Dicer CKO (A) and wt (B) retina, exhibiting a typical rosette (R), stained with antibodies against Cre (green) and phosphohistone H3 (red) to locate mitotic cells. No dividing (red) cells were visible in both sections. As a positive control, the inset shows mitotic cells of the corneal surface from the same ocular section from which the retinal slide was obtained. R, rosette; onl, Outer nuclear layer; inl, inner nuclear layer.
3.5
Retinal morphology in immature Dicer CKO retinas
The formation of rosettes could reflect a defect of retinal development. Previously, it was shown in different models that the loss of the proper retinal lamination could be caused by a lack of orientation of retinal progenitors due to defects in apico-basal polarity. Others reported the generation of retinal folds in association with the disruption of outer limiting membrane (OLM) components (Erdmann et al., 2003; Malicki et al., 2003; Masai et al., 2003; for review, see Malicki, 2004; Galli-Resta et al., 2008). Therefore, we analyzed retinas of newborn (P2) mutant mice by means of immunocytochemistry, electron and light microscopy.
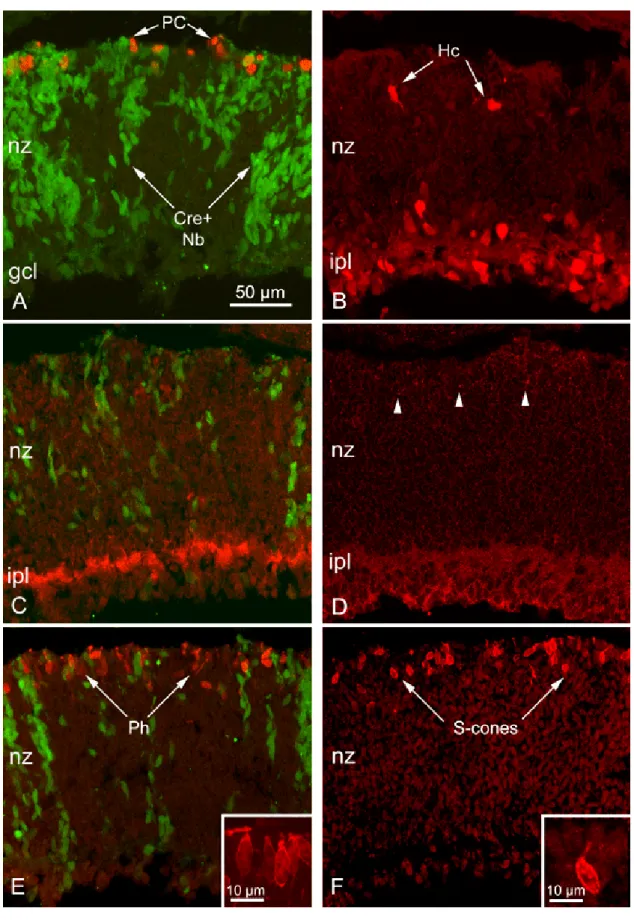
No differences were observed between Dicer CKO and control P2 retinas. Mitotic cells were present at the edge of the retina, close to the OLM, as shown either by fine light microscopy (fig. 11A, inset) and staining for PH3 (fig. 10A), while numerous Cre-positive retinoblasts, alternating to Cre-negative ones, were detectable in the neuroblastic layer (NBL). Elongated morphology and radial orientation of these cells were identical in retinas of mutant and wild-type littermates, as assessed by EM. The placement and morphology of newly differentiated photoreceptors, likely to be cones at this age, were also correct: we observed at very high magnification differentiated cells at the OLM surface displaying also a developing outer segment, as shown by the presence of a growing cilium (fig. 11D ). The identity of photoreceptors was also demonstrated by expression of specific markers as recoverin (fig. 10E ) and S-opsin (fig. 10F). Horizontal cells occurrence was screened too by means of the above mentioned methods (fig. 10B).
In addition, staining for vesicular transporters of glutamate and GABA (vGlut-1 and v-GAT, respectively; fig. 10D and C) revealed exact positioning of synaptic contacts contributing to the formation of a normal IPL. Finally, the integrity of the outer limiting membrane appeared preserved, as demonstrated both by EM (fig. 11D) and immunostaining for ZO-1, a marker of adherens junctions (fig. 11C). ZO-1 labelling was continuous, and electron microscopy confirmed the presence of electron dense junctions in the lateral membranes of the cells at the outer retinal aspect. All these data suggest that the formation of rosettes in Dicer CKO retinas occurs postnatally, in a terminal phase of development.
Figure 11. Morphology of the outer retina in Dicer CKO mice at P2.
(next page)
A. Light micrograph of semithin section. Dividing cells (m) abut the outer retinal margin (A and inset) in a well known pattern described for wild type animals. In addition, differentiating horizontal cells, recognized by their pale cytoplasm and elongated shape, interrupt the neuroblastic zone (nz) to assume a tangential position (arrows) at the border of the developing opl (dashed line). Pycnotic (dying) cells (p in the inset) in the outer retina, as previously reported at this developmental stage.
B: Adherens junctions of the outer limiting membrane in fully mature retinas are composed of several proteins including ZO-1 and ZO-2. Antibodies against ZO-1 showed a highly specific pattern of staining in the Dicer CKO retina at P2. Staining precisely underlied the developing junctional complex at the outer margin of the tissue (B). A similar, albeit weaker, pattern of staining is produced with atypical PKC antibodies, which recognize proteins participating in the so-called subapical region of the photoreceptors. Positive staining in mutants was suggestive that the polarity of these cells was correct (not shown). The development of adherens junctions at the appropriate apical location was confirmed by EM (C). These junctions can be recognized from their electron dense appearance and thickening of the adjoining membranes. They form a continuous ribbon joining developing photoreceptors and neuroblasts (C). D: Appropriate photoreceptor orientation in the CKO retina was confirmed by the identification of cilia (c) growing from the outer aspects of cells positioned at the interface with the pigment epithelium. Arrowheads point to adherens junctions.
Figure 10. Antibody labeling of Dicer CKO retinal sections at P2.
(previous page)
A: Phosphohistone 3 antibodies showed dividing cells appropriately positioned at the outer aspect of the developing retina, within and outside the columns of Cre+, GFP+, Dicer-/- clones of cells (in green). nz: neuroblastic zone. B: Calbindin D antibodies (red) showed differentiating horizontal cells, correctly positioned in the outer retina, and appropriately located amacrine and ganglion cells in the inner retina. C: At P2 GABAergic amacrines are differentiating. An antibody against the vesicular GABA transporter (vGAT) labeled the developing inner plexiform layer in mutants as expected (red signal). D: the vesicular glutamate transporter (vGLUT 1) showed developing synaptic terminals of photoreceptors as bright puncta (arrowheads). E:
recoverin antibodies (red) showed photoreceptors (Ph) differentiating at the outer retinal margin, both within and outside the columns of Cre+ neuroblasts (green). Inset: developing photoreceptors with elongated shape. F: S-cone opsin antibodies (red).Inset: developing cone with asymmetric shape, typical of the phase of active elongation of cilia.
3.6 Phenotype progression in Dicer CKO mice – P30/P45
The time window between P16 to P45 appeared characterized by a progressive alteration and remodelling of retinal laminar structures in the Dicer CKO mice.
Rosettes increased in number and size and, most importantly, complexity. In facts, the tendency of bipolar and horizontal cells to send processes towards the ONL, seldom observed even in P16 retinas, evolved in a profusion of dendritic sprouting.
Cell migration also occurred, as we observed second order neurons in the ONL even in high proximity to the OLM (fig. 12B,C,D) Interestingly, the outer plexiform layer (OPL) appeared to be deformed too, but a clear discontinuity was never observed, as synaptic proteins could always be detected ectopically in the ONL (fig. 12A). In addition, relocating photoreceptors and second order neurons seemed to maintain synaptic contacts: specifically, immunostaining revealed close association between post synaptic density protein 95 (PSD-95), expressed in photoreceptor terminals, and punctated signal from metabotropic glutamate receptor 6 (mGluR6), located on dendritic tips of ON bipolar (and thus rod and ON cone bipolar) (fig. 12E). In this period, two other important phenomena were always observed in CKO retinas. First, a few number of nuclei became pyknotic in both the ONL and the INL (fig. 12C), indicating the occurrence of cell death among photoreceptors and inner retinal cells. Secondly, at this stage Müller cells began to be reactive, with overexpression of GFAP particularly in the proximity of rosettes (fig. 12F).
We detected a single isolated case of focal retinal duplication probably owed to extreme defects in retinal lamination. Stained section from this peculiar retinal preparation revealed two complete and opposite retinal sheets separated by RPE (data not shown).
Figure 12. Neuronal migration in one month aged Dicer CKO retinas.
Rosettes increase in number and size and complexity. Additionally to photoreceptors (A, red by recoverin), second order neurons like rod (B and D, stained with anti-PKCα) and ON-cone bipolar cells (D, in green for antibody against G0α) as well as horizontal cells (C, labelled red with anti-calbindin) surround rosettes. Synaptic contacts are maintained, as pre- and post-synaptic proteins, even if ectopic, remain in close contacts. In A and E, PSD-95 stains photoreceptor terminals, while mGluR6 labels ON-bipolar cells dendritic tips. At this stage, hyperactivation of Müller cells by overexpression of GFAP occurs.
3.7 Retinal degeneration – 3 months and later
Dicer deficient retinas of three months and older were analyzed by immunostaining as previously described. At this age, retinas showed clear signs of degeneration. Rosettes were rare or totally absent. The ONL was thinned to a third for a decrease in the number of rows of photoreceptors to 3-5 (fig.13A and D ; fig.14). Degeneration occurred in the INL as well, as pyknotic bodies were clearly visible in both layers. The distribution of horizontal cells appeared to be more sparse, even if the sequence of cells and processes was not interrupted. More interestingly, the number of rod bipolar cells was dramatically decreased, with large retinal areas totally devoid of cells. The few surviving rod bipolars often occurred in clusters and displayed anomalous morphology: axons were hypertrophic with bulbous-like endings, while dendrites were scant and enlarged or lacking. PKCα labelling was abnormally bright and had an unusually punctate appearance. In addition, it is important to notice that remaining cells were Cre-negative, and hence not Dicer ablated. Cre-positive rod bipolar cells were observed infrequently and exhibited irregular morphology and/or pyknotic nuclei.
Curiously, we noticed no apparent change in the integrity of the outer plexiform layer. Data shown here strongly demonstrate that conditional ablation of Dicer eventually leads to retinal degeneration.
Figure 13. Dicer CKO retinas undergo degeneration from the age of 3 months onward.
A, Ectopic horizontal cell, labelled red by antibodies against calbindin D, send sprouts even
out of the remaining retina, crossing with its processes a very thin photoreceptor layer. In green, nuclei stained by anti-Cre.
B, At late stages, photoreceptors and inner retinal layers degenerate. Only three to five rows
of photoreceptor nuclei remained in the outer nuclear layer of this 5-month-old retina. Rod bipolar cells, stained with PKCα (red), were scant and aberrant dendritic arborizations. These cells were Cre negative. A few Cre-positive cells (labelled green by anti-Cre antibodies) persisted in the inner nuclear layer (arrows).
C, Degeneration of bipolar cells in Dicer CKO retinas at five month of age. Particularly, rod
bipolar cells, labelled by anti-PKCα, appear to be sensitive to absence of miRNAs.
D, Glial activation accompanied retinal degeneration in 3-month old CKO retinas. In this
image, Müller glial cells (Mc) were stained both by glutamine synthase (green) and GFAP antibodies (red). The latter demonstrates that glial activation was widespread. Note the decrement in the number of photoreceptor rows to 2–5 from the 12–14 of a normal retina. HC, horizontal cell; onl, Outer nuclear layer; opl, outer plexiform layer; inl, inner nuclear layer.
Figure 14. Extensive retinal degeneration in 5 months aged mutant retinas.
A, Extensive degeneration of the CKO retina at 5 months of age. Nuclei are stained blue by
a fluorescent DNA-binding molecule. B, Compared with an age-matched, wild-type retina, all the layers of the CKO appeared thinner. Rod bipolar cells, labeled red by PKCα antibody, were significantly reduced in number and displayed only rare and disorganized dendrites compared with their counterpart in the wild-type retina. Surviving rod bipolar cells in the CKO were primarily Cre negative, whereas the number of Cre-positive cells (green labeling) was much decreased compared with the wild-type retina. Pyknotic nuclei, indicative of apoptotis, were visible in the outer nuclear layer (arrows) and in the inner nuclear layer (arrowhead) of the CKO retina. C, Retinal section from a heterozygous animal, stained as the preparations shown in A and B. No evident alterations of the morphology were detectable in heterozygous individuals. onl, Outer nuclear layer; opl, outer plexiform layer; inl, inner nuclear layer; ipl, inner plexiform layer; gcl, ganglion cell layer.
3.8 Electrophysiological findings in Dicer CKO eyes
An electroretinogram (ERG) study was performed by our scientific partners at the University of Florida to obtain information on the functional status of CKO retinas.
Recordings demonstrated a decreased ERG amplitude in mutant animals even at 1 month of age. Both scotopic (dark adapted; a- and b-wave) and photopic (light adapted; b-wave) responses were affected. At the age of 5 months, ERGs were nearly extinct.
Figure 15. ERG amplitudes
Average maximum scotopic a- and b-wave (A) and photopic b-wave (B) amplitudes for wild-type (WT), Dicer+/-, and Dicer -/- eyes. Scotopic and photopic values for Dicer+/- and Dicer -/- eyes at 1, 3, and 5 months differed from wild type and each other. Different sets of mice were recorded at 1, 3, and 5 months, because the mice were killed the day after ERG for morphological studies. Error bars indicate SEM. M, Month.
Figure 16. ERG traces
Representative scotopic (A) and
corresponding photopic (B) ERG traces recorded at 5 months of age from wild-type, Dicer CKO heterozygous (+/-), and Dicer CKO homozygous (-/-) mice. Traces from each strain were similar at all time points analyzed.
Such findings are consistent with a severe impairment of the visual function. A general variability observed in the amplitudes of ERG responses in different animals correlates well with mosaic expression of Cre from the transgene.
3.9 Heterozygous mice
Mice having an heterozygous genotype (Dicer flox
/+ ; Chx10Cre) exhibited unexpected characteristics. In facts, the morphology of all retinas, examined with detailed confocal microscopy, was identical to that of wild type controls. In spite of that, the ERG was found to be diminished in heterozygous compared to control mice, albeit not as much as for CKO animals.
These data suggest a dose-dependent influence of Dicer in retinal functioning.
Figure 17.
Mice heterozygous for Dicer show visual impairment in spite of excellent morphological preservation.
This section from a 5 months aged heterozygous retina is practically indistinguishable the wt control. As described above, PKCα stains rod bipolar cells selectively, while G0α labels the entire population of ON-center bipolar cells.
3.10 Inhibition of single retinal specific miRNAs: preliminary
results
The analysis of Dicer CKO retinas gave valuable information about the overall function of miRNAs in retinal development and homeostasis. To gain further insight in the involvement of individual miRNAs in the onset of described phenotypes, intravitreal injection with LNA antisenses to eye specific miRNAs were performed in young wild type mice. Injections with antisenses against miR-182, miR-183 or both were performed in one eye. As a control, the other eye was injected with the same amount of a scrambled sequence. The effective inhibition of retinal miRNAs expression was assessed via in situ hybridization on retinal section. In some cases, we detected retinal areas with decreased signal compared to control specimens.
In few cases, this treatment reproduced all the main hallmarks of the Dicer CKO phenotype as early as one week after the injection. Formation of photoreceptor rosettes was clearly visible (fig. 18). The phenomenon was associated to infiltration of RPE cells, degeneration of photoreceptors and rod bipolar cells, misplacement of synaptic proteins in the outer retinal layers. Unfortunately, the low ratio of successful experiments and the sporadic occurrence of a phenotype in control eyes as well complicated greatly the interpretation of the results obtained .
A
B
Figure 18. Antisense inhibitors of single retinal specific miRNAs are capable to reproduce the phenotype observed in Dicer CKO retinas (preliminary).
Photoreceptor rosettes occur wild type mice after a week from an intravitreal injection of antisense oligonucleotides against a retinal microRNA (miR-182 and/or miR183). Retinal degeneration is detectable in both outer and inner nuclear layer by the presence of pyknotic nuclei and decrease in the number of rod bipolar cells (bottom, stained red with PKCα anitibodies). Horizontal cells, red by calbindin, do not migrate into ONL.
3.11 Generation of rd1/Thy-1 GFP-M mouse
To obtain green fluorescent RGCs in a framework of retinal degeneration, we crossed the rd1 mouse (Keeler et al., 1924) with the Thy-1 GFP-M transgenic line (Feng et al., 2000), in which expression of GFP is driven by a promoter for the Thy-1 gene, expressed in the retina in RGCs only. In this particular line, a small number of isolated RGCs are labelled.
Figure 19. Diversity of retinal ganglion cells in the rd1/Thy-1 GFP mouse. GFP labelled RGCs with large (A1, A2 outer) and small (B1, B2) dendritic trees. A and B cell types could be considered the paralogous of α and β type of cat RGCs.
Figure 20. Diversity of retinal ganglion cells in the rd1/Thy-1 GFP mouse. GFP labelled RGCs. A subset of C3 cells is positive for melanopsin, while C6 and D2 types exhibit directional selectivivity. C1 and C3, ON-center; C6, OFF-center; D2, ON-OFF (bi-stratified).
As expected, progeny was viable and fertile. Heterozygous were crossed multiple times with rd1 mice to obtain a pure C3H background (background is considered pure after nine backcrossing, or F9).
Unpredictably, the number of labelled RGCs in heterozygous rd1/Thy-1 GFP-M was about one third (average of 13 cells per retina) of the number observed in Thy-1 GFP-M founders (about 50 cells). However, after crossing F9 mice we obtained again a number of labelled cells comparable to the founder value. To our knowledge, this is the first time in which a correlation is observed between copies of the Thy1-GFP alleles and number of GFP-positive cells..
The most representative cell types found to be labelled in rd1/Thy-1 GFP mice were, according to Sun’s classification, C2 ganglion cells, characterized by large and sinuous dendritic trees, and B3 ganglion cells, with small, recursive and quite asymmetrical dendritic arbors. Together, C2 and B3 represent approximately 40% of the total number of GFP-positive RGCs encountered (82/224).
3.12 Morphology of the ganglion cell layer (GCL) in the rd1
mouse
The assessed reduction of RGCs size could reflect processes of remodelling and degeneration in the GCL. Thus, we studied the morphology of the GCL in the rd1 retina at the ages of 4,5 months and one year by means nuclear counterstain with ethidium. All the confocal images acquired showed some for of abnormality, the most obvious being the presence of areas devoid of cells in the GCL, particularly in the mid- and far-periphery. In addition, and particularly at 1 year of age, numerous cells exhibited various degrees of nuclear condensation, suggesting a pre-degeneration stage.
Figure 21. Aberrant
morphology in the GCL of rd1 mice.
Ethidium nuclear staining in retinal whole mounts. Circle depict areas devoid of cells, while arrows indicate examples of condensed nuclei.
The image is acquired from a one-year aged retina.
3.13 Topographical cell counts: survival of ganglion cells in Rd1
mouse retina
To evaluate RGC survival we did topographical cell counts of cells in the GCL, known to be constituted by 50% of RGCs. Cells were counted in central, middle,
peripheral and far-peripheral retina in rd1 mice aged 4,5 months and 1 year. The number of cells with condensed nuclei was also assessed.
To have a good estimate of the total cell number in the GCL, we resolved to count about one tenth (or, 12500-13000 cells) per retina (see Materials and Methods).
The number of total cells in GCL was found to be very similar in 4,5 months (132770, SE 2873) and 1 year (125221, SE 2430). The value is not different from previous data on total RGCs in 8 weeks-old rd1 mice of the same strain (68200, SE 3500; Williams et al., 1996). Statistical analysis showed a 5,7% decrease in the number of cells of the GCL in the time window analyzed. (p=0,05; one-way ANOVA) This slight variation in cell counts with a low statistic significance reflects a substantial preservation of cells in the GCL. Nevertheless, the number of cells with condensed nuclei increased, nearly doubling from 4,5 months (7120, SE 618) to 1 year (13166, SE 718) of age (+ 85%; p=0,000…;one-way ANOVA).
.
A
C D
B
Figure 22. Cell survival in the GCL of aged rd1 mouse retina. (previous page)
Total cell count were performed in the GCL of 4,5 (A) and 12 months (B) aged rd1 mice. Different animals within the same populations were shown to be statistically homogeneous. After this, the two distributions were compared statistically (C). Most of the cells of GCL remain viable in the aged rd1 mouse.
The same procedure was conducted for counting the number of condensed nuclei (black bars in all graphs). In D, examples of acquired fields in 4,5 and 1 year aged retinas.
3.14 Nuclear condensation does not seem to affect ganglion cells
in rd1 mouse retina
Nuclear condensation in the GCL of rd1 mouse retinas could be suggestive of cell suffering. To identify cell types undergoing nuclear condensation, we reacted some aged rd1 retinas with antibodies to Brn-3b and choline acetyl-transferase (ChAT), expressed in a large subset of RGCs and in cholinergic amacrine cells, respectively. Retinas were counterstained with ethidium to analyze gross nuclear morphology.
Figure 23. Nuclear condensation does not affect RGCs in aged rd1 mice.
Immunostaining for Brn-3b, a specific RGC marker, or ChAT, expressed in cholinergic amacrines (both green), combined with ethidium nuclear staining (in red) on retinal whole-mounts from 1 year aged rd1/Thy-1 GFP mice. Arrows show nuclear condensation in labelled cells. In insets, channels are shown separately for a better visualization.
We never detected nuclear condensation in Brn-3b positive RGCs; conversely, a good number of cholinergic amacrines showed this particular morphological feature.
3.15 Morphology of RGCs in adult rd1/Thy-1 GFP mice
The rd1/Thy-1 GFP mouse is a useful model to analyze the morphology of RGCs in a well known model of retinal degeneration. We compared morphometric parameters of labelled RGCs to published values according to Sun’s classification, beginning at 4 - 4,5 months of age, a temporal point when second order neurons have already partially degenerated. Retinas from 9 months and 1 year old mice were analyzed as well. Cells were classified after measuring the soma size, the dendritic field diameter and the depth of stratification in the IPL. The overall shape of the cells was also examined. About a half of cells were perfectly normal in the three morphometric parameters mentioned above, falling within published ranges. Conversely, remaining RGCs were shown to be anomalous. In particular, the area subtended by dendritic arborisations was reduced and, sometimes, the size of the soma appeared smaller as well (fig. 24, 25). In these cases, classification was possible only using an accurate evaluation of the shape by visual inspection. In addition, the presence of multiple swellings in both the axonal and dendritic compartments was detected in many cells. Finally, in few cases RGCs exhibited dendritic sprouting in the INL.
Genetic background effects did not modify none of the measured parameters, as RGC values in mice backcrossed three times into the C3H background (referred as F3 generation) displayed no significant differences with those belonging to the F9 (“clean”) generation.
These data demonstrate that some RGCs display a reduction in their size in the rd1/Thy-1 GFP mouse. Experiments are still in progress to assess quantitatively any
variation in the complexity of dendritic arborisation by means of an appropriate software.
Figure 24. Type B3 cells in the adult rd1/Thy-1 GFP retina
A half of RGCs display normal features (top), while remaining cells exhibit reduction of dendritic trees (bottom).
Figure 25. Type C2 cells in the adult rd1/Thy-1 GFP retina
As found for small dendritic tree types (B3), in adult mutant retinas normal sized (top) and undersized (bottom) large RGCs (type C2) are detectable.
3.16 Retinal ganglion cells in 1 month-aged rd1/Thy-1 GFP
To identify the temporal window in which reduction of dendritic trees of RGCs in rd1 retinas occurred, we analyzed one month-old rd1/Thy-1 GFP retinas using the methods previously described. At this time, development of the dendritic compartment of RGCs has just completed. A number of 224 RGCs at different ages were classified and measured. We concentrated on two particular types of RGCs, B3 and C2 . These types comprise small and large dendritic tree areas, respectively, and both occur as inner (ON-center) and outer (OFF-center) varieties, depending from depth of stratification of dendrites into the IPL. In addition, they were quite common among GFP labelled cells.
In the comparison, RGCs with normal and undersized dendritic tree area were considered as separated groups. Moreover, as no substantial difference occurred among RGCs from 4,5 to 12 months of age, we grouped all these cells in one temporal point (4-12 months). Each group was compared to parameters of RGCs from transgenic C57BL6J/Thy-1 GFP mice aged 7 months, taken as wt controls. These data were recently obtained in our laboratory (Mazzoni et al., 2008).
No differences were observed within the four RGC types considered normal in their sizes in both 1 month and 4-12 months temporal points (fig. 28). Instead, undersized cells made separate clusters, and displayed reduction of about 40-50% in their dendritic tree area. This difference was highly significant (p=0,001; one-way
Figure 26. Type B3 cells in 1 month-aged rd1/Thy-1 GFP retina
Retinal ganglion cells show reduced dendritic trees even at one month of age, at a time when development of their processes has just ended.
Figure 27. Type C2 cells in 1 month-aged rd1/Thy-1 GFP retina
As for B3, a half of large type C2 RGCs are undersized in 1 month aged rd1/Thy-1 GFP-M mouse.
Figure 28. Comparison between undersized, normal and wild-type RGCs.
Type B3 and C2 RGCs was chosen for statistical analysis. Cells from the same population were grouped in normal (red patterned bars in the graphs) and undersized RGCs (red bars). As a control, cells were compared with C57BL6J/Thy1-GFP-M (black bars in graphs). Within the four classes, no differences were observed between normal and wild type cells. Conversely, undersized RGCs in the rd1/Thy-1 GFP mouse displayed reduced morphometric parameters in respect to wild type controls. These data are highly significant (p<0.001, one-way ANOVA)
This study demonstrates clearly that the observed reduction of RGC dendritic trees in rd1 mouse is already present at one moth of age and can be probably attributed to a developmental impairment more than to regressive remodelling.