DOI 10.1140/epjc/s10052-017-4940-4 Regular Article - Experimental Physics
Energy dependence of forward-rapidity J/ψ and ψ(2S)
production in pp collisions at the LHC
ALICE Collaboration⋆
CERN, 1211 Geneva 23, Switzerland
Received: 14 March 2017 / Accepted: 24 May 2017
© The Author(s) 2017. This article is an open access publication
Abstract We present results on transverse momentum ( pt) and rapidity (y) differential production cross sections, mean transverse momentum and mean transverse momen-tum square of inclusive J/ψ and ψ(2S) at forward rapid-ity (2.5 < y < 4) as well as ψ(2S)-to-J/ψ cross section ratios. These quantities are measured in pp collisions at cen-ter of mass energies √s = 5.02 and 13 TeV with the ALICE detector. Both charmonium states are reconstructed in the dimuon decay channel, using the muon spectrometer. A com-prehensive comparison to inclusive charmonium cross sec-tions measured at √s = 2.76, 7 and 8 TeV is performed. A comparison to non-relativistic quantum chromodynam-ics and fixed-order next-to-leading logarithm calculations, which describe prompt and non-prompt charmonium pro-duction respectively, is also presented. A good description of the data is obtained over the full ptrange, provided that both contributions are summed. In particular, it is found that for pt >15 GeV/c the non-prompt contribution reaches up to 50% of the total charmonium yield.
1 Introduction
Charmonia, such as J/ψ and ψ(2S), are bound states of a charm and anti-charm quark (c¯c). At LHC energies, their hadronic production results mostly from the hard scattering of two gluons into a c¯c pair followed by the evolution of this pair into a charmonium state. Charmonium measurements in pp collisions are essential to the investigation of their produc-tion mechanisms. They also provide a baseline for proton-nucleus and proton-nucleus-proton-nucleus results which in turn are used to quantify the properties of the quark-gluon plasma [1,2].
Mainly three theoretical approaches are used to describe the hadronic production of charmonium: the Color Evapora-tion Model (CEM) [3,4], the Color Singlet Model (CSM) [5] and the Non-Relativistic Quantum Chromo-Dynamics model
⋆e-mail:[email protected]
(NRQCD) [6]. These approaches differ mainly in the treat-ment of the evolution of the heavy-quark pair into a bound state. In the CEM, the production cross section of a given charmonium is proportional to the c¯c cross section, integrated between the mass of the charmonium and twice the mass of the lightest D meson, with the proportionality factor being independent of the charmonium transverse momentum pt, rapidity y and of the collision center of mass energy √s . In the CSM, perturbative QCD is used to describe the c¯c production with the same quantum numbers as the final-state meson. In particular, only color-singlet (CS) c¯c pairs are con-sidered. Finally, in the NRQCD framework charmonium can be formed from a c¯c pair produced either in a CS or in a color-octet (CO) state. The color neutralization of the CO state is treated as a non-perturbative process. For a given order in αs, it is expanded in powers of the relative velocity
between the two charm quarks and parametrized using uni-versal Long Distance Matrix Elements (LDME) which are fitted to the data. The predictive power of NRQCD calcu-lations is tested by fitting the LDME to a subset of the data and comparing cross sections calculated with these LDME to measurements performed at different energies. It is therefore crucial to confront these models to as many measurements as possible, over a wide range of pt, y and √s , and with as many different charmonium states as possible. The com-parison can also be extended to observables other than cross sections, such as charmonium polarization [7–9].
In this paper we present results on the production cross sections of inclusive J/ψ and ψ(2S) at forward rapidity (2.5 < y < 4) measured in pp collisions at center of mass energies √s = 13 and 5.02 TeV. For J/ψ at√s = 5.02 TeV, the pt-differential cross sections have been published in [10] while the y-differential cross sections are presented here for the first time.
The J/ψ and ψ(2S) are measured in the dimuon decay channel. The inclusive differential cross sections are obtained as a function of ptand y over the ranges 0 < pt<30 GeV/c for J/ψ at √s = 13 TeV, 0 < pt <12 GeV/c for J/ψ at √s
√s
= 13 TeV. At√s = 5.02 TeV only the pt-integrated ψ (2S) cross section is measured due to the limited inte-grated luminosity. The J/ψ result at √s = 13 TeV extends significantly the pt reach of measurements performed in a similar rapidity range by LHCb [11]. The J/ψ result at √s
= 5.02 TeV and the ψ(2S) results at both√s are the first at this rapidity. The inclusive ψ(2S)-to-J/ψ cross sec-tion ratios as a funcsec-tion of both ptand y are also presented. These results are compared to similar measurements per-formed at √s = 2.76 [12], 7 [13] and 8 TeV [14]. These comparisons allow studying the variations of quantities such as the mean transverse momentum ⟨pt⟩, mean transverse momentum square⟨p2
t⟩ and the pt-integrated cross section as a function of √s . Put together, these measurements con-stitute a stringent test for models of charmonium produc-tion. In particular, an extensive comparison of the J/ψ and ψ (2S) cross sections at all available collision energies to the calculations from two NRQCD groups is presented towards the end of the paper (Sect.4). In addition, the pt-integrated J/ψ cross section as a function of √s is also compared to a CEM calculation. No comparison to the CSM is performed since complete calculations are not available at these energies beside the ones published in [13,15].
All cross sections reported in this paper are inclusive and contain, on top of the direct production of the charmonium, a contribution from the decay of heavier charmonium states as well as contributions from the decay of long-lived beauty fla-vored hadrons (b-hadrons). The first two contributions (direct production and decay from heavier charmonium states) are commonly called prompt, whereas the contribution from b-hadron decays is called non-prompt because of the large mean proper decay length of these hadrons (∼500 µm).
The paper is organized as follows: the ALICE apparatus and the data samples used for this analysis are described in Sect.2, the analysis procedure is discussed in Sect.3while the results are presented and compared to measurements at different √s as well as to models in Sect.4.
2 Apparatus and data samples
The ALICE detector is described in detail in [16,17]. In this section, we introduce the detector subsystems relevant to the present analysis: the muon spectrometer, the Silicon Pixel Detector (SPD), the V0 scintillator hodoscopes and the T0 Cherenkov detectors.
The muon spectrometer [18] allows the detection and char-acterization of muons in the pseudorapidity range−4 < η < −2.5.1It consists of a ten-interaction-lengths front absorber 1 We note that the ALICE reference frame defines the positive z
direc-tion along the counter-clockwise beam direcdirec-tion, resulting in a neg-ative pseudorapidity range for detectors like the muon spectrometer.
followed by a 3 T m dipole magnet coupled to a system of tracking (MCH) and triggering (MTR) devices. The front absorber is placed between 0.9 and 5 m from the Interac-tion Point (IP) and filters out hadrons and low-momentum muons emitted at forward rapidity. Tracking in the MCH is performed using five stations, each one consisting of two planes of cathode pad chambers positioned between 5.2 and 14.4 m from the IP. The MTR is positioned downstream of a 1.2 m thick iron wall which absorbs the remaining hadrons that escape the front absorber as well as low-momentum muons. It is composed of two stations equipped with two planes of resistive plate chambers each placed at 16.1 and 17.1 m from the IP. A conical absorber (θ < 2◦) protects the muon spectrometer against secondary particles produced mainly by large-η primary particles interacting with the beam pipe throughout its full length. Finally, a rear absorber located downstream of the spectrometer protects the MTR from the background generated by beam-gas interactions.
The SPD is used to reconstruct the primary vertex of the collision. It is a cylindrically-shaped silicon pixel tracker and corresponds to the two innermost layers of the Inner Track-ing System (ITS) [19]. These two layers surround the beam pipe at average radii of 3.9 and 7.6 cm and cover the pseu-dorapidity intervals|η| < 2 and |η| < 1.4, respectively.
The V0 hodoscopes [20] consist of two scintillator arrays positioned on each side of the IP at z= −90 and 340 cm and covering the η range−3.7 < η < −1.7 and 2.8 < η < 5.1 respectively. They are used for online triggering and to reject beam-gas events by means of offline timing cuts together with the T0 detectors.
Finally, the T0 detectors [21] are used for the lumi-nosity determination. They consist of two arrays of quartz Cherenkov counters placed on both sides of the IP covering the η ranges−3.3 < η < −3 and 4.6 < η < 4.9.
The data used for this paper were collected in 2015. They correspond to pp collisions at √s = 13 and 5.02 TeV. The data at √s = 13 TeV are divided into several sub-periods corresponding to different beam conditions and leading to different pile-up rates. The pile-up rate, defined as the proba-bility that one recorded event contains two or more collisions, reaches up to 25% in the muon spectrometer for beams with the highest luminosity. The data at √s = 5.02 TeV were col-lected during the 5 days immediately after the √s = 13 TeV campaign. During this period the pile-up rate was stable and below 2.5%.
Events used for this analysis were collected using a dimuon trigger which requires that two muons of opposite sign are detected in the MTR in coincidence with the detec-tion of a signal in each side of the V0. In addidetec-tion, the trans-Footnote 1 continued
However, due to the symmetry of pp collisions, the rapidity is kept positive when presenting results.
verse momentum ptrigt of each muon, evaluated online, is required to pass a threshold of 0.5 GeV/c (1 GeV/c) for the data taking at √s = 5.02 (13) TeV in order to reject soft muons from π and K decays and to limit the trigger rate when the instantaneous luminosity is high. This threshold is defined as the pt value for which the single muon trigger efficiency reaches 50% [22].
The data samples available after the event selection described above correspond to an integrated luminosity Lint = 3.19 ± 0.11 pb−1 and Lint = 106.3 ± 2.2 nb−1 for √s = 13 TeV and√s = 5.02 TeV respectively. These integrated luminosities are measured following the procedure described in [23] for the data at √s = 13 TeV and in [24] for those at √s = 5.02 TeV. The systematic uncertainty on these quantities contains contributions from the measurement of the T0 trigger cross section using the Van der Meer scan technique [25] and the stability of the T0 trigger during data taking. The quadratic sum of these contributions amounts to 3.4% at √s = 13 TeV and 2.1% at√s = 5.02 TeV.
3 Analysis
The differential production cross section for a charmonium state ψ in a given ptand y interval is:
d2σ ψ d ptdy = 1 (pt(y 1 Lint Nψ(pt,y) BRψ→µ+µ−Aε( pt,y) , (1)
where BRψ→µ+µ−is the branching ratio of the charmonium state ψ into a pair of muons (5.96± 0.03% for J/ψ and 0.79± 0.09% for ψ(2S) [26]), (ptand (y are the widths of the ptand y interval under consideration, Nψ(pt,y)is the number of charmonia measured in this interval, Aε( pt,y) are the corresponding acceptance and efficiency corrections and Lintis the integrated luminosity of the data sample. The large pile-up rates mentioned in Sect.2for the √s = 13 TeV data sample are accounted for in the calculation of Lint[23]. 3.1 Track selection
The number of charmonia in a given pt and y interval is obtained by forming pairs of opposite-sign muon tracks detected in the muon spectrometer and by calculating the invariant mass of these pairs, mµµ. The resulting distribu-tion is then fitted with several funcdistribu-tions that account for both the charmonium signal and the background.
The procedure used to reconstruct muon candidates in the muon spectrometer is described in [18]. Once muon candi-dates are reconstructed, additional offline criteria are applied in order to improve the quality of the dimuon sample and the signal-to-background (S/B) ratio.
Tracks reconstructed in the MCH are required to match a track in the MTR which satisfies the single muon trigger con-dition mentioned in Sect.2. Each muon candidate is required to have a pseudorapidity in the interval−4 < η < −2.5 in order to match the acceptance of the muon spectrometer. Finally, a cut on the transverse coordinate of the muon (Rabs) measured at the end of the front absorber, 17.5 < Rabs < 89 cm, ensures that muons emitted at small angles and pass-ing through the high density section of the front absorber are rejected.
These selection criteria remove most of the background tracks consisting of hadrons escaping from or produced in the front absorber, low- ptmuons from π and K decays, sec-ondary muons produced in the front absorber and fake tracks. They improve the S/B ratio by up to 30% for the J/ψ and by a factor 2 for ψ(2S).
3.2 Signal extraction
In each dimuon ptand y interval, several fits to the invariant mass distribution are performed over different invariant mass ranges and using various fitting functions in order to obtain the number of J/ψ and ψ(2S) and to evaluate the corre-sponding systematic uncertainty. In all cases, the fit function consists of a background to which two signal functions are added, one for the J/ψ and one for the ψ(2S).
At √s = 13 TeV, the fits are performed over the invari-ant mass ranges 2.2 < mµµ < 4.5 GeV/c2 and 2 < mµµ<5 GeV/c2. The background is described by either a pseudo-Gaussian function whose width varies linearly with the invariant mass or the product of a fourth-order polyno-mial and an exponential form. The J/ψ and ψ(2S) signals are described by the sum of either two Crystal Ball or two pseudo-Gaussian functions [27]. These two signal functions consist of a Gaussian core with tails added on the sides that fall off slower than a Gaussian function. In most pt and y intervals the parameters entering the definition of these tails cannot be left free in the fit due to the poor S/B ratio in the corresponding invariant mass region. They are instead fixed either to the values obtained from Monte Carlo (MC) simula-tions described in Sect.3.3, or to those obtained when fitting the measured pt- and y-integrated invariant mass distribu-tion with these parameters left free. For the J/ψ, the posidistribu-tion, width and normalization of the signal are free parameters of the fit. For the ψ(2S) only the normalization is free, whereas the position and width are bound to those of the J/ψ fol-lowing the same procedure as in [14]. Finally, in all fits the background parameters are left free.
An identical approach is used at √s = 5.02 TeV, albeit with different invariant mass fitting ranges (1.7 < mµµ < 4.8 GeV/c2and 2 < m
µµ<4.4 GeV/c2) and a different set of background functions (a pseudo-Gaussian function or the ratio between a first- and a second-order polynomial
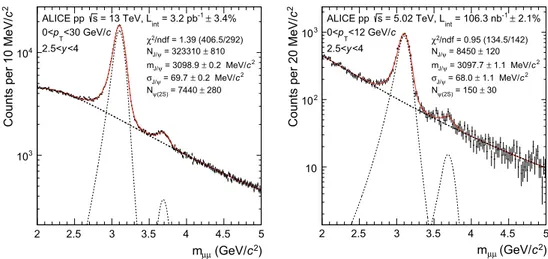
func-) 2 c (GeV/ µ µ m 2 2.5 3 3.5 4 4.5 5 2c Counts per 10 MeV/ 3 10 4 10 /ndf = 1.39 (406.5/292) 2 χ 810 ± = 323310 ψ J/ N 2 c 0.2 MeV/ ± = 3098.9 ψ J/ m 2 c 0.2 MeV/ ± = 69.7 ψ J/ σ 280 ± = 7440 (2S) ψ N 3.4% ± -1 = 3.2 pb int = 13 TeV, L s ALICE pp c <30 GeV/ T p 0< <4 y 2.5< ) 2 c (GeV/ µ µ m 2 2.5 3 3.5 4 4.5 5 2c
Counts per 20 MeV/
10 2 10 3 10 χ2/ndf = 0.95 (134.5/142) 120 ± = 8450 ψ J/ N 2 c 1.1 MeV/ ± = 3097.7 ψ J/ m 2 c 1.1 MeV/ ± = 68.0 ψ J/ σ 30 ± = 150 (2S) ψ N 2.1% ± -1 = 106.3 nb int = 5.02 TeV, L s ALICE pp c <12 GeV/ T p 0< <4 y 2.5<
Fig. 1 Example of fit to the opposite-sign dimuon invariant mass distributions in pp collisions at √s = 13 TeV (left) and 5.02 TeV (right). Dashed
linescorrespond to either signal or background functions, whereas the solid line corresponds to the sum of the signal and background functions
tion). For the signal the tails parameters are either fixed to those obtained in MC or taken from the √s = 13 TeV anal-ysis.
The number of charmonia measured in a given pt and yinterval and the corresponding statistical uncertainty are taken as the mean of the values and uncertainties obtained from all the fits performed in this interval. The root mean square of these values is used as a systematic uncer-tainty.
Examples of fits to the pt- and y-integrated invariant mass distributions are shown in Fig. 1, at √s = 13 (left) and 5.02 TeV (right). About 331× 103J/ψ and 8.1× 10³ψ (2S) are measured at √s = 13 TeV whereas about 8.6 × 10³ J/ψ and 160 ψ(2S) are measured at √s = 5.02 TeV. Corre-sponding S/B ratios, evaluated within three standard devia-tions with respect to the charmonium pole mass, are 3.4 (4.5) for J/ψ and 0.15 (0.18) for ψ(2S) at √s = 13 (5.02) TeV. 3.3 Acceptance and efficiency corrections
Acceptance and efficiency corrections are obtained using MC simulations by computing the ratio between the num-ber of charmonia reconstructed in the muon spectrometer and the number of generated charmonia in the same ptand yinterval. Independent simulations are performed for J/ψ and ψ(2S) and for each collision energy. Charmonia are generated using input ptand y distributions obtained iter-atively from the data. They are decayed into two muons using EVTGEN [28] and PHOTOS [29] to properly account for the possible emission of accompanying radiative pho-tons. It is assumed that both J/ψ and ψ(2S) are unpolar-ized consistently with the small longitudinal values reported in [7–9] and accounting for further dilution coming from non-prompt charmonia. The decay muons are tracked through a GEANT3 [30] model of the apparatus that includes a
realis-tic description of the detectors and their performance during data taking. Track reconstruction and signal extraction are performed from the simulated hits generated in the detector using the same procedure and selection criteria as those used for the data.
The systematic uncertainty on acceptance and efficiency corrections contains the following contributions: (i) the parametrization of the input ptand y distributions, (ii) the uncertainty on the tracking efficiency in the MCH, (iii) the uncertainty on the MTR efficiency and (iv) the matching between tracks reconstructed in the MCH and tracks in the MTR.
For the parametrization of the MC input distributions, two sources of systematic uncertainty are considered: the corre-lations between ptand y (more explicitly, the fact that the ptdistribution of a given charmonium state varies with the rapidity interval in which it is measured [11]) and the effect of finite statistics in the data used to parametrize these distribu-tions. At √s = 5.02 TeV, both contributions are evaluated by varying the input ptand y distributions within limits that cor-respond to these effects and re-calculating the Aε corrections in each case as done in [13]. This corresponds to a variation of the input yields of at most 15% as a function of y and 50% as a function of pt. For J/ψ measurements at √s = 13 TeV a slightly different approach is adopted in order to further reduce the sensitivity of the simulations to the input ptand ydistributions. It consists in evaluating the acceptance and efficiency corrections in small 2-dimensional bins of y and pt. These corrections are then applied on a dimuon pair-by-pair basis when forming the invariant mass distribution rather than applying them on the total number of measured charmonia in a given (larger) ptand y interval. For each pair the corrections that match its ptand y are used, thus making the resulting Aε-corrected invariant mass distribution largely independent from the ptand y distributions used as input to
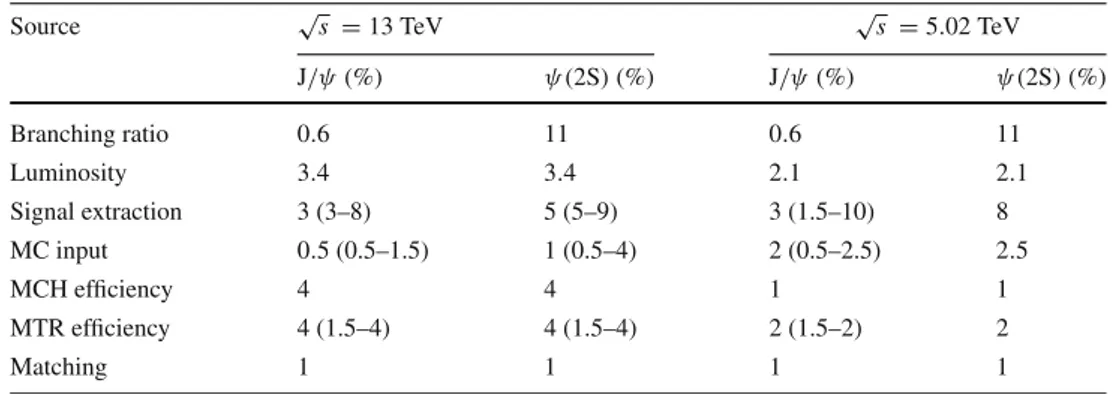
Table 1 Relative systematic
uncertainties associated to the J/ψ and ψ(2S) cross section measurements at √s = 13 and 5.02 TeV. Values in parenthesis correspond to the minimum and maximum values as a function of ptand y. For ψ(2S) at √s = 5.02 TeV, only the pt-integrated values are
reported
Source √s = 13 TeV √s = 5.02 TeV
J/ψ (%) ψ (2S) (%) J/ψ (%) ψ (2S) (%) Branching ratio 0.6 11 0.6 11 Luminosity 3.4 3.4 2.1 2.1 Signal extraction 3 (3–8) 5 (5–9) 3 (1.5–10) 8 MC input 0.5 (0.5–1.5) 1 (0.5–4) 2 (0.5–2.5) 2.5 MCH efficiency 4 4 1 1 MTR efficiency 4 (1.5–4) 4 (1.5–4) 2 (1.5–2) 2 Matching 1 1 1 1
the simulations. For ψ(2S) this improved procedure is not applied because the uncertainties on the measurement are dominated by statistics and the same method as for J/ψ at √s
= 5.02 TeV is used instead.
The other three sources of systematic uncertainty (track-ing efficiency in the MCH, MTR efficiency, and match(track-ing between MTR and MCH tracks) are evaluated using the same procedure as in [13], by comparing data and MC at the single muon level and propagating the observed differences to the dimuon case.
3.4 Summary of the systematic uncertainties
Table1gives a summary of the relative systematic uncertain-ties on the charmonium cross sections measured at √s = 13 and √s = 5.02 TeV. The total systematic uncertainty is the quadratic sum of all the sources listed in this table. The uncer-tainty on the branching ratio is fully correlated between all measurements of a given state. The uncertainty on the inte-grated luminosity is fully correlated between measurements performed at the same √s and considered as uncorrelated from one √s to the other. The uncertainty on the signal extraction is considered as uncorrelated as a function of pt, yand √s , but partially correlated between J/ψ and ψ(2S). Finally, all other sources of uncertainty are considered as partially correlated across measurements at the same energy and uncorrelated from one energy to the other.
The systematic uncertainties on the MTR and MCH effi-ciencies are significantly smaller for the data at √s = 5.02 TeV than at √s = 13 TeV. This is due to the fact that the corresponding data taking period being very short, the detector conditions were more stable and therefore simpler to describe in the simulation.
4 Results
4.1 Cross sections and cross section ratios at √s = 13 and 5.02 TeV
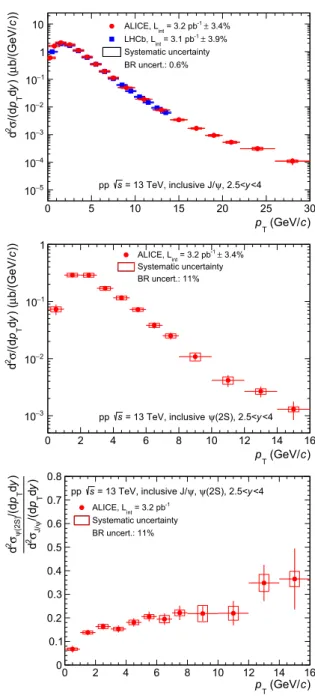
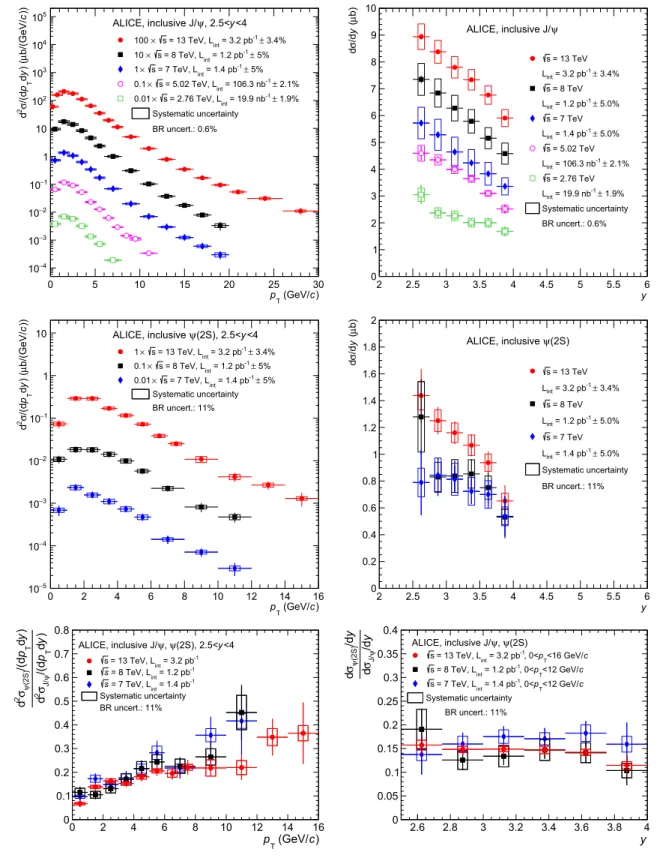
Figure2summarizes the inclusive J/ψ and ψ(2S) cross sec-tions measured by ALICE in pp collisions at √s = 13 TeV
as a function of the charmonium pt(left column) and y (right column). The top row shows the J/ψ cross sections, middle row the ψ(2S) cross sections and bottom row the ψ(2S)-to-J/ψ cross section ratios. In all figures except Figs.5and6, systematic uncertainties are represented by boxes, while ver-tical lines are used for statisver-tical uncertainties.
The J/ψ production cross sections as a function of ptand yare compared to measurements published by LHCb [11] at the same energy. The quoted LHCb values correspond to the sum of the prompt and the non-prompt contributions to the J/ψ production. For the comparison as a function of pt, the provided double-differential ( ptand y) cross sections are summed to match ALICE y coverage. The measurements of the two experiments are consistent within 1σ of their uncer-tainties. The ALICE measurement extends the ptreach from 14 GeV/c to 30 GeV/c with respect to the LHCb results. For the ψ(2S) measurement, no comparisons are performed as this is the only measurement available to date at this energy and y range.
Systematic uncertainties on the signal extraction are reduced when forming the ψ(2S)-to-J/ψ cross section ratios shown in the bottom panels of Fig. 2 due to correla-tions between the numerator and the denominator. All other sources of systematic uncertainties cancel except for the uncertainties on the MC input pt and y parametrizations. Measured ratios show a steady increase as a function of pt and little or no dependence on y within uncertainties. This is also the case at lower √s as it will be discussed in the next section.
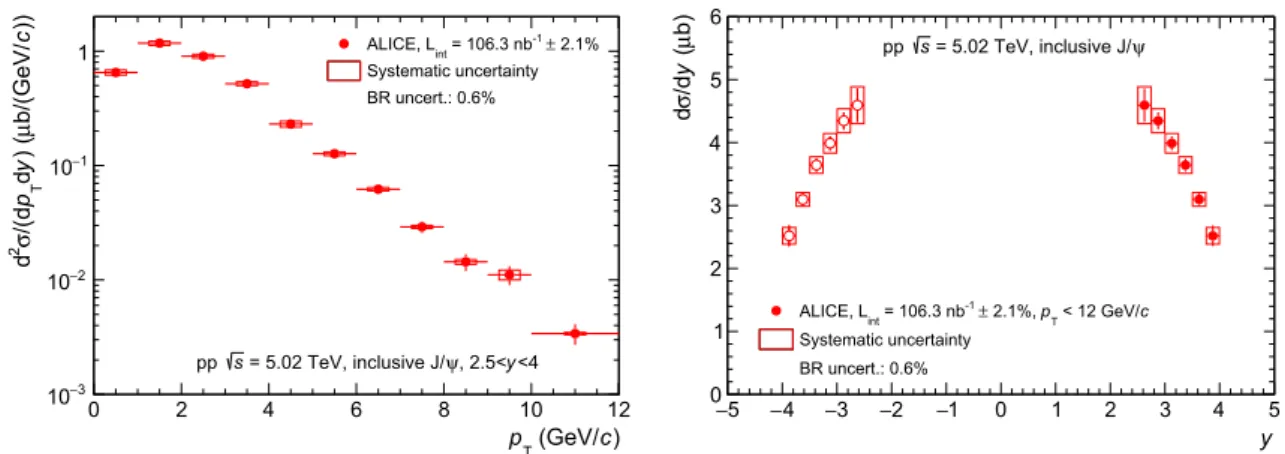
Figure3shows the inclusive J/ψ production cross section measurements performed by ALICE in pp collisions at √s = 5.02 TeV as a function of pt (left) and y (right). The pt -differential cross sections are published in [10] and serve as a reference for the J/ψ nuclear modification factors in Pb–Pb collisions at the same √s . The y-differential cross sections are new to this analysis. Due to the limited integrated luminosity, only the pt- and y-integrated ψ(2S) cross section is measured using this data sample. It is discussed in the next section.
) c (GeV/ T p 0 5 10 15 20 25 30 ))c b/(GeV/µ ) (y d T p /(dσ 2d 5 − 10 4 − 10 3 − 10 2 − 10 1 − 10 1 10 = 3.2 pb-1± 3.4% int ALICE, L 3.9% ± -1 = 3.1 pb int LHCb, L Systematic uncertainty BR uncert.: 0.6% <4 y , 2.5< ψ = 13 TeV, inclusive J/ s pp y 5 − −4 −3 −2 −1 0 1 2 3 4 5 b)µ (y /dσ d 0 2 4 6 8 10 12 c < 30 GeV/ T p 3.4%, ± -1 = 3.2 pb int ALICE, L c < 14 GeV/ T p 3.9%, ± -1 = 3.1 pb int LHCb, L Systematic uncertainty BR uncert.: 0.6% ψ = 13 TeV, inclusive J/ s pp ) c (GeV/ T p 0 2 4 6 8 10 12 14 16 ))c b/(GeV/µ ) (y d T p /(dσ 2d 3 − 10 2 − 10 1 − 10 1 3.4% ± -1 = 3.2 pb int ALICE, L Systematic uncertainty BR uncert.: 11% <4 y (2S), 2.5< ψ = 13 TeV, inclusive s pp y 5 − −4 −3 −2 −1 0 1 2 3 4 5 b)µ (y /dσ d 0 0.2 0.4 0.6 0.8 1 1.2 1.4 1.6 1.8 2 c < 16 GeV/ T p 3.4%, ± -1 = 3.2 pb int ALICE, L Systematic uncertainty BR uncert.: 11% (2S) ψ = 13 TeV, inclusive s pp ) c (GeV/ T p 0 2 4 6 8 10 12 14 16 )y d T p /(dψ J/ σ 2d )y d T p /(d (2S) ψ σ 2d 0 0.1 0.2 0.3 0.4 0.5 0.6 0.7 0.8 -1 = 3.2 pb int ALICE, L Systematic uncertainty BR uncert.: 11% <4 y (2S), 2.5< ψ , ψ = 13 TeV, inclusive J/ s pp y 2.6 2.8 3 3.2 3.4 3.6 3.8 4 y /dψ J/ σd y /d (2S) ψ σd 0 0.05 0.1 0.15 0.2 0.25 0.3 0.35 c <16 GeV/ T p , -1 = 3.2 pb int ALICE, L Systematic uncertainty BR uncert.: 11% (2S) ψ , ψ = 13 TeV, inclusive J/ s pp
Fig. 2 Inclusive J/ψ cross sections (top), ψ(2S) cross sections
(mid-dle) and ψ(2S)-to-J/ψ cross section ratios (bottom) as a function of pt(left) and y (right) in pp collisions at √s = 13 TeV. J/ψ cross
sec-tions are compared to LHCb measurements at the same √s [11]. Open symbolsare the reflection of the positive-y measurements with respect to y= 0
4.2 Comparison to measurements at √s = 2.76, 7 and 8 TeV
In Fig. 4, the cross sections and cross section ratios pre-sented in the previous section are compared to other forward-ymeasurements in pp collisions at √s = 2.76 [12], 7 [13] and 8 TeV [14]. We note that the integrated luminosity used for each measurement increases almost systematically with increasing √s , starting from 19.9 nb−1at √s = 2.76 TeV up to 3.2 pb−1at √s = 13 TeV. This, combined with the
fact that the charmonium cross-section also increases with √s, has allowed to reach increasingly higher values of p
t for both J/ψ and ψ(2S) measurements. For the J/ψ this cor-responds to an increase of the pt reach from 8 GeV/c at √s
= 2.76 TeV up to 30 GeV/c at√s = 13 TeV. For the ψ (2S) the corresponding increase goes from 12 GeV/c at √s
= 7 TeV to 16 GeV/c at√s = 13 TeV.
The J/ψ pt-differential cross section measurements shown in the top-left panel of Fig.4indicate a hardening of the spec-tra with increasing √s . Also, for √s ≥ 7 TeV, a change in
) c (GeV/ T p 0 2 4 6 8 10 12 ))c b/(GeV/µ ) (y d T p /(dσ 2d 3 − 10 2 − 10 1 − 10 1 ALICE, Lint = 106.3 nb-1± 2.1% Systematic uncertainty BR uncert.: 0.6% <4 y , 2.5< ψ = 5.02 TeV, inclusive J/ s pp y 5 − −4 −3 −2 −1 0 1 2 3 4 5 b)µ (y /dσ d 0 1 2 3 4 5 6 c < 12 GeV/ T p 2.1%, ± -1 = 106.3 nb int ALICE, L Systematic uncertainty BR uncert.: 0.6% ψ = 5.02 TeV, inclusive J/ s pp
Fig. 3 Inclusive J/ψ cross sections as function of pt(left) and y (right) in pp collisions at √s = 5.02 TeV. Open symbols are the reflection of the
positive-y measurements with respect to y= 0
the slope of the pt-differential cross section is visible for pt > 10 GeV/c. This change in slope is attributed to the onset of the contribution from non-prompt J/ψ to the inclu-sive cross section as it will be discussed in Sect.4.3.
The corresponding ψ(2S) differential cross section mea-surements are shown in the middle panels of Fig.4. The smaller cross sections with respect to J/ψ result in a smaller ptreach as well as larger statistical uncertainties as a function of both pt(left panel) and y (right panel).
In the bottom panels of Fig.4the measured ψ(2S)-to-J/ψ cross section ratios are compared as a function of pt(left) and y (right) for pp collisions at √s = 7, 8 and 13 TeV. No significant change neither in shape nor magnitude of the ratio is observed among the three energies within the current uncertainties.
To better quantify the hardening of the J/ψ and ψ(2S) ptspectra with increasing √s , a computation of the corre-sponding mean transverse momentum⟨pt⟩ and mean trans-verse momentum square⟨p2t⟩ is performed. This is achieved by fitting the J/ψ and ψ(2S) pt-differential cross sections with the following function:
f ( pt)= C ×! pt 1+"pt
p0
#2$n, (2)
with the parameters C, p0and n left free.
The⟨pt⟩ and ⟨pt2⟩ are then obtained as the first and sec-ond moments of the above function in a given ptrange. The uncertainty on these quantities is evaluated by multiplying the covariance matrix of the fit on each side by the rele-vant Jacobian matrix, evaluated numerically and taking the square root of the result. This is performed either considering separately the statistical and uncorrelated systematic uncer-tainties, or by using their quadratic sum in order to obtain the corresponding statistical, systematic or total uncertainty. A similar approach was adopted in [12].
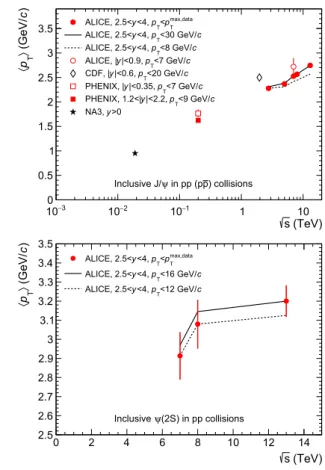
Figure5shows the⟨pt⟩ (left) and ⟨p2t⟩ (right) results for J/ψ (top) and ψ(2S) (bottom). In this figure as well as in Fig.6, the vertical lines correspond to the quadratic sum of the statistical and uncorrelated systematic uncertainties.
For J/ψ at √s = 2.76 TeV the value from [12] is used. At √s = 7 TeV the data from [13] are used instead of the result from [12] because the available integrated luminosity is much larger (×90) and the ptreach increased from 8 to 20 GeV/c. It was checked that both results are consistent when truncated to the same ptrange. At √s = 8 TeV the data from [14] are used, while for √s = 5.02 and 13 TeV the results are from this analysis.
In the top panels of Fig.5, ALICE measurements are com-pared to lower energy results from CDF [31], PHENIX [32] and NA3 [33]. A steady increase of⟨pt⟩ and ⟨p2t⟩ is observed with increasing √s . This is consistent with the expected hardening of the corresponding ptdistributions. Moreover, values at mid- are systematically larger than at forward-rapidity. As discussed in [32], this observation could be attributed to an increase in the longitudinal momentum at forward-rapidity leaving less energy available in the trans-verse plane. The bottom panels of Fig.5show the correspond-ing measurements for ψ(2S) at √s = 7, 8 and 13 TeV. An increase with √s is also observed similar to that of the J/ψ. Part of the increase observed for ALICE measurements shown in all four panels of Fig.5is due to the fact that the ptrange used for evaluating⟨pt⟩ and ⟨p2t⟩, chosen to be the same as in the corresponding data, also increases with √s . To illustrate this effect, these quantities were re-calculated either when truncating the data to the smallest available pt range (0 < pt<8 GeV/c for J/ψ and 0 < pt<12 GeV/c for ψ(2S)) or when using the fit based on Eq.2to extrapolate the data to the largest available range (0 < pt<30 GeV/c for J/ψ and 0 < pt<16 GeV/c for ψ(2S)). The resulting values are shown in the figures as dashed lines for the trun-cation and solid lines for the extrapolation. In all cases the observed increasing trend still holds.
) c (GeV/ T p 0 5 10 15 20 25 30 ))c b/(GeV/µ ) (y d T p /(dσ 2d 4 − 10 3 − 10 2 − 10 1 − 10 1 10 2 10 3 10 4 10 5 10 3.4% ± -1 = 3.2 pb int = 13 TeV, L s × 100 5% ± -1 = 1.2 pb int = 8 TeV, L s × 10 5% ± -1 = 1.4 pb int = 7 TeV, L s × 1 2.1% ± -1 = 106.3 nb int = 5.02 TeV, L s × 0.1 1.9% ± -1 = 19.9 nb int = 2.76 TeV, L s × 0.01 Systematic uncertainty BR uncert.: 0.6% <4 y , 2.5< ψ ALICE, inclusive J/ y 2 2.5 3 3.5 4 4.5 5 5.5 6 b)µ (y /dσ d 0 1 2 3 4 5 6 7 8 9 10 = 13 TeV s 3.4% ± -1 = 3.2 pb int L = 8 TeV s 5.0% ± -1 = 1.2 pb int L = 7 TeV s 5.0% ± -1 = 1.4 pb int L = 5.02 TeV s 2.1% ± -1 = 106.3 nb int L = 2.76 TeV s 1.9% ± -1 = 19.9 nb int L Systematic uncertainty BR uncert.: 0.6% ψ ALICE, inclusive J/ ) c (GeV/ T p 0 2 4 6 8 10 12 14 16 ))c b/(GeV/µ ) (y d T p /(dσ 2d 5 − 10 4 − 10 3 − 10 2 − 10 1 − 10 1 10 3.4% ± -1 = 3.2 pb int = 13 TeV, L s × 1 5% ± -1 = 1.2 pb int = 8 TeV, L s × 0.1 5% ± -1 = 1.4 pb int = 7 TeV, L s × 0.01 Systematic uncertainty BR uncert.: 11% <4 y (2S), 2.5< ψ ALICE, inclusive y 2 2.5 3 3.5 4 4.5 5 5.5 6 b)µ (y /dσ d 0 0.2 0.4 0.6 0.8 1 1.2 1.4 1.6 1.8 2 = 13 TeV s 3.4% ± -1 = 3.2 pb int L = 8 TeV s 5.0% ± -1 = 1.2 pb int L = 7 TeV s 5.0% ± -1 = 1.4 pb int L Systematic uncertainty BR uncert.: 11% (2S) ψ ALICE, inclusive ) c (GeV/ T p 0 2 4 6 8 10 12 14 16 )y d T p /(dψ J/ σ 2d )y d T p /(d (2S) ψ σ 2d 0 0.1 0.2 0.3 0.4 0.5 0.6 0.7 0.8 -1 = 3.2 pb int = 13 TeV, L s -1 = 1.2 pb int = 8 TeV, L s -1 = 1.4 pb int = 7 TeV, L s Systematic uncertainty BR uncert.: 11% <4 y (2S), 2.5< ψ , ψ ALICE, inclusive J/ y 2.6 2.8 3 3.2 3.4 3.6 3.8 4 y /dψ J/ σd y /d (2S) ψ σd 0 0.05 0.1 0.15 0.2 0.25 0.3 0.35 0.4 c <16 GeV/ T p , 0< -1 = 3.2 pb int = 13 TeV, L s c <12 GeV/ T p , 0< -1 = 1.2 pb int = 8 TeV, L s c <12 GeV/ T p , 0< -1 = 1.4 pb int = 7 TeV, L s Systematic uncertainty BR uncert.: 11% (2S) ψ , ψ ALICE, inclusive J/
Fig. 4 Inclusive J/ψ cross sections (top), ψ(2S) cross sections (middle) and ψ(2S)-to-J/ψ cross section ratios (bottom) as function of pt(left)
and y (right) in pp collisions at several values of √s
Finally, Fig.6shows the J/ψ (left) and ψ(2S) (right) pt -and y-integrated inclusive cross sections as a function of √s , measured by ALICE in the y range 2.5 < y < 4. For both
particles a steady increase of dσ/dy is observed as a func-tion of increasing √s . For the J/ψ, the cross secfunc-tions are compared to a calculation done by Nelson, Vogt and Frawley
Fig. 5 ⟨pt⟩ (left) and ⟨p2t⟩ (right) as a function of√s for J/ψ (top)
and ψ(2S) (bottom). Circles correspond to ALICE data, while the other symbolscorrespond to measurements at lower √s . Vertical lines around the data points correspond to the quadratic sum of the statistical and uncorrelated systematic uncertainties. The solid lines correspond
to calculating⟨pt⟩ and ⟨p2
t⟩ when extrapolating the ptcoverage to
the largest available range in ALICE data (0 < pt < 30 GeV/c for J/ψ and 0 < pt < 16 GeV/c for ψ(2S)), while the dashed lines correspond to truncating the data to the smallest ptrange available (0 < pt<8 GeV/c for J/ψ and 0 < pt<12 GeV/c for ψ(2S))
(TeV) s 0 2 4 6 8 10 12 14 b)µ (y /dσ d 0 1 2 3 4 5 6 7 8 9 10 ALICE, BR uncert.: 0.6% CEM, Nelson, Vogt and Frawley
<4 y , 2.5< ψ Inclusive J/ (TeV) s 0 2 4 6 8 10 12 14 b)µ (y /dσ d 0 0.2 0.4 0.6 0.8 1 1.2 1.4 ALICE, BR uncert.: 11% <4 y (2S), 2.5< ψ Inclusive
Fig. 6 J/ψ (left) and ψ(2S) (right) inclusive cross section dσ/dy as a function of √s . Vertical lines correspond to the quadratic sum of the
statistical and uncorrelated systematic uncertainties. J/ψ cross sections are compared to a CEM calculation from [34]
in the CEM framework [34]. While the data and the model are compatible within uncertainties, the data lie on the upper side of the calculation and the difference to the central value becomes larger with increasing √s .
4.3 Comparisons to models
As discussed in the introduction, all ALICE J/ψ and ψ(2S) measurements presented in this paper are inclusive and
con-) c (GeV/ T p 0 5 10 15 20 25 30 ))c b/(GeV/µ ) (y d T p /(dσ 2 d 5 − 10 4 − 10 3 − 10 2 − 10 1 − 10 1 10 = 3.2 pb-1± 3.4% int ALICE, L Systematic uncertainty ) ψ , (prompt J/ et al. NRQCD, Y-Q. Ma ) ψ , (prompt J/ et al. NRQCD + CGC, Y-Q. Ma -from-b) ψ (J/ et al. FONLL, M. Cacciari <4, BR uncert.: 0.6% y , 2.5< ψ = 13 TeV, inclusive J/ s pp ) c (GeV/ T p 0 5 10 15 20 25 30 ))c b/(GeV/µ ) (y d T p /(dσ 2d 5 − 10 4 − 10 3 − 10 2 − 10 1 − 10 1 10 = 3.2 pb-1± 3.4% int ALICE, L Systematic uncertainty ) ψ , (prompt J/ et al. NRQCD, Y-Q. Ma -from-b) ψ , (J/ et al. + FONLL M. Cacciari ) ψ , (prompt J/ et al. NRQCD + CGC, Y-Q. Ma -from-b) ψ , (J/ et al. + FONLL M. Cacciari <4, BR uncert.: 0.6% y , 2.5< ψ = 13 TeV, inclusive J/ s pp
Fig. 7 Left panel J/ψ differential cross sections (red circles) in pp
collisions at √s = 13 TeV compared to NLO NRQCD (grey) [35], LO NRQCD coupled with CGC (blue) [36] and FONLL (red) [37].
Right panelThe non-prompt J/ψ contribution estimated with FONLL is summed to the two calculations for prompt J/ψ production and com-pared to the same data
sist of a prompt and a non-prompt contribution. In order to compare model calculations to the data both contributions must be accounted for. This is illustrated in Fig.7 for the J/ψ production cross section as a function of ptin pp colli-sions at √s = 13 TeV.
In the left panel of Fig. 7, ALICE data are compared to three calculations: (i) in grey to a prompt J/ψ Next-to-Leading-Order (NLO) NRQCD calculation from Ma, Wang and Chao [35], (ii) in blue to a prompt J/ψ Leading Order (LO) NRQCD calculation coupled to a Color Glass Conden-sate (CGC) description of the low-x gluons in the proton from Ma and Venugopalan [36] and (iii) in red to a non-prompt J/ψ Fixed-Order Next-to-Leading Logarithm (FONLL) cal-culation by Cacciari et al. [37].
Both NRQCD prompt J/ψ calculations account for the decay of ψ(2S) and χcinto J/ψ.
For pt < 8 GeV/c where the contribution from non-prompt J/ψ estimated using FONLL is below 10%, the NRQCD+CGC prompt J/ψ calculation reproduces the data reasonably well. For higher pton the other hand, the NLO NRQCD calculation underestimates the measured cross sec-tions and the disagreement increases with increasing pt. This disagreement is explained by the corresponding increase of the non-prompt J/ψ contribution, which according to FONLL, becomes as high as the prompt contribution and even exceeds it for pt >15 GeV/c. This is consistent with the measured non-prompt J/ψ fractions reported by LHCb in [11].
In the right panel of Fig. 7, the NRQCD and FONLL calculations for prompt and non-prompt J/ψ production are summed in order to obtain an ad hoc model of inclusive J/ψ production. The sum is performed separately for the NRQCD+CGC calculation at low ptand the NLO NRQCD at high pt. In both cases, the uncertainties on FONLL and NRQCD are considered as uncorrelated when calculating
the uncertainty band on the sum. This is motivated by the fact that the NRQCD calculations refer to the production of charm quarks and charmed mesons, while the FONLL calculation applies to the production of beauty quarks and b-hadrons which are then decayed into J/ψ mesons. A good description of the data is obtained over the full ptrange and spanning more than four orders of magnitude in the cross sections.
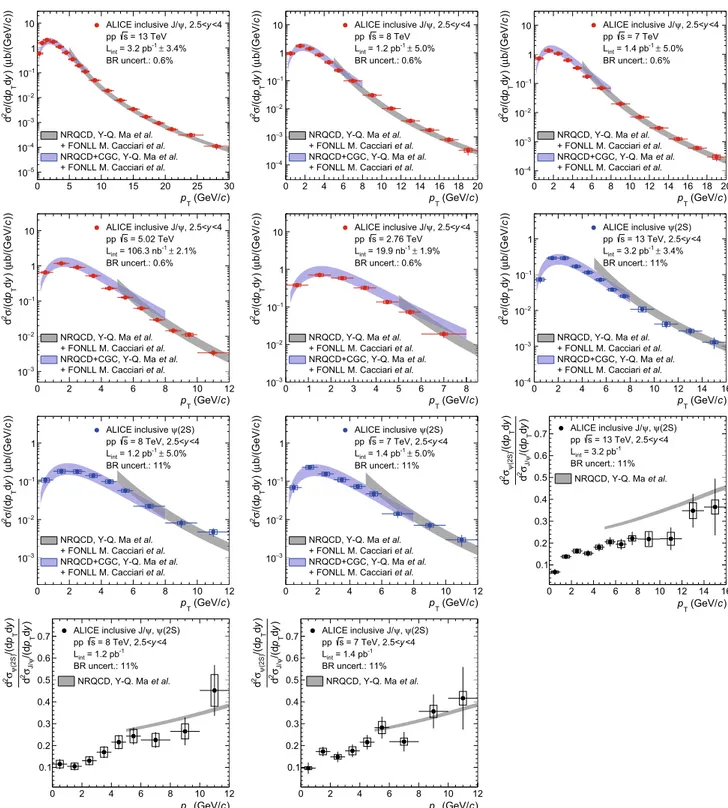
The same groups have also provided NRQCD calculations for inclusive J/ψ production in pp collisions at √s = 8, 7, 5.02 and 2.76 TeV, and for ψ(2S) at √s = 13, 8 and 7 TeV. These calculations are compared to ALICE mea-surements in Fig.8. Also shown in this figure are compar-isons from the high- ptNLO NRQCD calculations to ALICE ψ (2S)-to-J/ψ cross section ratios as a function of pt. The motivation for showing this comparison of the cross sec-tion ratios is that many of the systematic uncertainties cancel both for the data (as discussed in Sect.4.1) and for the the-ory.
Except for the cross section ratios, in all other pan-els the same strategy as in Fig. 7 is applied and the non-prompt contribution to inclusive charmonium production is added to the model using FONLL before comparing to the data. The FONLL+NRQCD summation is not performed for ψ (2S)-to-J/ψ cross section ratios due to the added com-plexity introduced by the estimation of the error cancella-tion between the models. Moreover, the impact of the non-prompt charmonium contribution on these ratios is expected to be small because it enters both the numerator and the denominator with a similar magnitude (according to FONLL) and largely cancels out. We note that similar high- ptNLO NRQCD calculations [38] were already compared to ALICE J/ψ and ψ(2S) cross sections at √s = 7 TeV in [13], albeit with a different strategy to account for the non-prompt charmonia.
) c (GeV/ T p 0 5 10 15 20 25 30 ))c b/(GeV/µ ) (y dT p /(dσ 2d 5 − 10 4 − 10 3 − 10 2 − 10 1 − 10 1 10 ALICE inclusive J/ψ, 2.5<y<4 = 13 TeV s pp 3.4% ± -1 = 3.2 pb int L BR uncert.: 0.6% et al. NRQCD, Y-Q. Ma et al. + FONLL M. Cacciari et al. NRQCD+CGC, Y-Q. Ma et al. + FONLL M. Cacciari ) c (GeV/ T p 0 2 4 6 8 10 12 14 16 18 20 ))c b/(GeV/µ ) (y dT p /(dσ 2d 4 − 10 3 − 10 2 − 10 1 − 10 1 10 ALICE inclusive J/ψ, 2.5<y<4 = 8 TeV s pp 5.0% ± -1 = 1.2 pb int L BR uncert.: 0.6% et al. NRQCD, Y-Q. Ma et al. + FONLL M. Cacciari et al. NRQCD+CGC, Y-Q. Ma et al. + FONLL M. Cacciari ) c (GeV/ T p 0 2 4 6 8 10 12 14 16 18 20 ))c b/(GeV/µ ) (y dT p /(dσ 2d 4 − 10 3 − 10 2 − 10 1 − 10 1 10 ALICE inclusive J/ψ, 2.5<y<4 = 7 TeV s pp 5.0% ± -1 = 1.4 pb int L BR uncert.: 0.6% et al. NRQCD, Y-Q. Ma et al. + FONLL M. Cacciari et al. NRQCD+CGC, Y-Q. Ma et al. + FONLL M. Cacciari ) c (GeV/ T p 0 2 4 6 8 10 12 ))c b/(GeV/µ ) (y dT p /(dσ 2d 3 − 10 2 − 10 1 − 10 1 10 ALICE inclusive J/ψ, 2.5<y<4 = 5.02 TeV s pp 2.1% ± -1 = 106.3 nb int L BR uncert.: 0.6% et al. NRQCD, Y-Q. Ma et al. + FONLL M. Cacciari et al. NRQCD+CGC, Y-Q. Ma et al. + FONLL M. Cacciari ) c (GeV/ T p 0 1 2 3 4 5 6 7 8 ))c b/(GeV/µ ) (y dT p /(dσ 2d 3 − 10 2 − 10 1 − 10 1 10 ALICE inclusive J/ψ, 2.5<y<4 = 2.76 TeV s pp 1.9% ± -1 = 19.9 nb int L BR uncert.: 0.6% et al. NRQCD, Y-Q. Ma et al. + FONLL M. Cacciari et al. NRQCD+CGC, Y-Q. Ma et al. + FONLL M. Cacciari ) c (GeV/ T p 0 2 4 6 8 10 12 14 16 ))c b/(GeV/µ ) (y dT p /(dσ 2d 4 − 10 3 − 10 2 − 10 1 − 10 1 (2S) ψ ALICE inclusive <4 y = 13 TeV, 2.5< s pp 3.4% ± -1 = 3.2 pb int L BR uncert.: 11% et al. NRQCD, Y-Q. Ma et al. + FONLL M. Cacciari et al. NRQCD+CGC, Y-Q. Ma et al. + FONLL M. Cacciari ) c (GeV/ T p 0 2 4 6 8 10 12 ))c b/(GeV/µ ) (y dT p /(dσ 2d 3 − 10 2 − 10 1 − 10 1 (2S) ψ ALICE inclusive <4 y = 8 TeV, 2.5< s pp 5.0% ± -1 = 1.2 pb int L BR uncert.: 11% et al. NRQCD, Y-Q. Ma et al. + FONLL M. Cacciari et al. NRQCD+CGC, Y-Q. Ma et al. + FONLL M. Cacciari ) c (GeV/ T p 0 2 4 6 8 10 12 ))c b/(GeV/µ ) (y dT p /(dσ 2d 3 − 10 2 − 10 1 − 10 1 (2S) ψ ALICE inclusive <4 y = 7 TeV, 2.5< s pp 5.0% ± -1 = 1.4 pb int L BR uncert.: 11% et al. NRQCD, Y-Q. Ma et al. + FONLL M. Cacciari et al. NRQCD+CGC, Y-Q. Ma et al. + FONLL M. Cacciari ) c (GeV/ T p 0 2 4 6 8 10 12 14 16 )y dT p /(dψ J/ σ 2d )y d T p /(d (2S) ψ σ 2d 0.1 0.2 0.3 0.4 0.5 0.6
0.7 ALICE inclusive J/pp s = 13 TeV, 2.5<ψ,yψ<4(2S) -1 = 3.2 pb int L BR uncert.: 11% et al. NRQCD, Y-Q. Ma ) c (GeV/ T p 0 2 4 6 8 10 12 )y dT p /(dψ J/ σ 2d )y d T p /(d (2S) ψ σ 2d 0.1 0.2 0.3 0.4 0.5 0.6
0.7 ALICE inclusive J/pp s = 8 TeV, 2.5<ψy,ψ<4(2S) -1 = 1.2 pb int L BR uncert.: 11% et al. NRQCD, Y-Q. Ma ) c (GeV/ T p 0 2 4 6 8 10 12 )y dT p /(dψ J/ σ 2d )y dT p /(d (2S) ψ σ 2d 0.1 0.2 0.3 0.4 0.5 0.6
0.7 ALICE inclusive J/pp s = 7 TeV, 2.5<ψy,ψ<4(2S) -1 = 1.4 pb int L BR uncert.: 11% et al. NRQCD, Y-Q. Ma
Fig. 8 Comparisons between ALICE J/ψ and ψ(2S) data and summed
NRQCD and FONLL model calculations from [35–37]. The first five panels correspond to inclusive J/ψ production cross sections as a func-tion of ptin pp collisions at √s = 13, 8, 7, 5.02 and 2.76 TeV (red), the
next three panels to inclusive ψ(2S) cross sections as a function of ptat √s = 13, 8 and 7 TeV (blue) and the last three panels to ψ(2S)-to-J/ψ cross section ratios as a function of ptat the same √s (black)
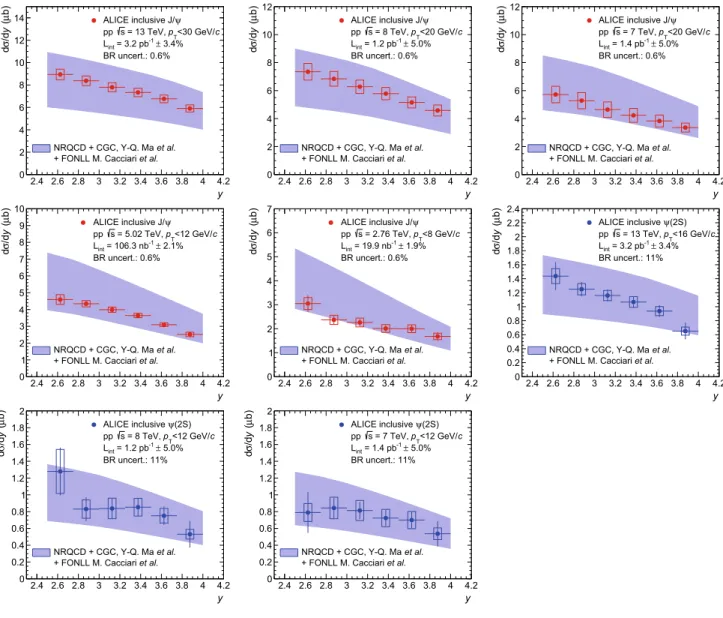
Since the NRQCD+CGC calculation from [36] extends down to zero pt, it can be integrated over ptand directly compared to ALICE pt-integrated cross sections as a func-tion of y. This calculafunc-tion neglects the contribufunc-tion from
charmonium with pt > 8 GeV/c to the total cross sec-tion, which anyway contributes by less than 3%. The results of this comparison as a function of y are shown in Fig.9.
y 2.4 2.6 2.8 3 3.2 3.4 3.6 3.8 4 4.2 b)µ (y /dσ d 0 2 4 6 8 10 12 14 ALICE inclusive J/ψ c <30 GeV/ T p = 13 TeV, s pp 3.4% ± -1 = 3.2 pb int L BR uncert.: 0.6% et al. NRQCD + CGC, Y-Q. Ma et al. + FONLL M. Cacciari y 2.4 2.6 2.8 3 3.2 3.4 3.6 3.8 4 4.2 b)µ (y /dσ d 0 2 4 6 8 10 12 ψ ALICE inclusive J/ c <20 GeV/ T p = 8 TeV, s pp 5.0% ± -1 = 1.2 pb int L BR uncert.: 0.6% et al. NRQCD + CGC, Y-Q. Ma et al. + FONLL M. Cacciari y 2.4 2.6 2.8 3 3.2 3.4 3.6 3.8 4 4.2 b)µ (y /dσ d 0 2 4 6 8 10 12 ψ ALICE inclusive J/ c <20 GeV/ T p = 7 TeV, s pp 5.0% ± -1 = 1.4 pb int L BR uncert.: 0.6% et al. NRQCD + CGC, Y-Q. Ma et al. + FONLL M. Cacciari y 2.4 2.6 2.8 3 3.2 3.4 3.6 3.8 4 4.2 b)µ (y /dσ d 0 1 2 3 4 5 6 7 8 9 10 ψ ALICE inclusive J/ c <12 GeV/ T p = 5.02 TeV, s pp 2.1% ± -1 = 106.3 nb int L BR uncert.: 0.6% et al. NRQCD + CGC, Y-Q. Ma et al. + FONLL M. Cacciari y 2.4 2.6 2.8 3 3.2 3.4 3.6 3.8 4 4.2 b)µ (y /dσ d 0 1 2 3 4 5 6 7 ψ ALICE inclusive J/ c <8 GeV/ T p = 2.76 TeV, s pp 1.9% ± -1 = 19.9 nb int L BR uncert.: 0.6% et al. NRQCD + CGC, Y-Q. Ma et al. + FONLL M. Cacciari y 2.4 2.6 2.8 3 3.2 3.4 3.6 3.8 4 4.2 b)µ (y /dσ d 0 0.2 0.4 0.6 0.8 1 1.2 1.4 1.6 1.8 2 2.2 2.4 (2S) ψ ALICE inclusive c <16 GeV/ T p = 13 TeV, s pp 3.4% ± -1 = 3.2 pb int L BR uncert.: 11% et al. NRQCD + CGC, Y-Q. Ma et al. + FONLL M. Cacciari y 2.4 2.6 2.8 3 3.2 3.4 3.6 3.8 4 4.2 b)µ (y /dσ d 0 0.2 0.4 0.6 0.8 1 1.2 1.4 1.6 1.8 2 (2S) ψ ALICE inclusive c <12 GeV/ T p = 8 TeV, s pp 5.0% ± -1 = 1.2 pb int L BR uncert.: 11% et al. NRQCD + CGC, Y-Q. Ma et al. + FONLL M. Cacciari y 2.4 2.6 2.8 3 3.2 3.4 3.6 3.8 4 4.2 b)µ (y /dσ d 0 0.2 0.4 0.6 0.8 1 1.2 1.4 1.6 1.8 2 (2S) ψ ALICE inclusive c <12 GeV/ T p = 7 TeV, s pp 5.0% ± -1 = 1.4 pb int L BR uncert.: 11% et al. NRQCD + CGC, Y-Q. Ma et al. + FONLL M. Cacciari
Fig. 9 Comparisons between ALICE J/ψ and ψ(2S) data and summed
NRQCD and FONLL model calculations from [36,37]. The first five panels correspond to inclusive J/ψ production cross sections as a
func-tion of y in pp collisions at √s = 13, 8 and 7, 5.02 and 2.76 TeV (red), while the next three panels to inclusive ψ(2S) cross sections as a function of y at √s = 13, 8 and 7 TeV (blue)
Overall, a good agreement between the model and the data is observed for all measured cross sections, for both J/ψ and ψ (2S) as a function of either ptor y and for all the collision energies considered. For ψ(2S)-to-J/ψ cross section ratios as a function of pthowever, the model tends to be slightly above the data especially at √s = 13 TeV. This tension appears mainly because of the error cancellation between the uncertainties on the J/ψ and ψ(2S) cross sections mentioned above.
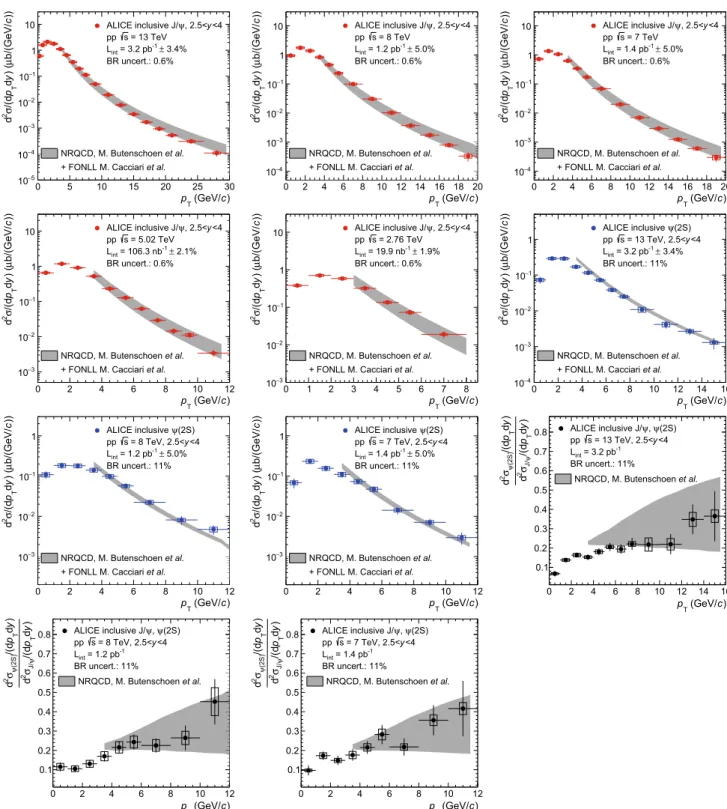
In Fig. 10, the ALICE measurements are compared to a second set of NLO NRQCD calculations from Buten-schön and Kniehl [39]. In this case only high- ptcalculations ( pt > 3 GeV/c) are available. The ALICE pt-integrated cross sections as a function of y cannot be thus compared to the theory due to this ptcut. As was the case for the
compar-isons shown in Figs.8and9, FONLL is used to estimate the contribution from non-prompt charmonium production and added to the NRQCD calculation.
The two NLO NRQCD calculations from Butenschön and Kniehl (Fig.10) and from Ma, Wang and Chao (Fig.8) differ in the parametrization of the Long Distance Matrix Elements (LDME) used to calculate the color-octet contributions to the charmonium production cross section. The first calcu-lation uses three matrix elements whereas the second uses only two linear combinations of these three elements. Other differences include: the data sets used to fit these matrix ele-ments, the minimum ptabove which the calculation is appli-cable and the way by which contributions from χcand ψ(2S)
) c (GeV/ T p 0 5 10 15 20 25 30 ))c b/(GeV/µ ) (y dT p /(dσ 2d 5 − 10 4 − 10 3 − 10 2 − 10 1 − 10 1 10 ALICE inclusive J/ψ, 2.5<y<4 = 13 TeV s pp 3.4% ± -1 = 3.2 pb int L BR uncert.: 0.6% et al. NRQCD, M. Butenschoen et al. + FONLL M. Cacciari ) c (GeV/ T p 0 2 4 6 8 10 12 14 16 18 20 ))c b/(GeV/µ ) (y dT p /(dσ 2d 4 − 10 3 − 10 2 − 10 1 − 10 1 10 ALICE inclusive J/ψ, 2.5<y<4 = 8 TeV s pp 5.0% ± -1 = 1.2 pb int L BR uncert.: 0.6% et al. NRQCD, M. Butenschoen et al. + FONLL M. Cacciari ) c (GeV/ T p 0 2 4 6 8 10 12 14 16 18 20 ))c b/(GeV/µ ) (y dT p /(dσ 2d 4 − 10 3 − 10 2 − 10 1 − 10 1 10 ALICE inclusive J/ψ, 2.5<y<4 = 7 TeV s pp 5.0% ± -1 = 1.4 pb int L BR uncert.: 0.6% et al. NRQCD, M. Butenschoen et al. + FONLL M. Cacciari ) c (GeV/ T p 0 2 4 6 8 10 12 ))c b/(GeV/µ ) (y dT p /(dσ 2d 3 − 10 2 − 10 1 − 10 1 10 ALICE inclusive J/ψ, 2.5<y<4 = 5.02 TeV s pp 2.1% ± -1 = 106.3 nb int L BR uncert.: 0.6% et al. NRQCD, M. Butenschoen et al. + FONLL M. Cacciari ) c (GeV/ T p 0 1 2 3 4 5 6 7 8 ))c b/(GeV/µ ) (y dT p /(dσ 2d 3 − 10 2 − 10 1 − 10 1 10 ALICE inclusive J/ψ, 2.5<y<4 = 2.76 TeV s pp 1.9% ± -1 = 19.9 nb int L BR uncert.: 0.6% et al. NRQCD, M. Butenschoen et al. + FONLL M. Cacciari ) c (GeV/ T p 0 2 4 6 8 10 12 14 16 ))c b/(GeV/µ ) (y dT p /(dσ 2d 4 − 10 3 − 10 2 − 10 1 − 10 1 (2S) ψ ALICE inclusive <4 y = 13 TeV, 2.5< s pp 3.4% ± -1 = 3.2 pb int L BR uncert.: 11% et al. NRQCD, M. Butenschoen et al. + FONLL M. Cacciari ) c (GeV/ T p 0 2 4 6 8 10 12 ))c b/(GeV/µ ) (y dT p /(dσ 2d 3 − 10 2 − 10 1 − 10
1 ALICE inclusive pp s = 8 TeV, 2.5<ψ(2S)y<4
5.0% ± -1 = 1.2 pb int L BR uncert.: 11% et al. NRQCD, M. Butenschoen et al. + FONLL M. Cacciari ) c (GeV/ T p 0 2 4 6 8 10 12 ))c b/(GeV/µ ) (y dT p /(dσ 2d 3 − 10 2 − 10 1 − 10
1 ALICE inclusive pp s = 7 TeV, 2.5<ψ(2S)y<4
5.0% ± -1 = 1.4 pb int L BR uncert.: 11% et al. NRQCD, M. Butenschoen et al. + FONLL M. Cacciari ) c (GeV/ T p 0 2 4 6 8 10 12 14 16 )y dT p /(dψ J/ σ 2d )y d T p /(d (2S) ψ σ 2d 0.1 0.2 0.3 0.4 0.5 0.6 0.7 0.8 ALICE inclusive J/ψ,ψ(2S) <4 y = 13 TeV, 2.5< s pp -1 = 3.2 pb int L BR uncert.: 11% et al. NRQCD, M. Butenschoen ) c (GeV/ T p 0 2 4 6 8 10 12 )y dT p /(dψ J/ σ 2d )y d T p /(d (2S) ψ σ 2d 0.1 0.2 0.3 0.4 0.5 0.6 0.7 0.8 ALICE inclusive J/ψ,ψ(2S) <4 y = 8 TeV, 2.5< s pp -1 = 1.2 pb int L BR uncert.: 11% et al. NRQCD, M. Butenschoen ) c (GeV/ T p 0 2 4 6 8 10 12 )y dT p /(dψ J/ σ 2d )y dT p /(d (2S) ψ σ 2d 0.1 0.2 0.3 0.4 0.5 0.6 0.7 0.8 ALICE inclusive J/ψ,ψ(2S) <4 y = 7 TeV, 2.5< s pp -1 = 1.4 pb int L BR uncert.: 11% et al. NRQCD, M. Butenschoen
Fig. 10 Comparisons between ALICE J/ψ and ψ(2S) data and
summed NRQCD and FONLL model calculations from [37,39]. The first five panels correspond to inclusive J/ψ production cross sections as a function of ptin pp collisions at √s = 13, 8, 7, 5.02 and 2.76 TeV
(red), the next three panels to inclusive ψ(2S) cross sections as a func-tion of ptat √s = 13, 8 and 7 TeV (blue) and the last three panels to ψ (2S)-to-J/ψ cross section ratios as a function of ptat the same √s (black)
Although the agreement between the model and the data is of similar quality in Fig.8and10, some differences are visible. In particular, in Fig.10, the calculation tends to
over-estimate the measured J/ψ cross sections towards high- pt and the uncertainties are larger than in Fig. 8. The uncer-tainties on the ψ(2S)-to-J/ψ cross section ratios are also
significantly larger and consequently the agreement to the data is better. These observations are a consequence of the differences between the two calculations detailed above and in particular the fact that the fits of the LDME start at a lower ptand include a larger number of data sets in the second case.
5 Conclusions
The inclusive J/ψ and ψ(2S) differential cross sections as well as ψ(2S)-to-J/ψ cross section ratios as a function of pt and y have been measured in pp collisions at √s = 5.02 and 13 TeV with the ALICE detector. Combined with similar measurements performed at √s = 2.76 [12], 7 [13] and 8 TeV [14], these results constitute a stringent test for models of charmonium production and allow the study of quantities such as⟨pt⟩, ⟨p2t⟩ and pt-integrated dσ/dy as a function of √s.
The results at √s =13 TeV significantly extend the pt reach for both charmonium states with respect to measure-ments performed by ALICE at lower energies, up to 30 GeV/c for the J/ψ and 16 GeV/c for the ψ(2S). When comparing the J/ψ cross sections vs ptto measurements at lower √s , a hardening of the spectra is observed with increasing collision energy. This is confirmed by measurements of the J/ψ⟨pt⟩ and⟨p2
t⟩, while a similar trend is observed for the ψ(2S). Regarding inclusive ψ(2S)-to-J/ψ cross section ratios, no √s dependence is observed within uncertainties.
Comparisons of J/ψ and ψ(2S) cross sections and cross section ratios as a function of both ptand y to NLO NRQCD and LO NRQCD+CGC prompt-charmonium calculations have been presented for all available collision energies. Con-cerning the J/ψ cross section as a function of pt, an excellent agreement is observed between data and theory, provided that the non-prompt contribution to the inclusive cross section is included using FONLL. This comparison indicates that for pt>15 GeV/c, the non-prompt contribution can reach up to 50%. An overall good agreement is also observed for ψ(2S) production and for the cross sections as a function of y albeit with larger uncertainties.
With the large contribution from non-prompt J/ψ to the inclusive cross sections observed for high ptat √s= 13 TeV, it is of relatively little interest to try to further extend the pt reach of the inclusive measurement for understanding char-monium production. This is as long as one is not capable of separating experimentally the prompt and the non-prompt contributions and relies on models instead. This separation will become possible in ALICE starting from 2021 with the addition of the Muon Forward Tracker [40].
Acknowledgements The ALICE Collaboration would like to thank
Mathias Butenschön, Matteo Cacciari, Yan-Qing Ma and Ramona Vogt
for providing the NRQCD, FONLL and CEM calculations used in this paper. The ALICE Collaboration would like to thank all its engineers and technicians for their invaluable contributions to the construction of the experiment and the CERN accelerator teams for the outstanding performance of the LHC complex. The ALICE Collaboration gratefully acknowledges the resources and support provided by all Grid centres and the Worldwide LHC Computing Grid (WLCG) collaboration. The ALICE Collaboration acknowledges the following funding agencies for their support in building and running the ALICE detector: A. I. Alikhanyan National Science Laboratory (Yerevan Physics Institute) Foundation (ANSL), State Committee of Science and World Federa-tion of Scientists (WFS), Armenia; Austrian Academy of Sciences and Nationalstiftung für Forschung, Technologie und Entwicklung, Austria; Ministry of Communications and High Technologies, National Nuclear Research Center, Azerbaijan; Conselho Nacional de Desenvolvimento Científico e Tecnológico (CNPq), Universidade Federal do Rio Grande do Sul (UFRGS), Financiadora de Estudos e Projetos (Finep) and Fun-dação de Amparo à Pesquisa do Estado de São Paulo (FAPESP), Brazil; Ministry of Science and Technology of China (MSTC), National Natu-ral Science Foundation of China (NSFC) and Ministry of Education of China (MOEC), China; Ministry of Science, Education and Sport and Croatian Science Foundation, Croatia; Ministry of Education, Youth and Sports of the Czech Republic, Czech Republic; The Danish Coun-cil for Independent Research | Natural Sciences, the Carlsberg Foun-dation and Danish National Research FounFoun-dation (DNRF), Denmark; Helsinki Institute of Physics (HIP), Finland; Commissariat à l’Energie Atomique (CEA) and Institut National de Physique Nucléaire et de Physique des Particules (IN2P3) and Centre National de la Recherche Scientifique (CNRS), France; Bundesministerium für Bildung, Wis-senschaft, Forschung und Technologie (BMBF) and GSI Helmholtzzen-trum für Schwerionenforschung GmbH, Germany; Ministry of Edu-cation, Research and Religious Affairs, Greece; National Research, Development and Innovation Office, Hungary; Department of Atomic Energy Government of India (DAE) and Council of Scientific and Indus-trial Research (CSIR), New Delhi, India; Indonesian Institute of Sci-ence, Indonesia; Centro Fermi - Museo Storico della Fisica e Centro Studi e Ricerche Enrico Fermi and Istituto Nazionale di Fisica Nucle-are (INFN), Italy; Institute for Innovative Science and Technology, Nagasaki Institute of Applied Science (IIST), Japan Society for the Promotion of Science (JSPS) KAKENHI and Japanese Ministry of Edu-cation, Culture, Sports, Science and Technology (MEXT), Japan; Con-sejo Nacional de Ciencia (CONACYT) y Tecnología, through Fondo de Cooperación Internacional en Ciencia y Tecnología (FONCICYT) and Dirección General de Asuntos del Personal Academico (DGAPA), Mexico; Nationaal instituut voor subatomaire fysica (Nikhef), Nether-lands; The Research Council of Norway, Norway; Commission on Sci-ence and Technology for Sustainable Development in the South (COM-SATS), Pakistan; Pontificia Universidad Católica del Perú, Peru; Min-istry of Science and Higher Education and National Science Centre, Poland; Korea Institute of Science and Technology Information and National Research Foundation of Korea (NRF), Republic of Korea; Ministry of Education and Scientific Research, Institute of Atomic Physics and Romanian National Agency for Science, Technology and Innovation, Romania; Joint Institute for Nuclear Research (JINR), Min-istry of Education and Science of the Russian Federation and National Research Centre Kurchatov Institute, Russia; Ministry of Education, Science, Research and Sport of the Slovak Republic, Slovakia; National Research Foundation of South Africa, South Africa; Centro de Aplica-ciones Tecnológicas y Desarrollo Nuclear (CEADEN), Cubaenergía, Cuba, Ministerio de Ciencia e Innovacion and Centro de Investi-gaciones Energéticas, Medioambientales y Tecnológicas (CIEMAT), Spain; Swedish Research Council (VR) and Knut and Alice Wallen-berg Foundation (KAW), Sweden; European Organization for Nuclear Research, Switzerland; National Science and Technology Develop-ment Agency (NSDTA), Suranaree University of Technology (SUT) and Office of the Higher Education Commission under NRU project of
Thailand, Thailand; Turkish Atomic Energy Agency (TAEK), Turkey; National Academy of Sciences of Ukraine, Ukraine; Science and Tech-nology Facilities Council (STFC), United Kingdom; National Science Foundation of the United States of America (NSF) and United States Department of Energy, Office of Nuclear Physics (DOE NP), United States of America.
Open Access This article is distributed under the terms of the Creative
Commons Attribution 4.0 International License (http://creativecomm
ons.org/licenses/by/4.0/), which permits unrestricted use, distribution,
and reproduction in any medium, provided you give appropriate credit to the original author(s) and the source, provide a link to the Creative Commons license, and indicate if changes were made.
Funded by SCOAP3.
References
1. N. Brambilla et al., Heavy quarkonium: progress, puzzles, and opportunities. Eur. Phys. J. C 71, 1534 (2011). doi:10.1140/epjc/
s10052-010-1534-9.arXiv:1010.5827[hep-ph]
2. A. Andronic et al., Heavy-flavour and quarkonium production in the LHC era: from proton–proton to heavy-ion collisions. Eur. Phys. J. C 76(3), 107 (2016). doi:10.1140/epjc/s10052-015-3819-5.
arXiv:1506.03981[nucl-ex]
3. H. Fritzsch, Producing heavy quark flavors in hadronic collisions: a test of quantum chromodynamics. Phys. Lett. B 67, 217–221 (1977). doi:10.1016/0370-2693(77)90108-3
4. J.F. Amundson, O.J.P. Eboli, E.M. Gregores, F. Halzen, Quantita-tive tests of color evaporation: charmonium production. Phys. Lett. B 390, 323–328 (1997). doi:10.1016/S0370-2693(96)01417-7.
arXiv:hep-ph/9605295[hep-ph]
5. R. Baier, R. Ruckl, Hadronic production of J/ψ and upsilon: trans-verse momentum distributions. Phys. Lett. B 102, 364–370 (1981).
doi:10.1016/0370-2693(81)90636-5
6. G.T. Bodwin, E. Braaten, G.P. Lepage, Rigorous QCD analysis of inclusive annihilation and production of heavy quarkonium. Phys. Rev. D 51, 1125–1171 (1995). doi:10.1103/PhysRevD.51.1125.
arXiv:hep-ph/9407339[hep-ph] [Erratum: Phys. Rev. D 55, 5853
(1997). doi:10.1103/PhysRevD.55.5853]
7. ALICE Collaboration, B. Abelev et al., J/ψ polarization in pp collisions at √s = 7 TeV. Phys. Rev. Lett. 108, 082001 (2012).
doi:10.1103/PhysRevLett.108.082001.arXiv:1111.1630[hep-ex]
8. LHCb Collaboration, R. Aaij et al., Measurement of J/ψ polariza-tion in pp collisions at √s= 7 TeV. Eur. Phys. J. C 73, 2631 (2013).
doi:10.1140/epjc/s10052-013-2631-3.arXiv:1307.6379[hep-ex]
9. LHCb Collaboration, R. Aaij et al., Measurement of ψ(2S) polar-isation in pp collisions at √s= 7 TeV. Eur. Phys. J. C 74(5), 2872 (2014). doi:10.1140/epjc/s10052-014-2872-9. arXiv:1403.1339
[hep-ex]
10. ALICE Collaboration, J. Adam et al., J/ψ suppression at for-ward rapidity in Pb–Pb collisions at√sNN= 5.02 TeV. Phys.
Lett. B 766, 212–224 (2017). doi:10.1016/j.physletb.2016.12.064.
arXiv:1606.08197[nucl-ex]
11. LHCb Collaboration, R. Aaij et al., Measurement of forward J/ψ production cross-sections in pp collisions at √s = 13 TeV. JHEP 10, 172 (2015). doi:10.1007/JHEP10(2015)172.
arXiv:1509.00771 [hep-ex]. [Erratum: JHEP 05, 063 (2017).
doi:10.1007/JHEP05(2017)063]
12. ALICE Collaboration, B. Abelev et al., Inclusive J/ψ produc-tion in pp collisions at √s= 2.76 TeV. Phys. Lett. B 718, 295– 306 (2012). doi:10.1016/j.physletb.2012.10.078.arXiv:1203.3641
[hep-ex]. [Erratum: Phys. Lett. B 748, 472 (2015). doi:10.1016/j.
physletb.2015.06.058]
13. ALICE Collaboration, B.B. Abelev et al., Measurement of quarko-nium production at forward rapidity in pp collisions at √s = 7 TeV. Eur. Phys. J. C 74(8), 2974 (2014). doi:10.1140/epjc/
s10052-014-2974-4.arXiv:1403.3648[nucl-ex]
14. ALICE Collaboration, J. Adam et al., Inclusive quarkonium production at forward rapidity in pp collisions at √s = 8 TeV. Eur. Phys. J. C 76(4), 184 (2016). doi:10.1140/epjc/
s10052-016-3987-y.arXiv:1509.08258[hep-ex]
15. J.P. Lansberg, J/ψ production at sqrt(s)= 1.96 and 7 TeV: color-singlet model, NNLO* and polarisation. J. Phys. G 38, 124110 (2011). doi:10.1088/0954-3899/38/12/124110. arXiv:1107.0292
[hep-ph]
16. ALICE Collaboration, K. Aamodt et al., The ALICE experi-ment at the CERN LHC. JINST 3, S08002 (2008). doi:10.1088/ 1748-0221/3/08/S08002
17. ALICE Collaboration, B. Abelev et al., Performance of the ALICE experiment at the CERN LHC. Int. J. Mod. Phys. A 29, 1430044 (2014).arXiv:1402.4476[nucl-ex]
18. ALICE Collaboration, K. Aamodt et al., Rapidity and transverse momentum dependence of inclusive J/ψ production in pp colli-sions at √s= 7 TeV. Phys. Lett. B 704, 442–455 (2011). doi:10.
1016/j.physletb.2011.09.054. arXiv:1105.0380 [hep-ex].
[Erra-tum: Phys. Lett. B 718, 692 (2012). doi:10.1016/j.physletb.2012.
10.060]
19. ALICE Collaboration, K. Aamodt et al., Alignment of the ALICE inner tracking system with cosmic-ray tracks. JINST 5, P03003 (2010). doi:10.1088/1748-0221/5/03/P03003. arXiv:1001.0502
[physics.ins-det]
20. ALICE Collaboration, E. Abbas et al., Performance of the ALICE VZERO system. JINST 8, P10016 (2013). doi:10.1088/
1748-0221/8/10/P10016.arXiv:1306.3130[nucl-ex]
21. M. Bondila et al., ALICE T0 detector. IEEE Trans. Nucl. Sci. 52, 1705–1711 (2005). doi:10.1109/TNS.2005.856900
22. ALICE Collaboration, F. Bossù, M. Gagliardi, M. Marchisone, Performance of the RPC-based ALICE muon trigger system at the LHC. J. Instrum. 7(12), T12002 (2012).http://stacks.iop.org/ 1748-0221/7/i=12/a=T12002
23. ALICE Collaboration, ALICE luminosity determination for pp col-lisions at √s = 13 TeV. ALICE-PUBLIC-2016-002.https://cds. cern.ch/record/2160174
24. ALICE Collaboration, ALICE luminosity determination for pp col-lisions at √s = 5 TeV. ALICE-PUBLIC-2016-005.https://cds. cern.ch/record/2202638
25. S. van der Meer, Calibration of the effective beam height in the ISR. CERN-ISR-PO-68-31 (1968).https://cds.cern.ch/record/296752
26. Particle Data Group Collaboration, C. Patrignani et al., Review of particle physics. Chin. Phys. C 40(10), 100001 (2016)
27. ALICE Collaboration, Quarkonium signal extraction in ALICE. ALICE-PUBLIC-2015-006.https://cds.cern.ch/record/2060096
28. D.J. Lange, The EvtGen particle decay simulation package. Nucl. Instrum. Methods A 462, 152–155 (2001). doi:10.1016/ S0168-9002(01)00089-4
29. E. Barberio, B. van Eijk, Z. Was, PHOTOS: a universal Monte Carlo for QED radiative corrections in decays. Comput. Phys. Commun.
66, 115–128 (1991). doi:10.1016/0010-4655(91)90012-A
30. GEANT Collaboration, Detector description and simulation tool. CERN Program Library Long Write-up W5013, CERN Geneva 31. CDF Collaboration, D. Acosta et al., Measurement of the J/ψ
meson and b-hadron production cross sections in p¯p collisions at √s = 1960 GeV. Phys. Rev. D 71, 032001 (2005). doi:10.1103/
PhysRevD.71.032001.arXiv:hep-ex/0412071[hep-ex]
32. PHENIX Collaboration, A. Adare et al., J/ψ production ver-sus transverse momentum and rapidity in p + p collisions at √s= 200 GeV. Phys. Rev. Lett. 98, 232002 (2007). doi:10.1103/