Part II
Clinical applications of MRI
Chapter 4. Magnetic Resonance Angiography Chapter 5. Brain functional MRI
Overview
In this part of the thesis some important clinical applications of MRI are introduced, since they are subjects of investigation in the following chapters. In particular, chapter 4 describes the current techniques to perform angiography with MRI and focuses in particular on BOLD high-resolution venography. Chapter 5 introduces the main issues related to brain functional imaging and explains in detail the implications of detecting functional activation through MR image analysis.
Chapter 4
Magnetic Resonance
Angiography
4.1 Introduction
A good knowledge of the geometrical parameters that characterize the cerebral vascular and microvascular system is critical in many clinical applications, since it gives important insight in the brain morphology and its functionality.
This kind of information is extremely important for clinical purposes, as it can be a helpful tool for the characterization of vein pathologies and malformations in patients affected by many kinds of diseases, such as hypertension, cerebral ischemia, thrombosis and so on [1]. The depiction of brain vascularity is not however an easy task, since the brain vascular architecture is structured in a very complicated and intricate pattern [2]. The smaller vessel sizes range in fact from several microns of diameter for capillaries to several tens of microns for venules, precapillary sphincters and arterioles to several 100 µm for small pial arteries and veins [3].
Several MR techniques are available to image brain vascularity, mainly either based on flow detection or on contrast enhancement. In this chapter we will review some of them and focus our attention on BOLD venography.
4.2 Flow-based MR Angiography
Angiography is the imaging of flowing blood in the arteries and veins of the body. In the past, angiography was only performed by introducing an x-ray opaque dye into the human body and making an X-ray image of the dye. This procedure produced a picture of the blood vessels in the body. It however did not produce an image that distinguished between static and flowing blood. It was therefore an inadequate technique for imaging circulatory problems. Magnetic resonance angiography (MRA) on the other hand produces images of flowing blood. The intensity in
Part II. Clinical applications of MRI
40
these images is proportional to the velocity of the flow. The main MR angiographic techniques are time-of-flight [4] and phase contrast angiography [5].
4.2.1 Time-of-flight angiography
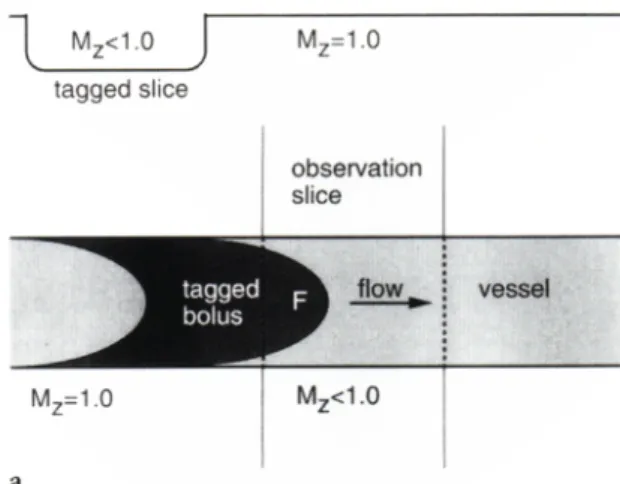
Conceptually, time-of-flight-techniques can be considered as tagging spins in a well-defined volume and then detecting them later. A section is continuously tagged with selective RF pulses with the gradient refocusing sequence. Between tagging and detection, tagged spins will flow into the section with a longitudinal magnetization that is greater than the spins that were previously tagged or excited and remain in the section [6], as shown in Fig. 4-1. This means that after many repetitions there are discrete spin populations that have received a different number of repeated pulses. As flow increases, most of the spins that contribute to the vascular signal intensity are those that have not been tagged. Thus, a significant signal differential is obtained between flowing spins and stationary spins if a short repetition interval is used, which allows only a very small longitudinal relaxation of the magnetization vector.
Fig. 4-1. TOF effect in a vessel crossing the slice of acquisition.
Time-of-flight angiography can be performed in several ways. One method uses a spin-echo sequence where the slice selective 90° and 180° pulses have different frequencies. The 90° pulse excites spins in one plane. The 180° pulse excites spins in another plane. In the absence of flow, no signal is seen because no spins experience both the 90° and 180° pulses. In the presence of flow and the correct TE time, blood from the 90° plane flows into the 180° plane and produces an echo (Fig. 4-2).
Fig. 4-2. Example of pulse sequence for TOF angiography
Fig. 4-3. Example of TOF angiography.
4.2.2 Phase contrast angiography
Though based on flow detection, Phase Contrast Angiography (PCA) is rather different from time-of-flight. The first new concept to introduce is that of a bipolar magnetic field gradient (GBP) pulse. A bipolar
gradient pulse is one in which the gradient is turned on in one direction for a period of time then turned on in the opposite direction for an equivalent amount of time. A positive bipolar gradient pulse has the positive lobe first and a negative bipolar gradient pulse has the negative
Part II. Clinical applications of MRI
42
lobe first. The area under the first lobe of the gradient pulse must equal that of the second (Fig. 4-4). A bipolar gradient pulse has no net effect on stationary spins. Spins which have a velocity component in the direction of the gradient will be affected by the bipolar gradient pulse.
Fig. 4-4. Bipolar field gradients
For example, a stationary spin exposed to the first lobe of the bipolar gradient pulse will acquire a phase in radians given by:
!
"
a= 2#$
%
xG
BPdt
and
!
"
b= #2$%
&
xG
BPdt
from the second lobe. If GBP of the two lobes are equal and the positions are equal during the two pulses the phase acquired from the A lobe equals that from the B lobe. If this bipolar gradient pulse is placed in any one of the imaging sequences, in addition to the other gradients, it will not affect the image since all we have done is imparted a phase shift to the moving spins. Since an image is a magnitude representation of the transverse magnetization there is no effect. However if two imaging sequences are performed in which the first has a positive bipolar gradient pulse and the second a negative bipolar gradient pulse, and the raw data from the two is subtracted, the signals from the stationary spins will cancel and the flowing blood add. If the vectors (and hence signals) from the positive and negative bipolar gradient pulses are subtracted, the vectors from the stationary spins cancel and the moving spins have a net magnitude (Fig. 4-5). The net effect is an image of the flowing spins. The direction of the bipolar gradient yields signal from only those spins with a component in that direction.
Fig. 4-5. Effect of the application of a bipolar gradient on stationary and flowing spins.
Fig. 4-6. Example of phase contrast angiography
4.3 Contrast enhanced venography
Contrast enhanced angiography is based on the difference in the T1 relaxation time of blood and the surrounding tissue when a paramagnetic contrast agent is injected into the blood. This agent reduces the T1 relaxation times of the fluid in the blood vessels relative to surrounding tissues. When the data is collected with a short TR value, the signal from the tissues surrounding the blood vessels is very small due to its long T1 and the short TR. Images are recorded of the region of interest with rapid volume imaging sequences. The high quality of images from contrast enhanced MR angiography has made MRI the modality of choice for angiography.
Part II. Clinical applications of MRI
44
4.3.1 BOLD Venography
The main limitation of TOF and phase contrast angiography techniques is that they require the presence of moving blood to depict the vessels. The mean flow velocity changes are inversely proportional to the cross sectional area. In pial vessels, the mean flow velocity ranges from several mm/s to a few cm/s, whereas in the capillary it is only on the order of 0.5 to 3 mm/s [7]. However, due to the usually slow flow of blood in small vessels, they are difficult to detect with TOF and phase contrast angiography techniques. Most of recent advances have been made in the development of techniques assessing the arterial system; instead, high-resolution magnetic resonance techniques to image the venous system are not as commonly available. A new technique, Blood
Oxygenation Level Dependent (BOLD) MRI Venography has been
developed in the recent years [8,9] which allows visualizing small veins with a diameter smaller than the pixel size. BOLD venography exploits the same mechanism used to detect brain activation in order to highlight venous structures without application of an exogenous contrast agent [10].
The contrast obtained in these images is directly related to the magnetic properties of the blood, which are very sensitive to its oxygenation state. Particularly the iron in the blood is in the haemoglobin, or more specifically in two states, oxyhaemoglobin or deoxyhaemoglobin. These two states differ in their magnetic properties. Oxyhaemoglobin is diamagnetic with no unpaired electrons, while the deoxyhaemoglobin is paramagnetic. A paramagnetic substance, when placed in a magnetic field, increases its flux, as the magnetic dipoles constituting the material tend to align along the same direction of the magnetic field, providing an additive internal magnetic field. Physics describes this phenomenon through the so-called magnetic susceptivity χ. χ is greater than zero for paramagnetic materials and lower than zero for diamagnetic materials. Thus a change or a difference in the oxygenation state of arterial and venous blood manifests itself as a change or difference in the bulk magnetic susceptibility of the blood. If M is the magnetization of a material then:
!
B =(1+") " M(")
Fig. 4-7. Magnetic field distortion in and around a draining vessel.
The main consequences of this phenomenon in MR imaging is that such a magnetic field variation generates in the human body a variation of the relaxation time T2 and T2*. The relation with which the haemoglobin T2 depends from its oxygenation level is [11]:
! 1 T2 = 1 T2,0 + K(1" Y ) 2
where T2,0 is the intrinsic blood T2 value, Y is the saturation level of the
oxygen in the haemoglobin (0<Y<1) and K is a constant, whose value depends on the hematocryte level and the magnetic field strength; at 1.5 Tesla, the arterial blood T2 is 200 ms whereas the venous blood T2 is 100
ms (70% saturation) [8]. An MR sequence with a long TE, thus, will clearly distinct between arteries and veins. This effect will be enhanced with the magnetic field strength. Same considerations hold for T2*.
This effect in a MR gradient echo imaging sequence manifests itself in dephasing of the signal coming from the venous blood vessel because of its longer T2 and T2* respect to arteries and parenchyma. The amount of dephasing is given by:
Part II. Clinical applications of MRI
46
where B0 = f(∆χ) is the magnetic field variation between regions with
different susceptibility, γ is the gyromagnetic ratio and TE is the sequence Time of Echo. The magnetic field heterogeneity produces also a resonance frequency shift in a segment of a vase. For a large vase this shift is given by:
∆f=K’(3 cos2 θ-1)(1-Y)
where K’ is 10 Hz at 1.5 Tesla and it varies linearly with the field strength, θ is the angle between the direction of the considered segment and the main magnetic field. Since all the spins experience the same frequency shift, this does not affect the spins T2 inside the vase; however, when signal from different vases or signal from different tissues is detected in the same voxel, then a signal loss (partial volume
effect) will be recorded (Fig. 4-8).
Fig. 4-8. Partial Volume effect
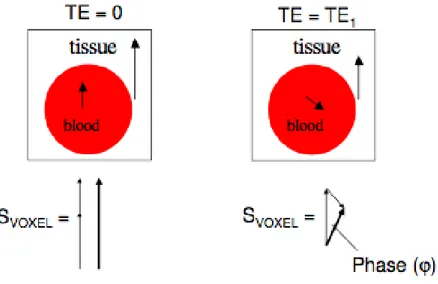
The BOLD phase signal can also be helpful to visualize the smallest venous vessels. The phase signal information can discriminate venous from non-venous voxels. As it will be explained more in detail in the next section, combining the phase with the magnitude in post-processing, it is possible to overcome the partial volume effect and to enhance small variations of the signal amplitude between adjacent voxels.
Fig. 4-9. Phase difference between veins and other brain tissues.
4.3.2 Pulse sequence design and post-processing procedures
BOLD MRI exploits the intrinsic magnetic properties and the T2* effects of blood, highlighting veins vasculature with respect to brain parenchyma and arteries. The gradient-echo sequence is, thus, the basic sequence for BOLD Venography. At 1.5 Tesla long TE values are needed to enhance the contrast between the veins and the surrounding tissues. However, this causes long acquisition time, which is not tolerated both by healthy subjects and patients. Furthermore the longer the acquisition times the higher the probability of field inhomogeneity, which will affect the quality of the images. Nowadays, the availability of 3 Tesla scanners makes this technique more attractive. At higher field, indeed, the relaxation times T2 and T2* become shorter. The BOLD venography 3 T allows shorter echo times (28 ms versus 50 ms) compared with 1.5 T. This makes it possible also to increase the spatial coverage, or shorten the acquisition time, which in turn, makes potential patient examinations more feasible in assessing venous vasculature in a normal or diseased state with high resolution. As far as the other sequence parameter, the flip angle is chosen between 15° e 40°, the TR choice depends on the chosen TE and its range varies between 30 and 200 ms. 3D slices are acquired with a thickness of 1.0 or 2.0 mm and in-plane resolution of 0.5 x 0.5 mm2. Finally, the choice of a sequence parameter is always a trade-off between a good image resolution and the scan time duration.
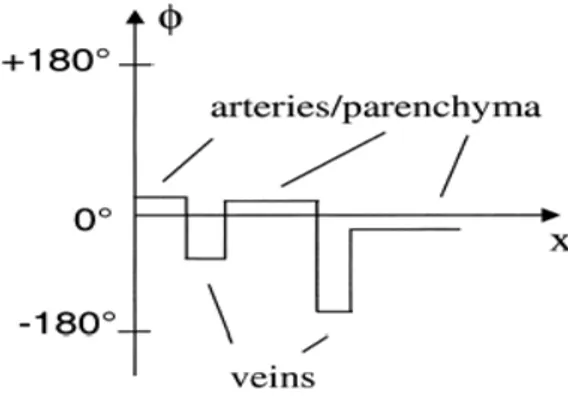
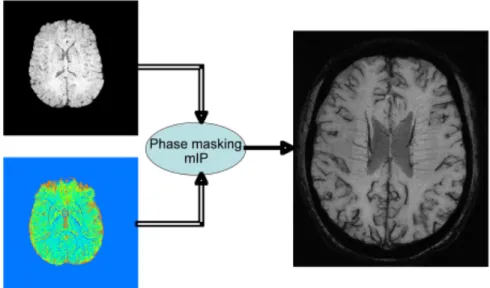
After acquiring the signal in the k-space the amplitude and phase images are reconstructed by the control-computer. As shown in Fig. 4-9, the phase of venous vessels has negative values and appears dark on the phase-contrast images. Arteries and parenchyma will have small positive values. To enhance the veins a phase-mask filter is created. Applying this filter phase values of 0°-180° are set to unity whereas phase values of less than zero are ranged with a power law from 0 to 1, such that 0
Part II. Clinical applications of MRI
48
corresponds to -180° and 1 corresponds to 0° (Fig. 4-10). The magnitude contrast images are multiplied by this normalized phase-contrast mask to enhance the visibility of venous structures. Finally to create the venograms, minimum intensity projections (mIPs) are calculated, over 10-15 slices (Fig. 4-11). A comparison with a TOF angiogram (Fig. 4-3) shows that BOLD venography allows a higher resolution.
Fig. 4-10. Negative phase mask filter.
Fig. 4-11. Procedures for merging magnitude and phase images to obtain high-resolution BOLD venography.
4.4 References
1 Connors E.J., Jarosz J.M.: MRI of Cerebral Venous Sinus Thrombosis.
Clin. Rad. 2002; 57,.449-461
2 Salamon G., Huang yp. (1976): Radiological Anatomy of the Brain, Berlin, (Springer Verlag)
3 Berne, R.M., Levi, M.N.: The Circuitry, in Berne, R.M., Levi, M.N. (Ed): ‘Physiology’ (2nd edition, Mosby St. Louis 1988), pp. 395-97 4 D.G. Nishimura Time-of-Flight MR Angiography. Magn. Reson. Med.
1990; 14:194-201
5 C.L. Dumoulin, S.P. Souza, M.F. Walker, W. Wagle Three-Dimensional Phase Contrast Angiography. Magn. Reson. Med. 9:139-149 (1989)
6 Crooks L., Sheldon P., Kaufman L, Rowan W. Quantification of obstructions in vessels by nuclear magnetic resonance NMR. IEEE Trasn Nucl Sci 1982; NS-29: 1181-1185
[7] Pawlick G., Rackl A., Bing R.J. Quantitative capillary topography of and blood flow in the cerebral cortex of cats: an in-vivo microscopic study , Brain Res 1981; 208, pp. 35-38
8 Reichenbach J.R., Venkatesan R., Schillinger D.J., Kido D.K., Haacke E.M. Small Vessels in the Human Brain: MR Venography with Deoxyhemoglobin as Intrinsic Contrast Agent, Radiology 1997; 204, pp 272-277
9 Reichenbach J.R., Haacke E.M. High-Resolution BOLD Venographic Imaging: a Window into Brain Function, NMR Biomed 2001; 14, pp. 452-467
10 Reichenbach J., Essig M., Haacke E., Lee B.,Przetak C., Kaiser W., Schad L.‘High Resolution venography of the brain using magnetic resonance imaging’, MAGMA 1998; 6, pp. 62- 69
11 G.Wright, B.Hu, A.Macovski. Estimating oxygen saturation of blood in vivo with MR imaging. Magnetic Resonance Imaging 1992; 1:, 275-283
Chapter 5
Brain functional MRI
5.1 Introduction to Neuroimaging
The goal of functional neuroimaging is to map the activity of the living brain in space and time. The gold standard for measuring brain cell activity is direct and invasive electrical recording of membrane potential of individual neurons; however, such measurements are limited to certain experimental conditions. For studies on human subjects, non-invasive methods have to be applied and these methods have inherent limitations. There are two main approaches for non-invasive functional neuroimaging: (1) electrophysiological methods and (2) metabolic/vascular methods.
Electrophysiological methods, such as electroencephalography (EEG) and magnetoencephalography (MEG) [1], measure signals that arise as summations of electrical events in individual cells. The main advantage of these methods is their excellent temporal resolution; the main disadvantage stems from the fact that only weighted averages (centre of gravity) of electrical brain activity can be recorded. It can be difficult to relate these signals to a defined anatomical structure and it is currently not possible to clearly define the spatial extent of an activated area.
Another group of functional neuroimaging methods measures metabolic or vascular parameters. The most important of these are positron emission tomography (PET) and functional magnetic resonance imaging (fMRI). Although these approaches are more indirect, they offer significant advantages, in particular very good spatial resolution, good delineation of the spatial extent of an activated area and precise matching to anatomical structures. The physiological basis of these methods is the fact that brain cell activity is associated with local changes in metabolism, in particular with glucose and oxygen consumption and via the so-called neurovascular coupling in cerebral blood flow (CBF) and oxygenation.
5.1.1 Functional investigation through metabolic/vascular changes The basic assumption of this approach to neuroimaging is that brain cell activity produces a certain change in local metabolism, which, in
Part II. Clinical applications of MRI
52
turn results through neurovascular coupling in changes of the local hemodynamics, represented as changes in Cerebral Blood Flow (CBF), Cerebral Blood Volume (CBV) and blood oxygenation. The metabolic and vascular changes associated with brain activity can be mapped by means of non-invasive imaging tools.
The process of producing functional images can be regarded again as a further transformation of the metabolic and vascular maps performed by the imaging device itself.
In order to understand the functional images obtained with these methods, it is therefore important to understand: (1) the relationship between local brain activity and the physiological parameters which are measured, and (2) the relationship between these physiological parameters and the obtained functional image.
5.1.2 Issues related to spatial and temporal resolution
The replacement of the ideal map of brain activity at a level of individual cells by a map of the associated metabolic or vascular events is associated with a loss of information. This information loss occurs on at least three levels: (1) a qualitative reduction of many different types of brain cell activity into just one dimension of more or less brain activity; (2) a loss of spatial resolution; and (3) a loss of temporal resolution.
The many different facets of brain activity such as synaptic excitation, synaptic inhibition, action potential of the neuron soma, and sub-threshold depolarization are not reflected one by one in the metabolic or vascular response, rather they are all translated into just one dimension of metabolism/blood flow according to the respective energy need [2]. The metabolic change is probably not induced by the neuronal activity such as synaptic activity or the action potential itself but rather their consequences require energy and induce a metabolic response. A study on energy consuming processes in axonal terminals found that uptake of glucose correlated with the activity of the ouabain-sensitive sodium pump and it was concluded that this represented the critical event coupling energy consumption and neuronal activity [3].
Beside the qualitative reduction of several types of brain cell activity into just one dimension of more or less brain activity, there may also be a blurring of spatial information with regard to the underlying brain cell activity. For the metabolic response as measured, e.g., by glucose consumption, the spatial error is probably very small, whereas for the vascular response, it may be quite significant.
For the vascular response the spatial relationship to brain activity is given by the smallest vascular unit which adapts independently to brain activity. This is currently an issue of controversy. The smallest theoretically possible functional unit in the vascular system is a single capillary, and since precapillary sphincters anatomically do exist and
since capillary walls contain some contractile elements (however no muscle cells) vasoregulation at the capillary level seems theoretically possible. As an extreme variant of vasoregulation at a capillary level, it has been claimed that complete opening and closing of capillaries and hence pronounced changes in capillary blood volume would represent a major mechanism of blood flow adjustment in the brain, the so-called capillary recruitment hypothesis [4,5]. However, a series of studies has shown that already under resting conditions all cerebral capillaries are continuously perfused with plasma [6,7] and by far most of the capillaries also contain moving red blood cells [8]. It is concluded that capillary recruitment in the previously perceived yes-or-no sense is not a major mechanism for flow adjustment. Interestingly, capillaries, which were classically regarded as rigid tubes of fixed size, can change their diameter, e.g., during hypercapnia; thus, some minor change in capillary blood volume could be feasible during functional activation [9].
Using metabolic or vascular information to infer about brain activity introduces also issues concerning the temporal resolution of the neuroimaging techniques. Whereas neuronal events occur in fact on a time scale of milliseconds, metabolic and vascular events occur on a time scale of seconds. This sets limits to the possible temporal resolution of functional neuroimaging approaches based on metabolic/vascular imaging.
While on the temporal activity-metabolism coupling still little is known due to the poor temporal resolution of the employed methods (mainly PET), for the neurovascular response there are at least three types of temporal resolution to be considered:
1. The briefest possible neuronal event which induces a vascular response. It has been demonstrated that a visual stimulation as short as 30 ms still produced a vascular response. And although there is no systematic study on this issue, it seems quite likely, that even a very brief event on a millisecond time scale is associated with some metabolic/vascular response.
2. The second type of temporal resolution is the minimal separation in time of subsequent stimuli activating the same brain region. This temporal resolution is probably on the order of 1-2 s.
3. The third kind of temporal resolution refers to the temporal separation of events occurring in different brain regions. If the vascular response to neuronal activity has precisely the same temporal kinetics in every location in the brain, then this kind of temporal resolution could be much below 1 s. Data on hemifield visual stimulation seem to indicate that, for the temporal separation of activity in the left and right primary visual cortex, a temporal resolution on the order of 50-100 ms can be achieved [10].
Part II. Clinical applications of MRI
54
5.1.3 Physiological changes following functional activation
Brain activity is associated with increased energy requirements which are mostly met by oxidative glucose consumption. After onset of brain activity, a signal is sent to the feeding arteriole which in turn dilates. The dilation of the feeding arteriole leads to an increase in CBF in downstream capillaries. All capillaries are already perfused during resting conditions, but the blood flow per capillary increases and heterogeneity of blood flow decreases. The increase in blood flow is larger than the increase in oxygen consumption, hence oxygenation increases especially at the venular side of the capillary and in the venous vessels. Furthermore, since the main mechanism of the blood flow increase is an increase in velocity, deoxy-Hb decreases. The latter is the basis of the BOLD contrast in fMRI.
It should be kept in mind that all considerations mentioned so far refer to healthy (in most studies young adult) human subjects. In all situations referring to other human subjects there may be considerable deviations. The vascular response to functional activation is known to be age-dependent. In neonates it was reported that deoxy-Hb does not decrease but rather increases with increased brain activity [11]. In adult subjects, the amount of blood flow increase during functional activation seems to attenuate with age [12].
Furthermore, there is very little knowledge about alterations of metabolic and vascular responses in brain disease. After transient global ischemia, it is known that the vascular response is abolished for some time. In patients with carotid stenosis and decreased reserve capacity, the vascular response can be diminished. Furthermore, a number of drugs which are clinically used, such as theophylline and scopolamine, are known to inhibit the vascular response to functional activation [13,14]. In all these (and probably many other) circumstances the integrity of the coupling between brain activity-metabolism and blood flow, which is the basis for the validity of metabolic/vascular functional neuroimaging methods, is not certain.
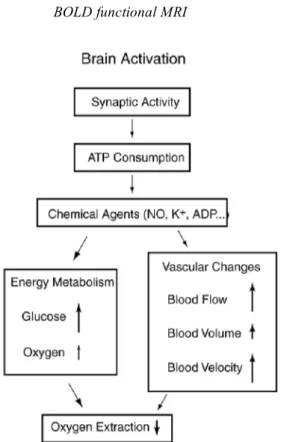
From the experimental data we can piece together an empirical picture of the physiological changes that accompany brain activation and form the basis for functional neuroimaging (Fig. 5-1).
Fig. 5-1. Physiological changes accompanying brain activation. Functional neuroimaging is largely based on the metabolism and flow changes in the lower three blocks. The drop in oxygen extraction is the basis of the BOLD signal changes measured with fMRI, but the MR signal is potentially sensitive to blood flow, volume, and velocity as well.
The primary finding, which makes possible PET and fMRI studies of brain activation, is that CBF increases substantially. The increase is localized, but the fineness of the spatial control of CBF is still debated. The flow change is a graded response in the sense that the magnitude of the flow change is often correlated with other measures of the degree of neural activity. For example, the flow response in the visual cortex to a flashing checkerboard pattern increases as the flicker rate is increased up to about 8 Hz and then slowly declines, and in the auditory cortex the flow response increases with stimulus rate. Experimental results such as this support the idea that CBF change reflects not just the location of the activated area but also the degree of activation.
The second finding, which is essential for fMRI sensitivity to brain activation, is that the Cerebral Metabolic Rate of Oxygen consumption (CMRO2)increases much less than CBF. The ratio of percent change in
CBF to percent change in CMRO2 has been found to be in the range of
3-6 in PET studies and in the range 2-3 in fMRI studies using hypercapnia to calibrate the BOLD effect. The result of this imbalance in the changes of CBF and CMRO2 is a substantial drop in oxygen
extraction and a corresponding drop in the deoxyhemoglobin content of the venous blood. This produces the BOLD change in the MR signal.
Part II. Clinical applications of MRI
56
Even though PET techniques directly measure CBF, the BOLD signal change depends on the combined changes in CBF, CMRO2, and CBV,
which complicates interpretation of the BOLD signal in terms of physiological variables. Animal and human studies using radioactive tracers and altered pCO2 as a means of changing global brain perfusion
have found an increase in cerebral blood volume accompanying increased flow. The BOLD effect essentially depends on the total amount of deoxyhemoglobin within an image voxel. Assuming that the CBV change is primarily on the venous side, increased CBV tends to increase local deoxyhemoglobin content simply because the volume of venous blood increases. This increase tends to counteract the effects of altered blood oxygenation, which decreases the deoxyhemoglobin content. Under normal circumstances the blood oxygenation effect dominates the blood volume effect, so the BOLD signal change is positive with activation, corresponding to a net decrease in the local deoxyhemoglobin content. This decrease of deoxyhemoglobin has been measured directly with optical and near-infrared techniques. Studies in adult humans have consistently found a decrease in deoxyhemoglobin with activation; however, it has also been reported an increase in deoxyhemoglobin in infants aged 3 days to 14 weeks. If confirmed, this result could be due to a smaller increase in CBF, a larger increase in CMRO2, or a larger increase in CBV in infants.
The physiological mechanism by which perfusion increases has been controversial. We can imagine two distinct scenarios that bracket a range of possibilities, and evidence has been presented for both views. The first is capillary recruitment in which the flow characteristics within a capillary (velocity, size, etc.) remain constant but more capillaries open up. The second is increased velocity through a fixed capillary bed. Although some studies have indicated that at rest as few as 60% of available capillaries are perfused and that this fraction then increases when perfusion increases, a number of other studies have found that at least 90% of capillaries are open at rest so that perfusion must increase by increased capillary velocity. Note that the observation of increased total blood volume is consistent with either mechanism because the methods used cannot distinguish between capillary, venous, or arterial volume changes. Even with a completely fixed capillary bed, the veins may swell as a passive response to a local pressure increase, which might be expected after the arterioles dilate to reduce the local vascular resistance. Although capillary recruitment now seems unlikely, the capillary volume may increase by dilatation.
The physiological picture of what happens during brain activation is thus still incomplete. The evidence to date suggests the following scenario: cerebral blood flow increases substantially, cerebral blood volume increases moderately, the CMRO2 increases slightly, the O2
extraction fraction drops substantially, and the local blood velocity in the arterioles, capillaries, and venules increases with an accompanying drop in the blood transit time, while the capillary density probably stays about the same.
5.2 BOLD functional MRI
BOLD Functional magnetic resonance imaging (fMRI) is an emerging methodology which provides various approaches to visualizing regional brain activity non-invasively. Although the exact mechanisms underlying the coupling between neural function and fMRI signal changes remain unclear, fMRI studies have been successful in confirming task-specific activation in a variety of brain regions, providing converging evidence for functional localization. New developments in combining or simultaneously measuring the electrophysiological and fMRI signals allow a new class of studies that capitalize on dynamic imaging with high spatiotemporal resolution. The goal of functional neuroimaging is to map the activity of the living brain in space and time. Electrophysiological methods including magnetoencephalography (MEG) and electroencephalography (EEG) offer direct measurements of neural activity with high temporal resolution, but are limited by difficulties in defining the spatial extent of activation.
Several indirect, neuroimaging methods based on metabolic and vascular parameters provide excellent spatial resolution for imaging brain function along with precise matching with anatomical structures. In particular, functional magnetic resonance imaging (fMRI) has enabled imaging of changes in blood oxygenation and perfusion, and has been gaining increasing popularity over other methods for its total non-invasiveness and wide availability. Over the past several years fMRI has become the most widely used modality for visualizing regional brain activation in response to sensorimotor or cognitive tasks, and is now widely used in cognitive, systems and clinical neuroscience.
Functional MRI is completely non-invasive, does not require exposure to ionizing radiation, and is much more widely available. fMRI also provides superior temporal and spatial resolution, and increased sensitivity for detecting task activation in individual subjects through signal averaging as compared to positron emission tomographic (PET) scanning. PET still provides a much greater repertoire of image contrasts.
In fact, PET images can reflect blood flow, glucose utilization, oxygen consumption, and receptor binding, whereas fMRI is primarily sensitive to hemodynamic changes. The receptors use occurs at concentrations well below the sensitivity of MRI, and can only be measured in vivo
Part II. Clinical applications of MRI
58
with radioactive tracers, though fMRI can be used to visualize pharmacological effects indirectly [15,16,17]. PET also provides a silent environment that is not affected by electromagnetic interference or the presence of ferrous objects. However, PET scanning is less widely available and significantly more costly than fMRI due to the need for on-line tracer synthesis.
BOLD fMRI is based on physiological responses related to brain activation like other functional neuroimaging methods such as positron emission tomography [18] and optical imaging [19]. To start with, there is the fact that brain function is spatially segmented and compartmentalized. Such functional specialization can be mapped via measuring secondary hemodynamic and metabolic changes in response to alterations in neuronal activity.
The spatial resolution of fMRI, although limited, can provide significant and useful information on functional compartmentalization. The coupling between the physiological response and neuronal activation is tight and well localized, but the response time is relatively slow, in seconds, rather than the time constant of neuronal activity which is in tens or hundreds of milliseconds.
The mechanisms behind the BOLD contrast are still to be determined, however there are hypotheses to explain the observed signal changes. Deoxyhaemoglobin is a paramagnetic molecule whereas oxyhaemoglobin is diamagnetic. The presence of deoxyhaemoglobin in a blood vessel causes a susceptibility difference between the vessel and its surrounding tissue. Such susceptibility differences cause dephasing of the MR proton signal [20], leading to a reduction in the value of T2*. In a T2* weighted imaging experiment, the presence of deoxyhaemoglobin in the blood vessels causes a darkening of the image in those voxels containing vessels [21,22]. Since oxyhaemoglobin is diamagnetic and does not produce the same dephasing, changes in oxygenation of the blood can be observed as the signal changes in T2* weighted images [23,24].
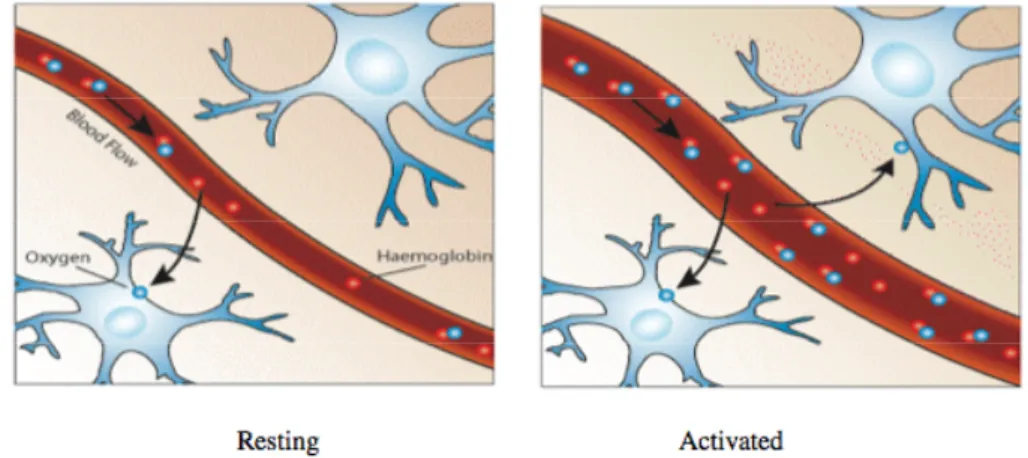
It would be expected that upon neural activity, since oxygen consumption is increased, that the level of deoxyhaemoglobin in the blood would also increase, and the MR signal would decrease. However what is observed is an increase in signal, implying a decrease in deoxyhaemoglobin. This is because upon neural activity, as well as the slight increase in oxygen extraction from the blood, there is a much larger increase in cerebral blood flow, bringing with it more oxyhaemoglobin (Fig. 5-2). Thus the bulk effect upon neural activity is a regional decrease in paramagnetic deoxyhaemoglobin, and an increase in signal.
Fig. 5-2. Upon activation, oxygen is extracted by the cells, thereby increasing the level of deoxyhaemoglobin in the blood. This is compensated for by an increase in blood flow in the vicinity of the active cells, leading to a net increase in oxyhaemoglobin.
The study of these mechanisms is helped by results from PET and near-infrared spectroscopy (NIRS) studies. PET has shown that changes in cerebral blood flow and cerebral blood volume upon activation, are not accompanied by any significant increase in tissue oxygen consumption [25]. NIRS can measure the changes in concentrations of oxy- and deoxyhaemoglobin, by looking at the absorbency at different frequencies. Such studies have shown an increase in oxyhaemoglobin, and a decrease deoxyhaemoglobin upon activation. An increase in the total amount of haemoglobin is also observed, reflecting the increase in blood volume upon activation [26]. The time course for the BOLD signal changes is delayed from the onset of the neural activity by a few seconds, and is smooth, representing the changes in blood flow that the technique detects. This is termed the 'haemodynamic response' to the stimulus. There have also been observations of an initial small 'dip' in signal before and after the larger increase in signal [27,28], possibly reflecting a transient imbalance between the metabolic activity and blood flow.
5.2.1 Coupling between activation and functional response signal There is still one important open question for functional brain mapping using fMRI is how well the BOLD response is correlated with neuronal activation. Since the BOLD signal is closely related to the change in CBF, which is known to be closely coupled to functional activation, the BOLD response in space is expected to represent the site of activation. However, the BOLD change is complicated by the multiple contributions from both the metabolic change in CMRO2 and
hemodynamic changes in CBF and CBV [23]. Whether the magnitude of the BOLD change is quantitatively correlated with alterations in CBF
Part II. Clinical applications of MRI
60
and/or neuronal activity needs to be examined. Since neuronal and vascular responses to activation are expected to vary among subjects as well as across different regions in a given brain, a close examination of CBF and BOLD changes in the same activation region with stimuli in different modes and without inter-subject averaging is warranted. This can be accomplished in studies of the visual cortex by varying the degree of neuronal activity with graded visual stimulation.
Previous neuroimaging studies have demonstrated that neuronal activity in V1 is sensitive to the temporal frequency of photic stimulation, showing a maximal response at approximately 8 Hz in the human brain [29,30]. Similar observations have also been demonstrated in the visual pathway by evoked potential [31] and neuronal recording with electrodes studies [32]. Some authors applied the multislice flow-sensitive alternating inversion recovery (FAIR) technique [33,34] to measure BOLD and CBF changes simultaneously at 4 T during checkerboard visual stimulations flashing at 2, 4, 6, and 8 Hz frequencies in single subjects [35]. In the FAIR technique, multislice coronal images with echo-planar imaging (EPI) acquisition preceded by slice-selective inversion recovery (ssIR) and nonslice-selective IR (nsIR) are obtained in an interleaved way. The BOLD-based fMRI maps were generated by nsIR images alone, which are dominated by the BOLD changes; the FAIR images were generated by paired subtraction between the nsIR and ssIR images on a pixel-by-pixel basis and they were further used to generate the CBF-based fMRI maps [36]. This technique has been used to examine the dynamic correlation between BOLD and CBF changes in V1 as a function of visual stimulation frequency [35]. In this study, only the common activation pixels in VI which passed a statistically significant threshold for both the BOLD and CBF maps across all visual stimulation tasks were utilized for calculating and comparing the average BOLD and CBF changes. The FAIR sequence parameters were chosen for optimizing perfusion component in the microvascular areas and suppressing the macrovascular contributions [37]. Therefore, the pixels common to images based on both BOLD and CBF changes will not suffer from the macrovascular component that can be present in the BOLD map alone.
A significant linear correlation between BOLD and CBF changes was obtained for both cases. This supports the hypothesis that task-induced BOLD changes associated with the microvasculature are well correlated with the CBF changes which presumably reflect metabolic alterations corresponding to variations in neuronal activity itself [38,18]. Therefore, the magnitude of BOLD change can be used to evaluate variations in neuronal activity within the same activation areas. However, such a relationship may be not valid for comparing different activation areas during the same task performance because of the complex characteristics
of the vasculature and hemodynamics in different cortical areas. In this study, it was also found that the linear correlation for intra-subject comparisons was more significant than those for inter-subject comparisons [35]. This suggests that using intra-subject comparisons for quantitative studies of neuronal activity related to different task stimuli and task performances should be more reliable than using inter-subject comparisons.
Animal studies also demonstrated a consistency of the activation locations between microflow and BOLD functional maps in the somatomotor cortex during somatosensory stimulation [39] and a close relationship among CBF, BOLD and evoked potentials in response to the stimulus frequency [40,41]. This suggests that the BOLD signal may quantitatively reflect neuronal events.
5.2.2 BOLD functional MR signal
The expression for the MRI signal acquired with a single pulse sequence can be written as following:
*) ( *) (T1 AT2 M S= !
where M is the sampled magnetization which is the signal intensity at echo time zero. The magnitude of M is determined by T1* (T1 with
inflow) and is also dependent on the method of NMR signal acquisition in terms related to T1. The term A, the signal attenuation, is the T2*
decay of the in-plane magnetization. BOLD contrast contributes to the T2* decay process and the echo time is the parameter one can vary to
examine the transverse relaxation process. The compartments in an image voxel, such as tissue, blood and bulk cerebrospinal fluid (CSF), have signals that are added together vectorially. In capillary beds the water exchange across the capillary wall is relatively fast compared with T1 and the blood transit time through the capillary bed. Therefore the
longitudinal magnetization for blood water and tissue water in capillary beds can be summed together as a single entity. The venous blood from the capillaries and beyond has a magnetization quite similar to the tissue water. T2* decay, on the other hand, occurs at a much faster rate than
water exchange, and thus blood and tissue have different contributions to the attenuation, A.
When there is an activation induced MRI signal in a capillary bed, the signal change is the sum of the changes in M due to T1* and in A due to
the T2* attenuation, as described by:
A A M M S S ! + ! = !
Part II. Clinical applications of MRI
62
The first term is the inflow effect and is zero if the magnetization at the sampling time is maintained at a fully relaxed condition. At a steady state of continuous imaging sampling with single pulse MRI acquisition, a repetition time of ~T1 or shorter and the sampling pulse at Ernst's
angle: !! " # $$ % & !! " # $$ % & ' = ' * T 1 * T 1 0.4 ~ 1 1 M M
where 1/T1*=1/T1+CBF/α and ∆(1/T1*)=∆CBF/α. With water partition
α of 0.92 and when ∆CBF is as high as 50 ml blood/100 g tissue per min, the inflow contribution ∆M/M is ~0.0035. Therefore, in capillary beds, the inflow effect due to the CBF increase is small relative to a BOLD signal change, ∆A/A, of a few percent or larger. Actually, when the activation signal detected by fMRI is measured with varying echo times (TE), extrapolation to echo time zero shows a very small remaining activation signal [42]. In contrast, with the inversion recovery type of signal acquisition used for perfusion measurements, the coefficient in the last equation is ~3, instead of 0.4, at TI (flow-in time after inversion) = ~T1 with a sufficiently long recovery time.
If A is described by a simple T2* decay (or T2 decay for spin echo
sampling), A=exp(-TE/T2*) and ∆A/A = -TE·∆(1/T2*). Estimated values
of ∆(1/T2*) decreases from fMRI experiments are ~1 s-1 depending on
B0 field strength [42,43]. With a typical echo time of 20-40 ms, ∆A/A, is
a few percent at the tissue.
One of the major features of the fMRI method is its capability to follow dynamic physiological changes in real time. The limiting temporal resolution is the echo time, ten to several tens of milliseconds, although the actual physical limit may be the scanning time needed to cover the image k-space. In perfusion measurements, the inflow signal response to the change in CBF may lag slightly behind the actual CBF change because of the water exchange process, which is only slightly shorter than 1 s and which takes some time to reach steady state. With these time resolutions of BOLD fMRI, one can follow the changes in the physiology induced by neuronal activation.
5.2.3 Functional mapping using the BOLD effect
The discovery of the BOLD effect led to many groups trying to map brain activation using the technique. The first MR human brain activation study used an introduced contrast agent to map the visual cortex [44]. Soon after that the BOLD effect was used to map visual and
motor function [30,45]. To study brain function using fMRI it is necessary to repeatedly image the brain, whilst the subject is presented with a stimulus or required to carry out some task. The success of the experiment is dependent on three aspects; the scanning sequence used, the design of the stimulus paradigm, and the way the data is analyzed.
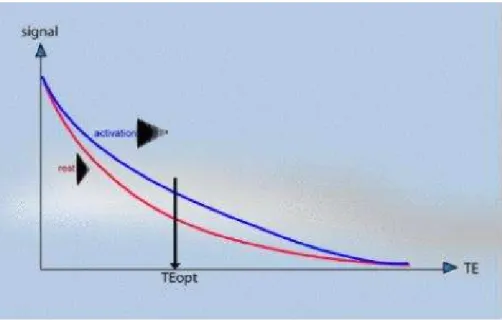
The magnitude of the static field used is critical to the percentage signal change obtained on activation. This is because susceptibility differences have a greater signal dephasing effect at higher fields. The earliest fMRI studies were carried out at 1.5 Tesla, but now the forefront research facilities use 3 to 7 Tesla scanners. As field strength increases the magnitude of the BOLD contrast increases more rapidly than system noise, so it would appear that higher field strengths are desirable [46], however the image quality will be reduced at higher field. The most important aspect of the imaging sequence is that it must produce T2* weighted images. This means that a gradient echo is most commonly used, however spin echo sequences still show BOLD contrast because of diffusion effects. Most research is carried out using EPI since its fast acquisition rate allows the activation response to short stimuli to be detected. EPI also has the benefit of reduced artefact from subject motion. The amount of T2* weighting in the image is dependent on the echo time TE. If TE is too short, there will be little difference in the T2* curves for the activated state and the resting state, however if TE is too long then there will be no signal from either state. To obtain the maximum signal change for a region with a particular value of T2*, the optimal value of echo time can be shown to be equal to the T2* value of that tissue (Fig. 5-3).
Part II. Clinical applications of MRI
64
Fig. 5-3. Identification of the optimal TE to achieve the maximum relative signal change with the BOLD functional effect.
The contrast to noise ratio of the BOLD signal also depends on voxel size and slice thickness. Smaller voxels have less proton signal due to the reduced number of spins, however larger voxels may reduce the contrast to noise ratio by partial volume effects. This occurs if the signal changes on activation come from only a small region within the voxel, and so makes less of an impact on the total signal change in that voxel.
During the scanning there are a number of physiological effects that can affect results. These include cardiac pulsation, respiration and general subject movement. All these problems can be dealt with in two ways, either at the time of scanning or in image post processing. Cardiac or respiratory gating, that is triggering the scanner at one part of the cardiac cycle can be used, although this introduces artefact due to changes in the spin saturation. Postprocessing strategies have been proposed and are probably the best way to deal with this problem [47]. Subject movement can also reduce contrast to noise in fMRI images, and introduce artefact in the activation maps if the movement is stimulus correlated. This problem is often solved both by restraining the head of the subject and by using a postprocessing registration algorithm.
Another source of artefact in fMRI is the signal coming from draining veins. Since gradient echo images are sensitive to vessels of diameters from micrometers to millimetres, it can be difficult to distinguish between signals from the tissue and that from the veins, which could be some distance away from the activation site [48]. There is also the problem that blood flowing into the imaging slice may be stimulus correlated. The choice of the optimum parameters for fMRI is always a
compromise, and often depends more on what is available than what is desirable.
5.2.4 Paradigm design
As important as choosing the imaging parameters for a good experiment is designing the stimulus paradigm. A lot of experience has come from EEG and PET, but since fMRI has a temporal resolution somewhere between these two techniques new approaches can be taken. The earliest fMRI experiments were much in the form of PET studies, that is to say a set of resting images were acquired and then a set of activation images, and one set subtracted from the other. However since the BOLD contrast is relatively rapid in its onset and decay (of the order of a few seconds) it is possible to follow time courses for much shorter events occurring more frequently. The most common stimulus presentation pattern is that of regular epochs of stimulus and rest, usually labelled 'on' and 'off'. The duration of these epochs needs to be long enough to accommodate the haemodynamic response, and so a value of at least 8 seconds, or more commonly 16 seconds is chosen. These epochs are repeated for as long as is necessary to gain enough contrast to noise to detect the activation response. The total experimental duration however must be a balance between how long the subject can comfortably lie still without moving, and the number of data points required to obtain enough contrast to noise. There are often some technical limitations to the experimental duration, and there is the possibility of the subject habituating to the stimulus causing the BOLD contrast to reduce with time.
Instead of epochs of stimuli, it is possible to use single events as a stimulus, much in the same way that EEG or MEG does. Again due to the haemodynamic response, these must be separated by a much longer period of time than would be required for EEG, but since this type of stimulus presentation has the major advantage of being able to separate out the relative timings of activations in different areas of the brain. One of the major disadvantages of single event paradigms is that the experiments need to be much longer than their epoch based counterparts, in order to gain the necessary contrast to noise.
The choice of stimulus is very critical. For example, to activate the primary visual cortex is straightforward, but to determine the regions responsible for colour discrimination is more difficult. Ideally it is necessary to design the 'on' and 'off' epoch such that there is only one well defined difference between them, which will only activate those brain regions responsible for the single task. This is not always possible and so a hierarchy of experiments often need to be performed. For example to identify the regions responsible for task A, an experiment can be performed which involves task A and task B, and then one which
Part II. Clinical applications of MRI
66
only involves task B. The regions responsible for task A would presumably be those activated in the first experiment but not the second. This assumes that the system is a linear one, which may not be the case, or there could be some unaccounted for differences in the two paradigms, which could affect the result. The subject needs to have good instructions, and be reminded to lie still, and to concentrate. Many stimuli give better activation if a response is required to be made. There is much more that could be said on good paradigm design, and much is still being learnt, however care must always be taken and much thought be given for any new experiment.
5.2.5 Analysis of fMRI data
The analysis of fMRI data falls into two parts. Firstly the raw data must be analyzed to produce an image showing the regions of activation and secondly, some level of significance must be calculated so that the probability of any of producing such a result purely by chance is suitably low [49].
The most straightforward way to analyze the data is to subtract the mean 'off' image from the mean 'on' image. This has the disadvantage that any small movement of the head can drastically change the pixel intensity at the boundaries of the image. This can give rise to a ring of apparent activation near the brain boundaries. To reduce this effect, and to give a statistic of known distribution, a student's t-test can be used. This biases the result against pixels in either 'on' or 'off' set with very large variability, and so can reduce movement artefact. An image where each pixel is assigned a value based on the output of a statistical test is commonly called a statistical parametric map. Another commonly used technique is that of correlation coefficient mapping. Here the time response of the activation to the stimulus is predicted, usually with some knowledge of the haemodynamic response, and the correlation coefficient between each pixel time course and this reference function is calculated.
Other methods that have been used include Fourier transformation, which identifies pixels with a high Fourier component and the frequency of stimulus presentation, principal component analysis, which locates regions in the brain which show synchronous activity using eigenfunctions, clustering techniques, which again look for synchrony using iterative methods, and various non-parametric tests which do not require the assumption of normality in the signal distribution. All these have their various strengths and weaknesses, and no doubt new methods or variants will be developed in due course. The main criteria for any technique however are simplicity, speed, statistical validity, and sensitivity.
After obtaining a statistical map it is necessary to display the regions of activation, together with some estimate as to the reliability of the result. If the distribution of the statistic, under the null hypothesis of no activation present, is known, then statistical tables can be used to threshold the image, showing only those pixels which show strong stimulus correlation. When displaying the results as an image usually of several thousand pixels, it is necessary to account for multiple comparisons, since the probability of any one pixel in the image being falsely labelled as active is much greater than the probability of a lone pixel being falsely labelled. There are several ways to account for this, for example the Bonferroni correction or the theory of Gaussian random fields.
Part II. Clinical applications of MRI
68
5.3 References
1 Yang TT, Gallen CC, Schwartz BJ, Bloom FE (1993) Noninvasive
somatosensory homunculus mapping in humans by using a large-array biomagnetometer. Proc Natl Acad Sci USA 90:3098-
2 Jueptner M, Weiller C (1995) Review: does measurement of regional cerebral blood flow reflect synaptic activity?- implications for PET and fMRI [In Process Citation]. Neuroimage 2:148-156
3 Mata M, Fink DJ, Gainer H, Smith CB, Davidsen L, Savaki H, Schwartz WJ, Sokoloff L (1980) Activity-dependent energy metabolism in rat posterior pituitary primarily reflects sodium pump activity. J Neurochem 34: 213-2 15
4 Shockley RP, LaManna JC (1988) Determination of rat cerebral cortical blood volume changes by capillary mean transit time analysis during hypoxia, hypercapnia and hyperventilation. Brain Res 454:170-178
5 Weiss HR and Sinha AK (1993) Imbalance of regional cerebral blood flow and oxygen consumption: effect of vascular alpha adrenoceptor blockade. Neuropharmacology 32:297-302
6 Gobel U, Klein B, Schrock H, Kuschinsky W (1989) Lack of capillary recruitment in the brains of awake rats during hypercapnia. J Cereb Blood Flow Metab 9:491-499
7 Villringer A, Them A, Lindauer U, Einhaupl K, Dirnagl U (1994) Capillary perfusion of the rat brain cortex. An in vivo confocal microscopy study. Circ Res 75:55-62
8 Pawlik G, Rackl A, Bing R J (1981) Quantitative capillary topography and blood flow in the cerebral cortex of cats: an in vivo microscopic study. Brain Res 208:35-58
9 Duelli R, KuschinskyW (1993) Changes in brain capillary diameter during hypocapnia and hypercapnia. J Cereb Blood Flow Metab 13:1025-1028
10 Luknowsky DC, Thomas CG, Gatley SJ, Menon RS (1998) Millisecond sequencing of neural activation in simple tasks determined by the BOLD fMRI neurovascular response. Neuroimage 7: 5280-S280(Abstract)
11 Meek JH, Elwell CE, Firbank M, Noone MBO, Atkinson J, Wyatt 15 (1998) Regional haemdoynamic changes in the occipital cortex of awake infants due to visual stimulation. Neuroimage 7: S311-S311 12 Hock C, Muller-Spahn P, Schuh-Hofer 5, Hofmann M, Dirnagl U,
Villringer A (1995) Age dependency of changes in cerebral hemoglobin oxygenation during brain activation: a near-infrared spectroscopy study. J Cereb Blood Flow Metab 15:1103-1108
13 Dirnagl U, Niwa K, Lindauer U,Villringer A (1994) Coupling of cerebral blood flow to neuronal activation: role of adenosine and nitric oxide. Am J Physiol 267:H296-H301
14 Ogawa S, Magata Y, Ouchi Y, Fukuyama H, Yamauchi H, Kimura J,Yonekura Y, Konishi 1(1994) Scopolamine abolishes cerebral blood flow response to somatosensory stimulation in anesthetized cats: PET study. Brain Res 650:249-252
15 Nguyen TV, Brownell AL, Iris Chen YC, Livni E, Coyle JT, Rosen BR, Cavagna F, Jenkins BG (2000) Detection of the effects of dopamine receptor supersensitivity using pharmacological MRI and correlations with PET. Synapse 36:57–65
16 Stein EA (2001) fMRI: a new tool for the in vivo localization of drug actions in the brain. J Anal Toxicol 25: 419–424
17 Zhang Z, Andersen A, Grondin R, Barber T, Avison R, Gerhardt G, Gash D. (2001) Pharmacological MRI mapping of age-associated changes in basal ganglia circuitry of awake rhesus monkeys. Neuroimage 14: 1159–1167
18 Raichle ME (1987) Circulatory and metabolic correlates of brain function in normal humans. In: Mountcastle VB' Plum F, Geiger SR (eds) Handbook of physiology - the nervous system. American Physiological Society, Bethesda, pp 643-674
19 Malonek D, Grinvald A (1996) Interactions between electrical activity and cortical micro circulation revealed by imaging spectroscopy- implications for functional brain mapping. Science 272:551-554
20 Thulborn, K. R., Waterton, J. C., Matthews, P. M. and Radda, G. K. Oxygen Dependence of the Transverse Relaxation Time of Water Protons in Whole Blood at High Field. Biochim. Biophys. Acta. 1982; 714, 265-270.
21 Ogawa, S., Lee, T. M., Nayak., A. S. and Glynn, P. Oxygenation-Sensitive Contrast in Magnetic Resonance Image of Rodent Brain at High Magnetic Fields. Magn. Reson. Med. 1990; 14, 68-78.
22 Ogawa, S. and Lee, T. M. Magnetic Resonance Imaging of Blood Vessels at High Fields: In Vivo and in Vitro Measurements and Image Simulation. Magn. Reson. Med. 1990; 16, 9-18.
23 Ogawa, S., Lee, T. M., Kay, A. R. and Tank, D. W. Brain Magnetic Resonance Imaging with Contrast dependent on Blood Oxygenation. Proc. Natl. Acad. Sci. USA 1990; 87, 9868-9872. 24 Turner, R., Le Bihan, D., Moonen, C. T. W., Despres, D. and Frank,
J. Echo-Planar Time Course MRI of Cat Brain Oxygenation Changes. Magn. Reson. Med. 1991;22, 159-166
Part II. Clinical applications of MRI
70
25 Fox, P. T., Raichle, M. E., Mintun, M. A. and Dence, C. Nonoxidative Glucose Consumption During Physiologic Neural Activity. Science 1988; 241, 462-464.
26 Villringer, A., Planck, J., Hock, C., Schleinkofer, L. and Dirnagl, U. Near Infrared Spectroscopy (NIRS): A New Tool to Study Hemodynamic Changes During Activation of Brain Function in Human Adults. Neurosci. Lett. 1993; 154, 101-104
27 Ogawa, S, Tank, D. W., Menon, R., Ellermann, J. M., Kim S. G., Merkle, H. and Ugurbil, K. Intrinsic Signal Changes Accompanying Sensory Stimulation: Functional Brain Mapping with Magnetic Resonance Imaging. Proc. Natl. Acad. Sci. USA 1992; 89, 5951-5955
28 Ernst, T. and Hennig, J. Observation of a Fast Response in Functional MR. Magn. Reson. Med. 1994; 32,146-149.
29 Fox PT, Raichle ME (1985) Stimulus rate dependence of regional cerebral blood flow in human striate cortex, demonstrated by positron emission tomography. J Neurophysiol 51:1109-1120 30 Kwong KK, Belliveau JW, Chester DA, Goldberg IE, Weisskoff RM,
Poncelet BP et at (1992) Dynamic magnetic resonance imaging of human brain activity during primary sensory stimulation. Proc Natl Acad Sci USA 89:5675-5679
31 Regan D (1977) Steady-state evoked potentials. J Opt Soc Am 67:1475-1489
32 Movshon JA, Thompson ID, Tolhurst DJ (1978) Spatial and temporal contrast sensitivity of neurons in areas 17 and 18 of the cat's visual cortex. J Physiol (Lond) 283:101-120
33 Kwong KK, Chesler DA, Weisskoff RM et al (1995) MR perfusion studies with T1-weighted echo planar imaging. Magn Reson Med 34:878-887
34 Kim S-G, Tsekos NV, Ashe J (1997) Multi-slice perfusionbased functional MRI using the FAIR technique: comparison of CBF and BOLD effects. NMR Biomed 10:191-196
35 Zhu XH, Kim SG, Andersen P, Ogawa S, Ugurbil K, Chen W (1998) Simultaneous oxygenation and perfusion imaging study of functional activity in primary visual cortex at different visual stimulus frequency: quantitative correlation between dynamic BOLD and CBF changes. Magn Reson Med 40:703-711
36 Kim SG, Ugurbil K (1997) Comparison of blood oxygenation and cerebral blood flow effects in fMRI: estimation of relative oxygen consumption change. Magn Reson Med 38:59-65
37 Kim SG (1995) Quantification of relative cerebral blood flow change by flow-sensitive alternating inversion recovery (FAIR) technique: application to functional mapping. Magn Reson Med 34:293-301 38 Yarowsky P, Ingvar DH (1981) Neuronal activity and energy
metabolism. Fed Proc 40:2353-2363
39 Kerskens CM, Hoehn-Berlage M, Schmitz B, Busch E, Bock C, Gyngell ML et at (1996) Ultrafast perfusion-weighted MRI of functional brain activation in rats during forepaw stimulation: comparison with T2*-weighted MRI. NMR Biomed 8:20-23
40 Leniger-Follert E, Hossmann KA (1979) Simultaneous measurements of microflow and evoked potentials in the somatomotor cortex of the cat brain during specific sensory activation. Pflugers Arch 380:85-89
41 Gyngell ML, Bock C, Schmitz B, Hoehn-Berlage M, Hossmann KA (1996) Variation of functional MRI signal in response to frequency of somatosensory stimulation in a-chloralose anesthetized rats. Magn Reson Med 36:13-15
42 Menon RS, Ogawa S, Tank DW, Ugurbil K (1993) 4 Testa gradient recalled echo characteristics of photic stimulation-induced signal changes in the human primary visual cortex. Magn Reson Med 30:380-386
43 Bandettini PA, Wong EC, Jesmanowicz A, Hinks RS, Hyde JS (1994) Spin-echo gradient-echo EPI of human brain activation using BOLD contrast: a comparative study at 1.5 T. NMR Biomed 7:12-20
44 Ernst, T. and Hennig, J. Observation of a Fast Response in Functional MR. Magn. Reson. Med. 1994; 32,146-149.
45 Bandettini, P. A., Wong, E. C., Hinks, R. S., Tikofsky, R. S. and Hyde, J. S. Time Course EPI of Human Brain Function During Task Activation. Magn. Reson. Med. 1992; 25,390-397.
46 Turner, R., Jezzard, P., Wen, H., Kwong, K. K., Le Bihan, D., Zeffiro, T. and Balaban, R. S. Functional Mapping of the Human Visual Cortex at 4 and 1.5 Tesla Using Deoxygenation Contrast EPI. Magn. Reson. Med. 1993 29,277-279.
47 Lee, T. H and Hu, X. Retrospective Estimation and Correction of Physiological Artifacts in fMRI by Direct Extraction of Physiological Activity from MR Data. Magn. Reson. Med. 1996 35,290-298.
48 Gao, J. H., Miller, I., Lai, S., Xiong, J. and Fox, P. T. Quantitative Assessment of Blood Inflow Effects in Functional MRI Signals. Magn. Reson. Med. 1996; 36,314-319.
Part II. Clinical applications of MRI
72
49 Bandettini, P. A., Jesmanowicz, A., Wong, E. C. and Hyde, J. S. Processing Strategies for Time-Course Data Sets in Functional MRI of the Human Brain. Magn. Reson. Med. 1993; 30,161-173.