29
Chapter 4
Results and discussion
4.1 PGSPCL
4.1.1 PGSPCL FOAM
4.1.1.1 Porosity
After theoretical calculation of porosity we obtain different grade of porosity. For PGSPCL (ratio 2:1) foam we tested different concentration of solution to evaluate the best one taking into consideration different parameters as handling characteristics, mechanic characteristics porosity. To calculate the porosity we used the formula
(1,138 −1,138𝑊
𝑉 ) ∗ 100 where W is the weight and V is the volume.
68 83 91 93 97 0 10 20 30 40 50 60 70 80 90 100 pgspcl 30% pgspcl 15% pgspcl 6% pgspcl 3% pgspcl 1%
Porosity
Graphic 1: POROSITY PGSPCL30
As a result we obtained that the PGSPCL 1% foam is the most porous sponge, but we choose to our experimental study the PGSPCL 3%. This choice because the 1% foam was impossible to manage; it was too delicate and with a lot of crack, probably due to low concentration of polymer that determines the high level of porosity.
4.1.1.2 SEM Scanninng
60 mic 27 micron 58 micron 22 micron Picture 1: SEM SCANNING PGSPCL 30%31
To validate the theoretical calculation of porosity is necessary to carry out further studies. The first analysis we did is SEM scanning.
As a result of SEM we obtained that all sponges have two types of pores due to the 18 micron
32 micron
62 micron 10 micron Picture 3: SEM SCANNING PGSPCL 3%
32
different types of freezing (between 60µm and 10µm). The porosity is more homogeneous in 3% and 1% foams and it is possible to see a better distribution of the polymer.
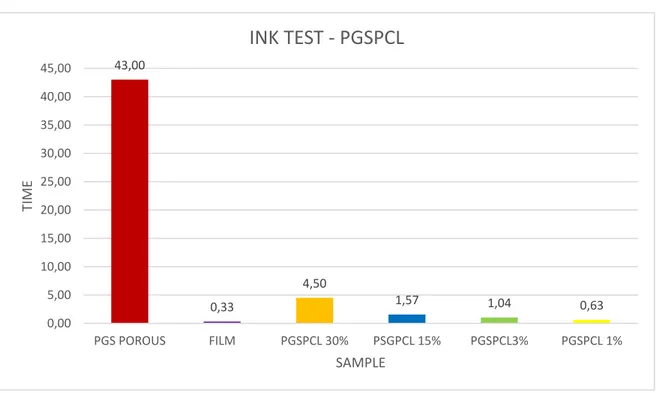
4.1.1.3 Ink test
The ink test we performed confirm the theoretical calculation and SEM scanning. As a control for this test we used a porous PGS scaffold. The presence of PCL in the scaffold increases the porosity, regardless of concentration; however is possible to see a greater degree of porosity in a scaffold with low concentration of polymer according with previous characterization analysis.
43,00 0,33 4,50 1,57 1,04 0,63 0,00 5,00 10,00 15,00 20,00 25,00 30,00 35,00 40,00 45,00 PGS POROUS FILM PGSPCL 30% PSGPCL 15% PGSPCL3% PGSPCL 1% TIME SAMPLE INK TEST - PGSPCL
33
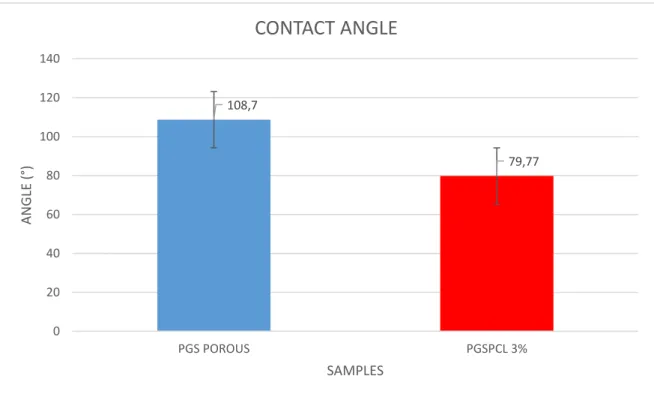
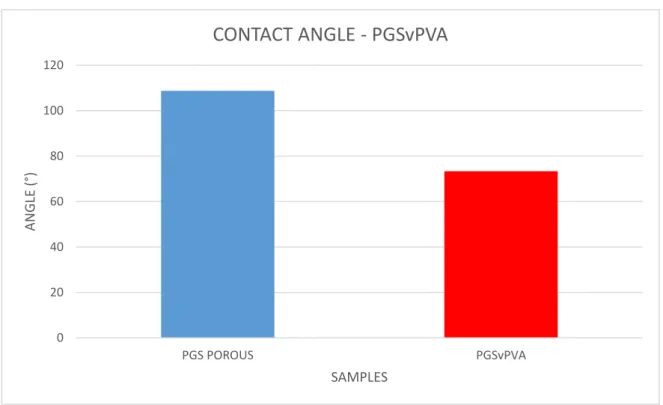
4.1.1.4 Contact angle
To measure the wettability of the sample we carried out the contact angle (CA) test. If the θ value is 0° 0 <θ<90° the material has a high wettability coefficient; if 90° <θ<180° the material has a low wettability.
As expected the PGS scaffolds has a CA major than 90°. The PGSPCL showed a CA inferior than 90° due to PGS presence in the blend. This is really good result to interaction for the probably future interaction with human body fluid.
108,7 79,77 0 20 40 60 80 100 120 140 PGS POROUS PGSPCL 3% ANGLE (° ) SAMPLES CONTACT ANGLE
34
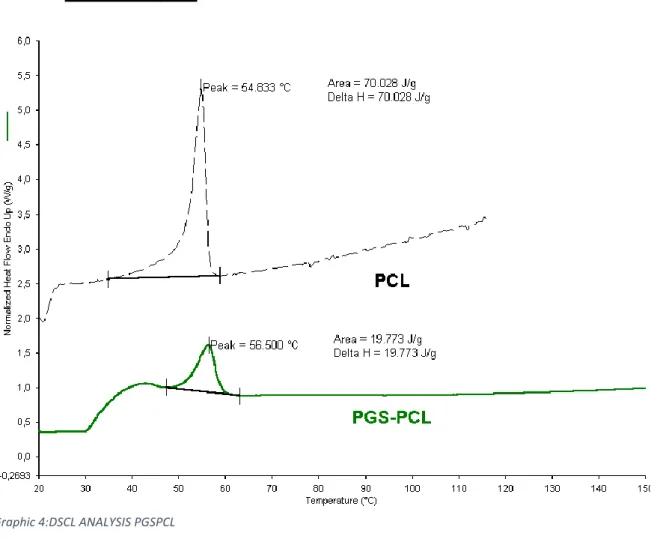
4.1.1.5 DSC analysis
The thermal analysis was conducted between 20°C and 150°C. It is possible to see in the thermogram the typical peak of PCL; the Tm results slightly increased while is possible to see a little bit reduction of enthalpy associated with to fusion process, after normalization of PCL content of the blend. This should be due to a concentration of polymer and the interaction with PGS. It is impossible to see in this thermogram the typical peak of PGS because this peak is visible by starting the analysis from -20°C Graphic 4:DSCL ANALYSIS PGSPCL
35
36
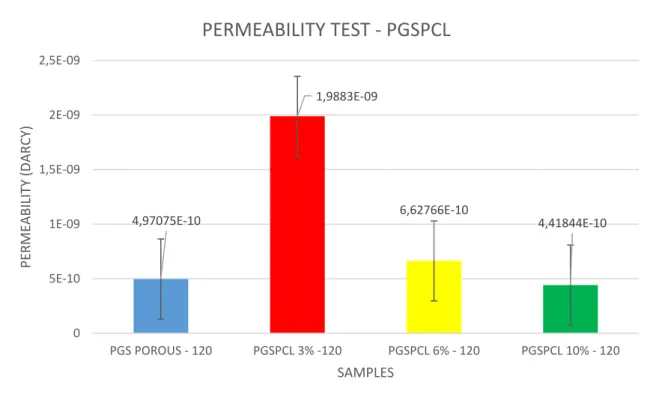
4.1.1.6 Permeability test
As reported the results of permeability test at 120mmHg for different types of scaffolds.
As results we obtained with increasing porosity the value of permeability to water became higher. The value of permeability was expressed in Darcy, calculated by darcy formula. 4,97075E-10 1,9883E-09 6,62766E-10 4,41844E-10 0 5E-10 1E-09 1,5E-09 2E-09 2,5E-09 PGS POROUS - 120 PGSPCL 3% -120 PGSPCL 6% - 120 PGSPCL 10% - 120 PERM EABILITY (D AR CY) SAMPLES PERMEABILITY TEST - PGSPCL
37
4.1.1.7 Degradation studies
To use scaffold in a human body is necessary to perform also a degradation study to understand how the scaffold can theoretically interact with the body fluid.
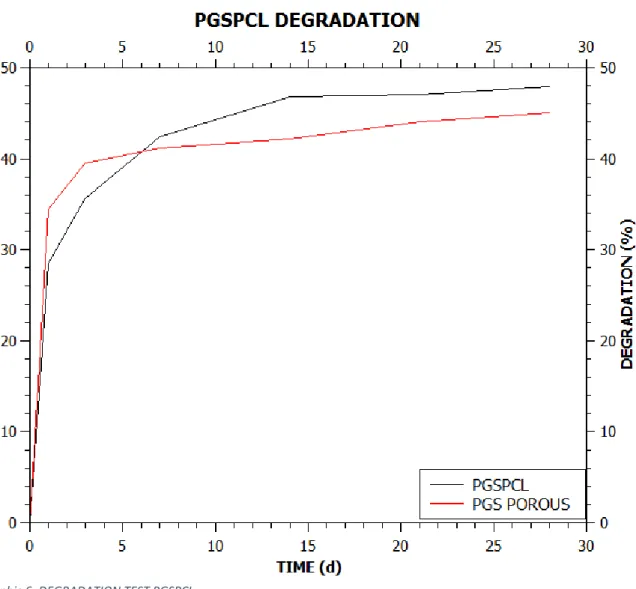
To carry out the study of degradation we incubated the selected sample (PGSPCL 2:1 3% w/v) in a PBS solution. As a control we used a porous scaffold of PGS.
Both samples shows initial superimposable dependence (time 1d) losing about 30% Graphic 6: DEGRADATION TEST PGSPCL
38
in weight. The control sample lost another 10% by the 2nd day to arrive to plateau with about 45% overall loss.
Different is the behaviour of the PGSPCL blend. After the first day, the sample continues to lose weight gradually to 14th day to arrive to plateau with about 48% overall loss.
4.1.1.8 FTIR Analysis
To understand if after degradation our scaffold undergoes to some chemical modification we did a FTIR analysis. We carried out the analysis at different time before and after degradation. As a control we used PGS porous scaffold.
39
During the hydrolysis polyester process, the ester bond is broken giving rise to a carboxylic group and hydroxyl group.
The infrared spectroscopic analysis allows to follow the hydrolysis, valuating the peak at 1600 cm-1 (COOH/COO-) and the peak, due to the stretching of OH, between 4000-3000 cm-1.
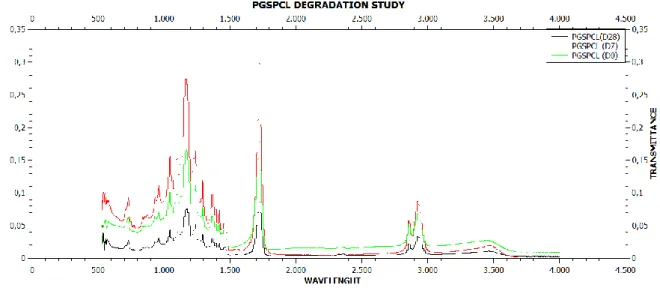
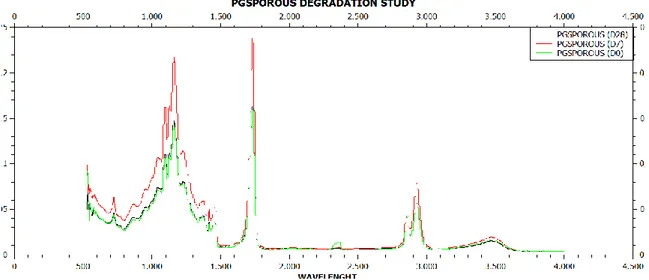
The analysis was carried out on the sample PGSPCL (ratio 2:1, 3% w/v) and PGS porous as a control, with incubation time in PBS solution 0, 7, 28 days.
Is possible to see a small peak at 3000 cm-1 due to OH groups esterification; this peak Graphic 8: FTIR ANALYSIS PGS POROUS
40
is particularly evident in D28 scanning and completely absent in D0 scanning. In a control are not evident significant variations of the spectrum increasing of incubating time in PBS.
The presence of PCL in the sample seems to favour the hydrolysis process of the sample.
The fundamental peaks of PGS and PCL remain unchanged.
The increase of degradation is confirmed of variation of pH of PBS solution, as reported in the table.
DAY Ph 0 7.01 1 6.98 3 6.57 5 6.36 7 6.04 14 5.73 21 5.54 28 5.47
41
4.1.2 Electrospinning
4.1.2.1 SEM scanning
10 micron 5 micron 16 micron 18 micronPicture 5: SEM SCANNING PGSPCL LINE GEOMETRY
42
32 micron 32 micron 50 micron
100 micron
Picture 8: SEM SCANNING PGSPCL SQUARE GEOMETRY
43 197 micron
196 micron 100 micron
100 micron
Picture 9: SEM SCANNING PGSPCL STAINLESS STEEL SIEVE GEOMETRY
44
Are reported the pictures obtained with the SEM scanning of electrospun PGSPCL (ratio 2:1, 15% in DCM w/v).
The technique of fabrication permitted to obtain different morphologies spinning the fibers on silica support laser-printed with different geometry and a stainless steel sieve.
As a result of SEM analysis it is possible to see in the first two samples a good distribution of the fibres on the silica surface. The fibres create a geometry following the silica support printing. We obtained two different geometries:
Line geometry
Square geometry
The geometry of “square scaffold” consists of “MAIN SQUARE” 100x100 micron. In the “MAIN SQUARES” are contained four smaller “SECONDARY SQUARES” with dimension 32x32 micron. The space between the “MAIN SQUARES” is 50 micron, the space between the “SECONDARY SQUARES” is 12micron.
45
to see a good distribution of the fibres on the support. The space between each line is around 16 – 18 micron and we obtained a porous scaffold with a pores dimension around 10 micron.
About the third experiment with an electrospinning technique we didn’t obtained a fibres but we obtained at the same way a geometry. The reason why we have not got a geometry is because we changed the electrospinning parameter from 15kV (ideal voltage to create fibres for PGSPCL blend) to 20 kV. Most probably we, also, didn’t obtain a fibers scaffold because we used a stainless steel sieve as a collector and the stainless steel is not a good conductor of electricity, this may have altered the electric field form and influenced the result of the spinning. Anyway we decided to use this scaffold because the geometry we obtained is, more probably, a good geometry for cell attachment.
46
4.1.2.2 Cell tests
55 micron 34 micron 22 micron 40 micronPicture 11: CELLS ADHESION TEST - STAINLESS STEEL SIEVE GEOMETRY
47
Are reported the results of adhesion cellular tests carried out on all the three different geometry.
As a result of cell adhesion tests is possible to say that the scaffolds are not toxic for C2C12 mice’s myoblast cells. The cells can be attach on the surface of the scaffold and can propagate normally.
About the geometry is impossible to determine if the cells follows a determinate line 29 micron
13 micron 88 micron
48
to orientate themselves. Therefore seems that there’s no dependence between cellular orientation and surface geometry for all the microfabricated scaffolds.
It seems possible observing in the case of “LINE GEOMETRY” higher cellular density and the presence of elongated morphology cells.
49
4.2 PGS foam via PVA template
4.2.1 Porosity
After theoretical calculation of porosity we obtain different grade of porosity. For PGS foam we tested different concentration of solution to evaluate the best one taking into consideration different parameters as handling characteristics, mechanic characteristics porosity.
To calculate the porosity we used the formula (1,138 −1,138𝑊
𝑉 ) ∗ 100 where W is the
weight and V is the volume of the sample.
The best ratio volume/concentration of PGS solution resulted to be 50 µL of 20%
50 93 98 82 0 10 20 30 40 50 60 70 80 90 100 PGS 200 PGS 100 PGS 50 PGS POROUS PORO SITY (%) SAMPLE
PGS VIA PVA - POROSITY
50
(w/v) solution of PGS in DCM put drop by drop in foam of PVA foam with 1,2 mL volume. With this concentration, after leaching, we obtained a PGS foam with 98% porosity.
4.2.2 SEM Scanning
Picture 15: SEM SCANNING - PGS 200µL PVA 1.2 mL
51
The pictures reported shows the morphologies obtained dropping different amount of solution of PGSPCL (ratio 2:1, 20% w/v in DCM)
The SEM analysis has confirmed our theoretical studies about porosity.
The PGS foam with 50 µL of solution results more homogeneous than the other two regarding the distribution of polymer and with a homogeneous distribution and pores size.
This results confirm the data obtained with theoretical porosity calculation. 150 micron
119 micron
52
4.2.3 Ink test
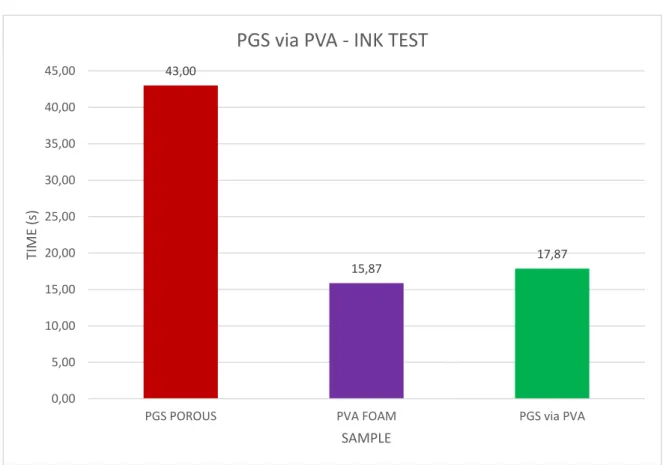
To have another confirmation about the porosity of scaffold we carried out also the ink test.
As a control we used a PGS porous scaffold and a PVA foam. The porosity of PGSvPVA is comparable with the porosity of pure PVA stamp used or fabrication of scaffold 43,00 15,87 17,87 0,00 5,00 10,00 15,00 20,00 25,00 30,00 35,00 40,00 45,00
PGS POROUS PVA FOAM PGS via PVA
TIME (s)
SAMPLE
PGS via PVA - INK TEST
53
4.2.4 Contact angle
The porous PGS sample that we used as a control showed an expected hydrophobic behaviour and then a θ angle major than 90°. The PGSvPVA foam has a strange result because the foam should show also a hydrophobic behaviour due to PGS and similar to control, but the samples have a θ angle minor than 90° and then the material is hydrophilic. Maybe this behaviour is due to PVA that has react with PGS or has not been fully leached out.
0 20 40 60 80 100 120 PGS POROUS PGSvPVA ANGLE (° ) SAMPLES
CONTACT ANGLE - PGSvPVA
54
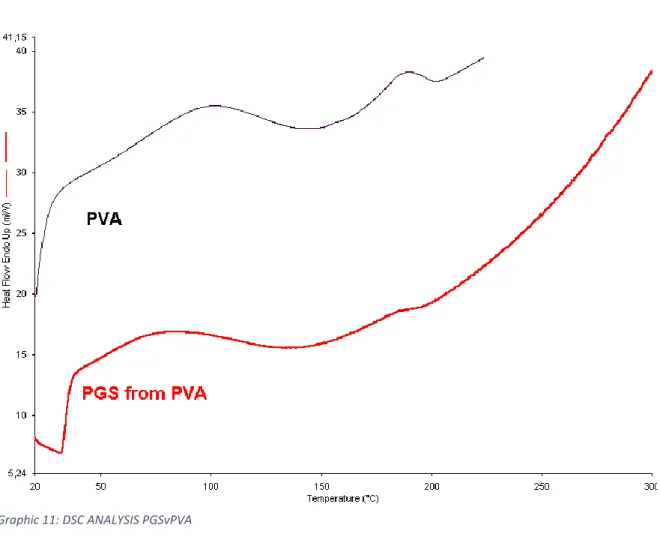
4.2.5 DSC Analysis
Is reported the thermogram relative to the sample PGSvPVA. Is evident the presence of a little endothermic event between 150°C and 200°C due to the presence of residual PVA in the scaffold. This event results at lower temperature than pure PVA due to probable interaction between PVA and PGS.
55
4.2.6 Infrared spectroscopic analysis
Attenuated total reflectance (ATR) FTIR analysis.
Infrared spectra were acquired with a Perkin Elmer One FTIR Spetcrometer, equipped with ATR objective lens with a penetration depth of less than 1 micron. All spectra were obtained in the middle range (4000-1700 cm-1) with a resolution of 4 cm-1 and representing the average of 16 scans.
Infrared Imaging
Spectral images were acquired in µATR mode using the infrared imaging system
4000.0 3600 3200 2800 2400 2000 1800 1600 1400 1200 1000 800 650.0 c m-1 %T PGS on PVA PVA PGS
56
Spotlight 300 (Perkin Elmer). The spectral resolution was 4 cm-1. The spatial resolution was 100x100 µm. Background scans were obtained from a region of no sample. IR images were acquired with LN cooled mercury cadmium telluride line detector composed of 16 pixel elements. Each absorbance spectrum composing the IR images, and resulting of 16 scans, as recorded for 16 pixel in the µATR mode using Spotlight software. Spectra were collected by touching the ATR objective on the sample and collecting the spectrum generated from the surface layer of the sample. The spotlight software, used for the acquisition was also used to pre-process the spectra. IR spectral images were produced by using the absorbance in a given frequency range, 4000-720 cm-1. Spectra contained in the spectral images were analysed using a compare correlation image. The obtained correlation map indicates the areas of an images where the spectra are most similar to a reference spectrum. As a result of FTIR analysis is possible to say that the increase of the band at 1087 cm-1 and of the band between 3000-4000 cm-1 is diagnostic of the PVA presence in the sample.
57
a spectral-calculator in the computer software.
As a result of this comparison is possible to foresee a quantity of PVA less than 5% in the PGS matrix.
As a result of chemical imaging analysis is possible to see the correlation map with the middle spectrum in the range of the absorption of PVA.
The correlation value is near to one (1) almost in all the surface. This result show a
4000.0 3600 3200 2800 2400 2000 1800 1600 1400 1200 1000 800 650.0
c m-1 %T
PGS on PVA
spectral calculator 5/95
58
homogeneous distribution of residual PVA in PGS matrix.
The typical spectrum of material show the presence of a absorption band near 1425 cm-1. This peak is, maybe, due to esteric bond between OH terminal group of the sebacic acid and OH group of PVA. The PVA should be remain anchored to PGS Graphic 14: IMAGING MAPS - PGSvPVA
59
cross-linked matrix.
This can be explain the partial elimination of PVA during the leaching.
4.2.7 Degradation studies
To use the scaffold in a human body is necessary to perform also a degradation studies to understand how the scaffold can theoretically interact with the body fluid and with the tissue which it comes into contact.
To carry out the study of degradation we used a PBS solution. As a control we used a porous scaffold of PGS.
As already described the PGS porous scaffold shows an initial degradation phase which is rapid and goes rapidly to a plateau, losing after 30 days about 45% in weight in weight. The sample of PGSvPVA shows an unusual slow trend followed by “step
60
phase” losing 60% initial weight. It is possible conjecturing that, the presence of PVA linked to PGS matrix, favors the absorption of water also in the inferior layers of the sponge promoting the hydrolytic degradation process of the sample.
The hydrolysis process was followed thank trough FTIR-ATR technique as reported in picture “GRAPHIC 17” that show the spectrum relative to the sample PGSvPVA obtained with different time of incubation in PBS, respectively 0,7,14,21 days.
The interested groups of hydrolysis process are the ether group and OH group. For this reason using the software were quantified the rapport between the intensity of the band of groups mentioned above and the band of CH group, because CH is a group not significantly interested by hydrolysis.
5359.0 5000 4000 3000 2000 1500 1000 500 0 -500 -709.0 c m-1 %T t=0 t=1 day t=7 days t=14 days t=21 days PGS on PVA 1565.79 3353.07 1565.79 3353.07 1565.79 3353.07 1565.79 3353.07 1565.79 3353.07
61
The graph of COOH/CH relationship show a gradual decrease with increasing time (d) of hydrolysis. On the contrary the relationships COO-/CH and OH/CH shows a growing trend.
In all the cases the relationships tends to plateau. The results are, therefore, indicatives of a gradual degradation of ester groups by hydrolysis process. The results and the plateau finally according with a gravimetric dates obtained.
Graphic 188: RELATION RCO/CH
Graphic 19: RELATION RCOO-/CH