Chapter 4
Results and General Discussion
4.1 Introduction
In this Chapter the experimental results gathered during the analysis of the manufactured specimens will be listed and discussed. The Chapter is divided into two parts:
Part 1: Phase stability analysis Part 2: ESEM and EDS analysis.
The first part is then divided into two sections according to the nature of the ceramic material (7YSZ TBCs and 7YSZ TBCs doped with Dy2O3 or Gd2O3)
while the second part shows the results of the microstructural analysis of 7YSZ. In Part 1 the XRD spectra are limited to the 2θ range wherein the major changes occur: the complete spectra are reported in Appendix II. Diagrams comparing more than one spectrum are often presented; in this case, on each pattern, the sample thermal history is reported. Namely the heat treatment temperature, the total ageing time in hours and, in brackets, the last cycle duration are indicated. In order to allow an easier reading of the chapter, instead of the complete indication for the different alumina grades, same abbreviations will be used:
• PC96 Alumina polycrystal (96%)
• PC99 Alumina polycrystal (99.5%)
Part 1:
Phase stability analysis
4.2 7YSZ TBCs
4.2.1 As-deposited 7YSZ TBCs
4.2.1.1 XRD analysis
No material with the chemical composition of 7YSZ TBCs is listed in the XRD diffraction database (supplied by the JCPDS-International Centre for Diffraction Data) which is commonly used as a reference for unknown materials. The patterns reported in the literature are often limited to a partial 2θ range thus our first aim was to have a reference pattern for our standard TBC between 20° and 90°. 7YSZ powder (Fig. 4.1) was used as a reference scan for this purpose. A powder target is really a conglomeration of many tiny crystals randomly oriented thus, for each possible Bragg diffraction angle there are crystals correctly oriented for Bragg diffraction to take place (see section 3.7).
In the powdered, as-deposited 7YSZ the structure tetragonality is clearly evident; in fact, except for the (111)t peak (which does not split), the diffraction peaks of
the tetragonal phase show a distinct peak splitting due to a lowering in crystal symmetry in comparison to the fluorite-type diffraction pattern (Fig. 4.1).
The comparison between the XRD patterns of the as-deposited coatings and the powder spectrum above suggests that all the 7YSZ samples have a single metastable tetragonal phase (t’) although it has to be noted that, due to the growing mechanism, the EB-PVD TBCs are characterised by textured grains (namely the XRD pattern exhibits only one or few peaks instead of the several ones obtained analysing powdered specimens).
No significant differences are observed for the different substrate materials adopted. The XRD analysis, conducted on 68 7YPSZ samples produced in 5 different runs, show that ~59% of the coatings present a (200) fibre texture, ~12% a (311) fibre texture, while the remaining specimens present a (311) and (200) mixed orientations, although the (200) peak is generally predominant. The crystallographic texture is strongly dependent on the deposition temperature (Heydt, Luo, and Clarke, 2001), and at the deposition temperature adopted in this work (between 900 and 1015°C, see section 3.5) the (200) orientation is normally expected. Since all the samples with a (311) orientation are coated during the same deposition process, such structure may depend on a temporary stop of the rotation mechanism that occurred by accident in the coating chamber.
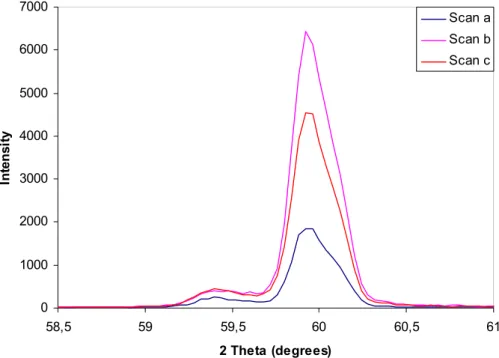
0 1000 2000 3000 4000 5000 6000 7000 58,5 59 59,5 60 60,5 61 2 Theta (degrees) In te n sit y Scan a Scan b Scan c
Fig. 4.2: Variation of the (311) peak intensity across a mixed fibre sample.
More complex is the explanation of the structure revealed by samples with a mixed fibre. On these samples several XRD analysis were conducted changing both the examined area across the sample surface and the sample orientation respect to the x-ray incident beam. This was done by rotating the sample with a 30° angular step around the central specimen axis. Each scan reveals an extremely variable percentage of crystallographic texture (expressed by the intensity of each peak): depending on the studied area, sometimes two peaks are
detected, some others only one of them. Fig. 4.2 shows the extent of the (311) peak intensity reduction obtained by moving the x-ray beam on three areas (a, b and c) across the specimens. The scans also demonstrate that a decreasing of the (311) peak always corresponds to an increase in the (200) peak in the mixed fibre samples. The ESEM on the top surface and cross section of these samples will explain the reason of such behaviour (see Part 2).
4.2.2 Heat-treated 7YSZ TBCs
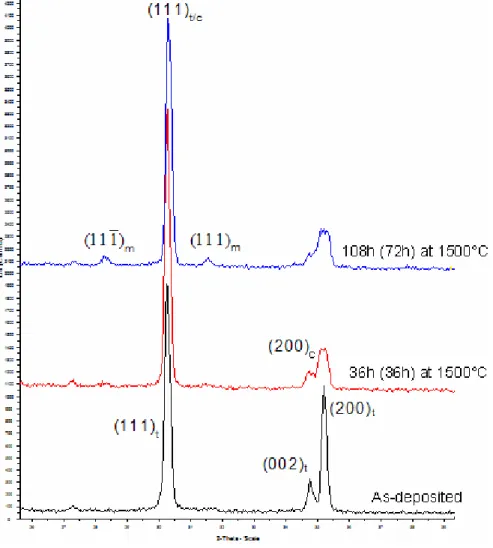
The XRD analysis on 7YSZ powdered shows that, as the ageing time increases, the initial metastable tetragonal phase of the as-deposited coating is progressively replaced by a monoclinic structure.
Fig. 4.3: XRD patterns for 7YSZ as-deposited and after two stages in the heat treatment. t’ denotes the (200)/(002) tetragonal peaks, c the
(200) cubic peak and m the (111) monoclinic peaks.
In the 7YSZ powder, the characteristic (111)m and (111)mmonoclinic peaks develop after 108 hours of thermal exposure at 1500°C. The development of a monoclinic structure also brings the higher diffraction peaks clearly to split into
three or more separate peaks. It is impossible, at this stage of ageing, to distinguish the higher-order diffraction monoclinic peaks from the pattern noise even using a logarithmic scale for the intensity. This is due to the small percentage of monoclinic structure. Even if such structure is evident only after 108 hours, pre-transition changes are already noticeable in the 2θ≈35° region in Fig. 4.3, wherein an intermediate peak, identified as the (200) reflection of the cubic phase, is observed after 36 hours at 1500°C. The monoclinic phase does not appear concurrently with the first observation of the cubic peak, presumably because the associated depletion of Y from the t’ phase is still insufficient to render it transformable.
Fig. 4.4: XRD scans for 7YSZ deposited on PC96 depicting the region of {311} monoclinic/tetragonal peaks.
The 7YSZ TBCs, deposited on PC96, show a rapid phase transformation. Even at the lowest ageing temperature (1450°C), the TBC is de-stable after 2 hours (Fig. 4.4); the volume fraction of the monoclinic structure (see section 3.7.2) at this stage reaches 16% increasing up to 81% after 4 hours (Table 4.1).
Ageing at 1500°C (Fig. 4.5) causes quicker de-stabilization: the monoclinic volume fraction, in fact, after 2 hours is already 71% and after 9 hours, no more t’ structure is detectable (Table 4.1).
Fig. 4.5: XRD scans for 7YSZ deposited on PC96 depicting the region of {311} monoclinic/tetragonal peaks.
The destabilization in TBC deposited on PC96 after 9 hours at 1500°C is also confirmed by Raman spectroscopy (Fig. 4.6).
Material Ageing Temperature Total ageing time Xm 7YSZ on PC96 2 hours 16% 7YSZ on PC96 3 hours 36% 7YSZ on PC96 1450ºC 4 hours 81% 7YSZ on PC96 2 hours 71% 7YSZ on PC96 1500ºC 9 hours >90%
Table 4.1: Monoclinic phase volume fraction (Xm) on aged samples.
0 500 1000 1500 2000 2500 3000 3500 4000 4500 200 400 600 800 1000 Raman shift [cm^-1] In te n s it y As-deposited 9 hrs at 1500 C
Fig. 4.6: Raman spectra of TBC deposited on PC96.
7YSZ deposited on SX exhibits high resistance to partitioning: samples aged at 1450°C do not show any evidence of monoclinic phase even after 63 hours although, similarly to the previous sample on PC96, transition changes are noticeable after 45 hours in the 2θ≈35°region wherein an intermediate peak is observed. Due to the extreme resistance to partitioning observed for this material, experiments at this temperature are abandoned and further heat treatments for TBCs both deposited on PC99 and on SX will be conducted at 1500 and 1550°C. No ageing treatment has been conducted on TBCs deposited on PC99.
Direct comparison between TBCs deposited on the three different grades of alumina and all aged at 1500°C for 9 hours shows that coatings deposited on PC96 (Fig. 4.7a) does show clear evidence of monoclinic phase whereas coatings on PC99 and SX (Fig. 4.7b and Fig. 4.7c) do not. The first sign of destabilization will only be detectable, for such substrates, after 63 hours at 1500°C.
Further comparison between specimens obtained from PC99 and SX shows that there is a difference in terms of resistance to partitioning for coatings deposited
on these different substrates. This is clearly illustrated in Fig. 4.8 where the patterns generated by 7YSZ on PC99 and SX are plotted at five subsequent ageing stages. After 135 hours, TBCs deposited on PC99 show evidence of monoclinic structure with a monoclinic volume fraction of 36% whereas the coating on the single crystal is still completely stable.
Fig. 4.7 Direct comparison between TBCs deposited on three alumina grades: (a) 7YSZ TBC on PC96, (b) 7YSZ TBC on PC99, (c) 7YSZ TBC on SX.
The development of m-ZrO2 in PC99 deposited samples after 147 hours at
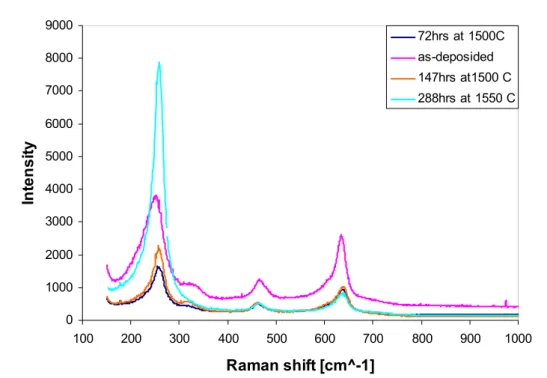
1500°C is also confirmed by Raman spectroscopy (Fig. 4.9). The same type of analysis confirms the barrier stability of samples deposited on SX (Fig. 4.10) In order to find a limit to the partitioning resistance of the sample deposited on the single crystal, it was decided to increase the ageing temperature up to 1550°C and to keep the specimen in the furnace until complete destabilization occurred. During the process, intermediate XRD analyses were conducted to check the progress of the material structural development. The results of the experiment are summarised in Fig. 4.11 and Fig. 4.12 which represent the (400)t
peak evolution. It has to be noted that the apparent splitting of the (400)t,
reflection in the as-deposited pattern arises from the separation of Kα1 and Kα2,
Fig. 4.8: Direct comparison between TBCs deposited on PC99 and SX. 0 1000 2000 3000 4000 5000 6000 7000 150 250 350 450 550 650 750 Raman shift [cm^-1] Int e ns it y 147hrs at 1500 C As-deposited
0 1000 2000 3000 4000 5000 6000 7000 8000 9000 100 200 300 400 500 600 700 800 900 1000 Raman shift [cm^-1] In te n s it y 72hrs at 1500C as-deposided 147hrs at1500 C 288hrs at 1550 C
Fig. 4.10: Raman spectra of TBC deposited on SX.
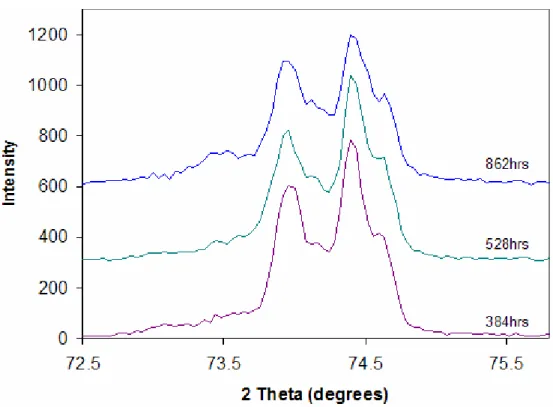
After 18 hours at 1550°C the coating is still stable, a significant broadening at the base of the t’ (400) peak is observed. This is caused by the gradual diffusion of Yttria which allows a progressive replacement of the t’ by a mixture of Yttria-poor tetragonal phase and Yttria-rich tetragonal phase. The presence of such two ‘new’ phases is indicated by the main peak at ~74.3° splitting into two peaks. In order to follow the evolution of the Yttria-poor and Yttria-rich phases, the positions of such peaks have been followed during the ageing process and the result is plotted in Fig. 4.13.
Decomposition of t’ at 1550°C is initially rapid, with a clear separation into high and low Yttria content phases. While the behaviour of the Yttria-poor phase has, as expected, a regular trend and the relative peak keeps moving towards higher angles, the Yttria-rich phase, after the first 36 hours, abruptly changes its initial path and its peak starts shifting to higher angles too. Such behaviour is believed to depend on the fact that, in the Yttria-rich phase, the stabilizer content reaches, after 36 hours, the value corresponding, in the phase diagram, to the intersection between the isotherm for 1550°C and the curve T0(f/t”). The material, at this point,
develops, upon cooling, a t” phase which, in the following ageing cycles, follows path similar to the t’ phase.
The shapes of the curves also confirm that t’ evolution is a process controlled by Yttria diffusion.
The analysis of the whole XRD pattern (not shown) of the heat treated sample demonstrated that monoclinic phase formation occurred after 862 hours at 1550°C.
Fig. 4.11: (400)t peak evolution of heat treated 7YSZ deposited on SX.
74 74.1 74.2 74.3 74.4 74.5 74.6 74.7 74.8 0 100 200 300 400 500 600 700 800 900
Ageing Time (hours)
2 T h et a ( d eg rees)
Yttria rich phase Yttria pour phase
Fig. 4.13: Yttria-rich phase and Yttria-poor phase peak evolution upon ageing.
4.3 7YSZ TBC co-doped with Dy
2O
3or Gd
2O
34.3.1 As-deposited 7YSZ TBC co-doped with Dy
2O
3or Gd
2O
3As in the case of 7YSZ, the absence of complete diffraction patterns for co-doped TBCs in the literature was overcome by conducting a preliminary XRD analysis on powdered TBCs samples.
In Fig. 4.14 spectra of powdered TBCs co-doped with 1mol% of Dy2O3, 2mol% of
Dy2O3, 2mol% of Gd2O3 and 4mol% of Gd2O3 are shown and compared to the
XRD pattern obtained by analysing 7YSZ. In the same figure, the spectra are arranged according to the total percentage of stabilizer, from the lowest content at the bottom, to the highest at the top. In case two patterns are obtained from samples sharing the same dopant content, the smallest co-dopant ion will be placed below. Such arrangement shows that there is a progressive shift of the peaks position towards smaller angles and that such trend is connected to the stabilizer content or, when this is constant, to the stabilizer ionic radius. As a consequence the position of the peaks is basically linked to the level of stretch introduced into the coating lattice by co-dopant addition.
The samples doped with 1% of Dy2O3 (9.8mol% of RO1.5) exhibit a t’ phase
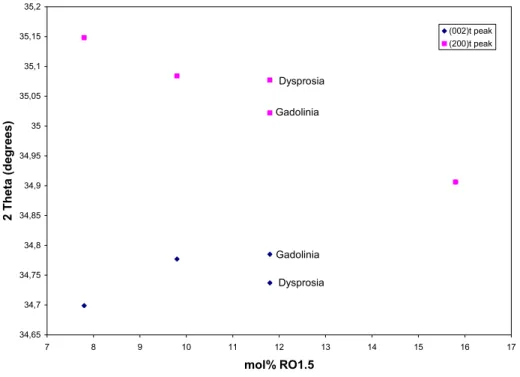
although, in their patterns, the splitting of the peaks, which is evident in the 7YSZ, become less clear. This tendency is followed also by the successive patterns and in the top curve splitting is not detectable anymore. The movement of the peaks and the regular trend they follow is highlighted in Fig. 4.15 where their position is plotted against the total stabilizer content.
Fig. 4.14: XRD scans for 7YSZ and co-doped Yttia-Gadolinia or Yttria-Dysprosia powdered TBC. The scans are organized from the bottom increasing
both the ionic radius and percentage of the co-dopant.
34,65 34,7 34,75 34,8 34,85 34,9 34,95 35 35,05 35,1 35,15 35,2 7 8 9 10 11 12 13 14 15 16 17 mol% RO1.5 2 The ta ( d egr ee s) (002)t peak (200)t peak Gadolinia Dysprosia Dysprosia Gadolinia
Fig. 4.16: (004) and (400) peaks in 7YSZ doped with different stabilizers.
The XRD analysis, conducted on 64 samples of 7YSZ co-doped either with Gadolinia or Dysprosia and produced in 4 different runs, shows that 100% of the coatings presents a (200) fibre texture.
The patterns obtained by analysing coatings deposited on alumina are shown in Fig. 4.16 limited to the angular range between 70° and 75°. The disappearance of the tetragonal peaks splitting observed for the powder samples is still evident and it depends on the presence of a (400)t’’ reflection between the (004)t and
(400)t peaks. Consequently the crystallographic structure of co-doped samples
results in a mixture of t’ and t’’ phase. The percentage of the latter progressively increases increasing the amount of stabilizer, reaching a value of 100% in as-deposited 7YSZ+4mol% Gd2O3 (see section 2.1.1).
4.3.2 Heat-treated 7YSZ TBC co-doped with Dy
2O
3or Gd
2O
3Ageing treatment was carried out only on co-doped coatings deposited on SX. After 386 hours at 1550°C, TBCs with total stabilizer content of 9.8% and 11.8% are still stable although, during ageing, the peaks evolve in a similar way to what already described in section 4.2.2 for 7YSZ deposited on SX. Also in this case, movement of the peaks demonstrates dopant diffusion throughout the barrier to reach an equilibrium state.
When 15.8% of dopant is added to the barrier composition and the resulting material is aged at 1550°C, the patterns stay unchanged throughout the heat treatment, even after 720 hours. This is believed to depend on the fact the point representing such composition at this temperature falls, in the phase diagram, in the cubic field and not anymore in the biphasic tetragonal+cubic field. This means that such a material would not be affected by partitioning any longer.
Part 2:
ESEM and EDS analysis
4.4 7YSZ TBCs
4.4.1 As-deposited 7YSZ TBCs
ESEM micrographs taken on the top surface of the samples with a mixed fibre texture reveal the presence of three different areas which are schematically illustrated in Fig. 4.17. The area indicated with ‘A’ is characterised by the rooftop morphology (Fig. 4.18) common in TBCs deposited with our EB-PVD process parameter. The well-defined facets at the top of the columns are clearly visible also in the area called ‘B’, although, here, they look as though they are ‘orientated’ in the same direction (Fig. 4.19). The area indicated with the ‘C’ shows both the previous features (Fig. 4.20). The micrographs taken on the cross section of samples cut along the direction indicated in red in Fig. 4.17 show the side view of the columnar microstructure. The size of the columns, both in the A (Fig. 4.21) and B (Fig. 4.22) area, at the TBC/bond-coat interface, is relatively small (<1µm) to increase towards the tip of the column where the grains size have an average dimension of about 5µm. The feathery structure and the inter-columnar and intra-inter-columnar porosity (see section 1.5) are also well discernable. The columnar grains orientation differentiates the A from the B area: in A the columns are perpendicular to the substrate while in B they are all leaning in the same direction. In Fig. 4.21 and Fig. 4.22 the growing direction is highlighted with a red continuous line.
XRD patterns show that the three areas are characterized by different predominant textures; in particular A has a fibre (200), B (311) and C both of them. After observations about the geometry of these areas it is believed that they are due to the ‘shadow’ of wing nuts used for the holder assembly. The shadow border is represented in Fig. 4.17 with a dotted line. During the deposition process, in fact, the holder rotates and such wing nuts cover some of the substrate surface changing, in those areas, the vapour flow incidence angle. The ESEM analysis conducted on the TBCs deposited on the three different grades of alumina also show that the nature of the substrate does not have any influence on the final coating microstructure. In fact, no matter what the adopted alumina grade was, samples characterised by a single texture -(200) or (311)- all over the surface share basically the same appearance of ‘A’ or ‘B’ area respectively.
Fig. 4.17: Schematic of the three regions the following micrographs are taken from. The red line represents the sample cutting direction.
Fig. 4.18: ESEM micrograph of 7YSZ showing the top surface of the area with a (200) texture (A).
Fig. 4.20: ESEM micrograph of 7YSZ showing the top surface of the area with a mixed texture (C).
Fig. 4.21: ESEM micrograph of 7YSZ showing the cross-section morphology in the (200) area (A).
Fig. 4.22: ESEM micrograph of 7YSZ showing the cross-section morphology in the (311) area (B).
4.4.2 Heat-treated 7YSZ TBCs
In general, the TBC microstructure changes considerably after heat treatment. Samples deposited on PC99 and SX share identical features whereas TBCs deposited on PC96 have some peculiar aspects.
Fig. 4.23: ESEM micrograph of 7YSZ on SX showing the coated top surface aged for 24h at 1500°C.
Fig. 4.24: ESEM cross section of TBC on SX aged for 24h at 1500°C.
Fig. 4.25: ESEM cross section of TBC on PC99 aged for 135h at 1500°C.
After a 24 hour long heat treatment at 1500°C sintering of columns has occurred in specimens deposited on SX and PC99. The very fine porosity present in the as-deposited material has coarsened considerably, although some very small isolated pores remain. The prominent ridges at the exterior of the columns shown in Fig. 4.21 and Fig. 4.22 have smoothed out, as clearly shown in Fig. 4.23 and Fig. 4.24, developing pronounced surface undulations. Along adjacent, closely-spaced columns, these undulations touch each other creating rows of
“necks” between the columns. Increasing the aging time up to 135 hours at 1500°C (Fig. 4.25) bridging of columns becomes so important that it leads to the formation of blocks of columns separated by large vertical cracks. The significant microstructure change implies that there is a considerable atomic mobility. The extensive surface area in the as-deposited structure, especially due to the feathery porosity, provides a large driving force for densification and pore restructuring; the fine pores in the as-deposited TBC have coarsened to several times their original size after heat treatment.
Sintering results in an overall larger apparent column diameter with more open boundaries when compared to the sample in the as-received conditions. It should also be noted that the pyramidal tops, which are a distinctive feature of EB-PVD TBCs, are no longer evident after sintering at 1500°C (Fig. 4.23).
ESEM investigations conducted on the cross section of the TBC deposited on PC96 reveal that, when such substrate is adopted, after only 2 hours at 1500°C it is already very difficult to recognise the pristine top coat microstructure. In fact the typical columnar organization has completely disappeared: the TBC now shows a granular structure with no more preferential orientation (Fig. 4.26). After 9 hours at 1500°C the coating appearance further evolved towards a globular structure in which volumes with round borders are separated by large and irregular interstitial spaces (Fig. 4.27).
Fig. 4.27: ESEM cross section of TBC on PC96 aged for 9h at 1500°C.
4.4.3 Cross section EDS
Energy Dispersive Spectroscopy (EDS) was employed to provide compositional information across the TBC-substrate border. Fig. 4.28 and Fig. 4.29 show the result of the analysis of 7YSZ deposited on PC96 before and after heat treatment respectively. Comparing the Silicon distribution profile in the two charts reveals that significant amount of such element moved from the substrate towards the coating layer during ageing. Such behaviour is clearly illustrated in Fig. 4.30. On the other hand, the analysis of the other elements profiles in Fig. 4.28 and Fig. 4.29 shows that no significant migration of Calcium, Zirconium and Aluminium occurred during the ageing process.
It is worth to note that, in theory, no Zirconium and Aluminium should be found in the substrate and in the coating respectively. Their presence reveals that a small amount of material managed to diffuse across the interface during the deposition process.
Fig. 4.31 illustrates the elements distribution in a sample of 7YSZ deposited on SX: in this case the EDS analysis reveals that neither Calcium nor Silicon is present in the studied samples. However, XRF analysis did detect the presence of less than 0.5wt% of Silicon and traces of Calcium (<400ppm) in the SX substrates.
The graph in Fig. 4.31 looks very similar to the one describing the behaviour of TBCs on PC99 and for this reason the latter will not be reported here. Similarly,
the XRF analysis revealed the presence of Silicon and Calcium in percentages not detectable by the EDS machine in PC99 substrates.
0 10 20 30 40 50 60 70 80 90 100 0 10 20 30 40 50 60 70 80 90 100 110 120 130 140 150 Micron Wt% Zr and Al 0 0,5 1 1,5 2 2,5 3 3,5 4 Wt% Si and Ca Zr Al Ca Si Coating Substrate
Fig. 4.28: EDS analysis on 7YSZ deposited on PC96 pre-heat treatment.
0 10 20 30 40 50 60 70 80 90 100 0 10 20 30 40 50 60 70 80 90 100 110 120 130 140 150 160 Micron Wt% Zr and Al 0 0,5 1 1,5 2 2,5 3 3,5 4 Wt% Si and Ca Zr Al Ca Si Coating Substrate
0 0,5 1 1,5 2 2,5 3 3,5 4 0 30 60 90 120 150 180 Micron Wt% Ca and Si Ca preHT Si PreHT Ca Aged Si Aged Coating Substrate
Fig. 4.30: Distribution profile of Calcium and Silicon in 7YSZ on PC96.
0 10 20 30 40 50 60 70 80 90 100 0 50 100 150 200 250 Micron Wt% Al and Zr Zr Ca Al Si Coating Substrate
Fig. 4.31: EDS analysis on 7YSZ deposited on SX pre-heat treatment.
4.5 Impurities effect
In the TBC world, damage due to Silica (SiO2) presence is mainly linked to a
from the external environment, containing, apart from SiO2, CaO, MgO, and
Al2O3. These oxides form a Calcium-Magnesium-Alumino-Silicate (CSMA) which
deposits on the hot surfaces of components in aircraft gas turbines and which melting point is TMCMAS ≈ 1240°C. When the TBC surface exceeds this
temperature, the excellent wetting characteristics of CMAS cause it to penetrate to a depth where TTBC = TMCMAS. Thereafter, upon cooling, it solidifies as a
fully-dense domain (Fig. 4.32). The modified thermo-mechanical properties of this region increase its susceptibility to spalling (Mercer, Faulhaber, Evans, Darolia, 2005).
Fig. 4.32: A schematic of a CMAS layer that forms on the TBC and penetrates once it melts. This layer develops a large compressive stress upon cooling to ambient temperature because of the expansion misfit with the substrate. Delamination may be induced near the base of the TBC if the energy release rate associated with the stress in the CMAS layer is high enough (Mercer, Faulhaber, Evans, Darolia, 2005).
Although TBC spallation is the most evident damage to the TBC from the presence of massive amount of deposit, Borom et al. recognise that CMAS also allows a preferential dissolution of Yttria from the YSZ that may be sufficient to shift the composition into a region associated with a self destructive tetragonal to monoclinic phase transformation. Electron microscope analysis found that both Y and Zr are present as solid solution components in the molten phase at a mole ratio of Y2O3/ZrO2 which is higher than the ratio in the original YSZ composition.
The enrichment of Y2O3 in the solid solution indicates that there is a selective
extraction of Y from the TBC material which can contribute to an undesirable destabilization of the tetragonal Zirconia phase (Borom, Curtis, Johnson, Peluso, 1996).
The TBC Yttrium depletion may explain the premature destabilization of TBCs deposited on PC96 in comparison to TBCs on SX observed in this work. It has to be noted that the experimental work conducted in this thesis did not involve the use of debris on TBCs; moreover the ingot adopted during the EB-PVD was the same for all the specimens. As a consequence the different TBC behaviour could be linked to the presence of contaminants which diffuse in the ceramic top coat from the alumina substrate.
At this point it is worth discussing the microstructural and chemical influences of impurities in sintered ceramic materials and in particular in Yttria stabilized Zirconia. This topic, in fact, has been often examined in the literature and analogies can be found between such materials and the samples analysed in this work.
Observation by Transmission Electron Microscopy (TEM) allows a number of workers to distinguish in many ceramic materials an amorphous grain boundary phase which is the result of sintering additives or powder impurities. Sintered YSZ is an example of material that has been found to always contain a residual glassy phase. This amorphous phase is SiO2 rich and is due to contamination
from two principal sources: SiO2 from the powder precursor (ZrSiO4) and SiO2
and Al2O3 from traditional milling media; other common impurities are alkali and
some transition metal oxides. Many of these impurities are immiscible with the bulk phase and are more stable on the free surface (Hughes, 1995). During sintering, these impurities accumulate/disperse at grain boundaries, react with each other and with the bulk matrix components (Zr, Y) to form a new phase. The melting point of the intergranular phase will depend on its composition but for various silicates usually observed in Zirconia-based ceramics it is between about 800 and 1500°C (Hughes, 1995).
Mecartney conducted a study on the effect of the amorphous grain boundary phase on YSZ sintering behaviour, comparing samples with the same grain size and Yttria content but containing different amounts of glassy phase. The amount of glassy phase was controlled by varying the milling time from zero to 9 hours. The dilatometry experiment, conducted on samples sintered in air for various times until the end point of densification was reached, shows that the specimens which had been milled were 99% dense even before the peak sintering temperature of 1400°C was reached. The times required, at sintering temperature of 1400°C, to sinter the powder to the end point of densification was 30 min for unmilled samples reducing to 1-2 min for milled samples. This improvement in densification can be related to the increased amount of silicate phase (Mecartney, 1987).
In the same study TEM analyses were conducted to evaluate the differences in the specimens microstructure. The morphology of YSZ grains in unmilled samples was polygonal and sharply faceted. The micrographs showed the presence of a thin amorphous layer coating the grain boundaries (Fig. 4.33). The chemical composition of this phase revealed that it was mainly SiO2 with some
Y2O3 and ZrO2 possibly present. The amount of glassy phase increased in the
milled samples where the extra glass was accommodated at the grain boundaries triple junctions. These pockets of glass contained 69-76% SiO2,
14-15% Al2O3 and 9-17% Y2O3. The bulk of this glassy phase came from
pulverization of the milling media, and the Y2O3 was scavenged from the ZrO2
powder. The grains presented round corners indicating little growth anisotropy for ZrO2 sintered in the presence of an excess liquid phase (Fig. 4.34). (Mecartney,
1987).
Fig. 4.33: Unmilled sample (TEM), 30 min at 1400°C, 600°C/h heating rate: (A) bright field, (B) in-focus grain boundary (Mecartney, 1987).
Fig. 4.34: Milled-1-h sample (TEM), 2 min at 1400°C. 600°C/h heating rate: (A) bright field, (B) under focus grain boundary (Mecartney, 1987).
Theunissen et al. studied the Yttrium segregation at the grain boundary interface in YSZ deliberately contaminated with Silicon. The samples, containing a percentage of Y2O3 between 2 and 15mol%, were sintered and subsequently
annealed at 600, 700 or 1000°C. In all the specimens annealed at 1000°C Yttrium enrichment of about 30at% to the surface was observed. This enrichment was independent of the crystal structure (cubic or tetragonal) or the bulk composition, suggesting that this concentration is a saturation value. As a consequence the Yttrium enrichment factor in the grain boundary region is much higher for materials containing lower amounts of Yttrium in the bulk phase. The
Yttrium enrichment factor in fact, increases from 1.5 to 7 for a YO1.5 content
decreasing from 26 to 4wt% (Theunissen, Winnubst, Burggraaf, 1989).
Chaim et al. worked on ZrO2-8 wt% Y2O3 samples sintered at 1600°C and cooled
in furnace. Due to the slow quenching the as-sintered material showed a uniform two-phase microstructure, consisting in large cubic grains dispersed in an array of small tetragonal Zirconia grains. During the following annealing treatments (conducted between 700 and 1400°C) the sample microstructure evolves towards the equilibrium consisting of a change in the volume fraction of the coexisting phases and in their Yttria content.
In the range of annealing temperatures adopted, the bulk diffusion is slow, thus the enrichment in Yttria content of the cubic Zirconia grains is accomplished by liquid-film migration involving the silicate grain-boundary phase. In fact, the grain boundary provides a high diffusivity path for Y2O3, allowing the cubic phase to
readjust its composition to the solvus value appropriate for the adopted annealing temperature (Chaim, Heuer, Brandon, 1986).
The substrate data sheet (see section 3.2) states that the PC96 substrate, as many sintered ceramic material, contains Silica, alkali and some transition metal oxides (this has also been confirmed by the XRF and EDS analysis on the same substrates). Such compounds segregate at the grain boundary reacting with each other during sintering and resulting as an amorphous alumino-silicate phase at the alumina grains boundary at ambient temperature. During the TBC heat treatment, due to the high temperature reached (1500°C), the glassy phase melts and diffuses in the TBC by means of capillary mechanism. In Fig. 4.27 the migration of the grain boundary liquid phase is clearly visible: here, in fact, the top coat/alumina interface has a very different appearance in comparison to TBC on PC99 or SX (Fig. 4.24 and Fig. 4.25). Besides the former columnar structure has now changed in white round volumes of Zirconia embedded in a dark phase which consists of solidified silicate phase.
In conclusion, it is the presence of the above cited impurities and, in turn, the formation of a liquid phase at high temperature that gives to sintering of TBCs on PC96 the typical features described so far. In fact, the peculiar aspects of coatings deposited on PC96 in terms of morphology, destabilization time and Yttria redistribution between grain boundary and material bulk, are believed to depend on the higher oxides content in such substrate when compared to PC99 and SX. On the other hand, although very similar in terms of impurities content, these two materials produced specimens with a very different behaviour upon ageing. This leads to the assumption that there must be some other factor that influences the destabilization time more than oxides presence in the substrate. It is believed that the smaller grain boundary surface available in SX for impurities segregation (in comparison to PC99) reduces glassy phase diffusion into the coating.


![Fig. 4.8: Direct comparison between TBCs deposited on PC99 and SX. 01000200030004000500060007000 150 250 350 450 550 650 750 Raman shift [cm^-1]Intensity 147hrs at 1500 CAs-deposited](https://thumb-eu.123doks.com/thumbv2/123dokorg/5691134.72564/9.892.130.764.143.801/direct-comparison-tbcs-deposited-raman-shift-intensity-deposited.webp)