Chapter 4
Results and General Discussion
4.1 Introduction
In this chapter the results of the mechanical and morphological characterization of the material will be presented. Also the results about the nanocomposite and laminates behaviour in each test will be discussed.
4.2 Moisture evaluation and Burn Off Test
Table 4.1 shows the moisture content of the two NC grades and the master batch. Powder form grades have moisture content coherent with the values certified by the suppliers whereas the master batch analysis yielded a result higher than expected.
Table 4.1: Moisture content
Moisture content Nanocor
I.30P Nanocor C.30P Southern Clay Cloisite 15A Evaluated 2.03% 0.34% 1.12% Expected <3% <0.2% <2%
4.2.1 Burn off test on raw materials
Table 4.2 shows the results of burn off test (BOT) on raw materials: in the first column the expected results (coming from the available technical data sheets of each material, see Appendices I, II, V) are listed. The second column shows the experimental values.
The Nanomer® content in C.30P stated by the supplier ranged from 40 to 50%1.
In order to have a more precise value, a “Certificate of Analysis” of our product lot was requested to Nanocor Technical Service (see Appendix II). The assessed NC loading was 50%. Since the mineral content of I.30P was 75%, the expected residue of the C.30P BOT was 37.5%. Nevertheless in all the tests performed on the master batch the result was always unexpectedly around 25%.
Table 4.2: Burn off test on raw materials
Theoretical residue content Residue left after burning
Polypropylene 0% 0% PolyBond 3200 0% 0% Nanocor I.30P 70-75% 74% Nanocor C.30P 35-37.5% 25% Southern Clay
Cloisite 15A Not declared 61.5%
Figure 4.1: Crucibles with C15A specimens before burning
Figure 4.2: Crucibles with I.30P Figure 4.3: Crucibles with C15A specimens after burning specimens after burning
Figures 4.1 to 4.3 show some NC specimens in the crucibles before and after burning: Southern Clay burnt product appears much darker than the Nanocor one.
In order to check the actual PPgMA content in the emulsion a Permanol® 602 sample was kept it in oven at 100°C for 16 hours and then cooling it down in a desiccator. The desiccation result is showed in Table 4.3.
Table 4.3: Compatibilizer desiccation
Evaluated content Expected content
Permanol® 602 34% 34-36%
4.2.2 Burn off test on plaques specimens
In Table 4.4 the results of BOTs performed on plaques are listed: the amount of material left in the crucible after burning is roughly close to the expected value, this being determined on the basis of the experimental results from the raw materials analysis.
Table 4.4: Burn off test on plaques specimens
Plaque name Theoretical mineral content Mineral left after burning
13.8c.00pb.01 3.26% 13.8c.00pb.02 3.45% 3.13% 7.4i.00pb.01 4.46% 7.4i.00pb.02 5.48% 4.82% 5i.20pb.03 3.32% 5i.5pb.05 3.43% 5i.2pb.04 3.7% 3.37% 2sc.5pb.03 1.31% 2sc.2pb.04 1.23% 1.24% 5sc.2pb.05 2.59% 5sc.5pb.06 3.08% 2.75%
As an example, Figure 4.4 is given to show what the burnt plaque specimens looked like after burning.
Figure 4.4: Plaques after burning
4.3 Differential Scanning Calorimetry
In order to have a qualitative outlook of the NC thermal behaviour, differential scanning calorimetry (DSC) analysis was performed on specimens of I.30P and C15A, the resulting heat flow/temperature curve being showed in Figure 4.5.
DSC (Ramp: 8 °C/min) -3,5 -3 -2,5 -2 -1,5 -1 -50 50 150 250 350 Temperature (°C) Heat Flow (mW) Cloisite 15A Nanocor I.30P
Figure 4.5: DSC curve on powder grade fillers
The melting points for the Nanocor® and the Southern Clay® fillers are reached respectively at 82°C and 46°C.
Figure 4.6: High resolution TGA Cloisite 20A (not used in the present work) and 15A.
Of course this melting point is related only to the surface treating substance, being the clay not a meltable material in this temperature range. A second change in state is detectable for C15A around 250°C and for both materials the decomposition begins while approaching 300°C, however the nanocomposite processing temperature remains always below these limits.
These results agree with the C15A thermo-gravimetric curve supplied by Southern Clay® and showed in Figure 4.6.
In the present work, DSC was principally used to estimate the percentage of crystalline phase in the hybrid, evaluated as a ratio between the latent heat of fusion of the sample and the theoretical latent heat of fusion of a 100% crystalline
PP, namely 209 J/g 2.
The first measurements were carried out on specimens prepared with PP and PPgMA without NC; the result, showed in Figure 4.7 demonstrates that PolyBond® alone does not significantly affect the crystallinity of PP.
40,60% 41,01% 40,07% 39,81% 20,00% 25,00% 30,00% 35,00% 40,00% 45,00% 0,00% 2,00% 2,00% 100,00% PolyBond® content Cristallinity
Figure 4.7: PPgMA content effect on crystallization of pure PP
On the contrary, when the nano-filler is added to PP an increase in crystallinity is detectable (in accordance with Ref. 3): precisely 5.48% of mineral (from I.30 P) in pure PP causes a growth in crystalline phase of 13%.
When the ‘compatibilizer-effect’ on the crystallinity of a PP-NC mixture is evaluated, it is possible to identify a trend according to which the crystallinity increases as the PPgMA content increases. Figures 4.8 and 4.9 depict the results of DSC analysis on specimens in which the NC loading level was kept constant at 5%, and the PolyBond® content increased.
Since the thermal history of each specimen has a considerable effect on crystallization, two different graphs were obtained separating the samples cooled down at different rates so as to prevent the cooling time from hiding the compatibilizer effect in experimental results.
The study of crystallinity of the hybrid composite showed that the NC presence does increase the amount of crystalline phase in the final material and this effect is amplified by the compatibilizer presence. This behaviour can be explained with the nucleating effect of dispersed platelets: PPgMA promotes the separation of layers increasing the number of potential crystallization nuclei, mineral content being equal.
5% NC - 30/60' cooling 30,00% 32,00% 34,00% 36,00% 38,00% 40,00% 42,00% 44,00% 46,00% 48,00% 50,00% 0,00% 5,00% 10,00% 15,00% 20,00% 25,00% PolyBond® content Cristallinity 5% NC - 960' cooling 30,00% 32,00% 34,00% 36,00% 38,00% 40,00% 42,00% 44,00% 46,00% 48,00% 50,00% 0,00% 5,00% 10,00% 15,00% 20,00% 25,00% PolyBond® content Cristallinity
Figure 4.8: PPgMA content effect on crystal- Figure 4.9: PPgMA content effect on crystal- lization of PP/NC fast cooled NCPs lization of PP/NC slow cooled NCPs
This idea is supported by the observed variation in Tc onset. This is the starting temperature of the crystallization process for a melted material and a higher Tc onset indicates an ‘easiest’ crystallization, namely a faster nucleation process. Although variations of this quantity are usually considered appreciable when they are of the order of 10°C, it is worth noting that the introduction of 5.48% of mineral (from I.30 P) in pure PP shifts its Tc onset from 116.33°C to 118.76°C. With the same criteria as above, the magnification effect on Tc onset variation due to the compatibilizer can be observed when the NC loading level is kept constant at 5%, and the PolyBond® content increased, as Figure 4.10 illustrates.
5% NC 118 118,5 119 119,5 120 120,5 121 121,5 0,00% 5,00% 10,00% 15,00% 20,00% 25,00% 30,00% PolyBond® content Tc onset
Figure 4.10: PPgMA content effect on nucleation of PP/NC nanocomposites
4.4 Optical Microscopy
The presence of bubbles in the extruded polymer filled with NC was already presented in paragraph 3.4.2. That evident ‘foamy’ appearance was not
observed when neat PP was extruded. So, at first, the presence of big voids was attributed to the NC.
Nevertheless in Figure 3.13 it is possible to distinguish two sizes of bubbles. Only the bigger, which was the only kind of bubble visible by the naked eye and responsible of the peculiar aspect of the extrudate, was ascribed to the NC presence. And, in fact, observing the two optical micrographs, taken from lam.pPP.epo (Figure 4.11) and from lam.pPP.cle (Figure 4.12), it is clear that small voids (the darker spots) are still present although the matrix is made of pure PP.
Figure 4.11: lam.pPP.epo Figure 4.12: lam.pPP.cle
Even though the first laminate is made of untreated GF mat and the second of heat cleaned, no big difference between them is appreciable apart the expected loss of integrity of the heat cleaned bundles in the second laminate.
This is due to the absence of the organic agent which was in charge to keep the fibres together in a coherent thread.
In both micrographs a darker line between the matrix and the mat is noticeable: presumably it depends on debonding. More, in all the crossing area between two orthogonal GF yarns there are voids where the polymer did not manage to penetrate.
Figure 4.13: lam.2.i.epo Figure 4.14: lam.5.i.epo
Figures 4.13 and 4.14 are micrographs taken respectively from lam.2.i.epo and from lam.5.i.epo: the mat and NC grade and percentage are the same but the PolyBond® 3200 content is 2% and 5% respectively.
The darker ‘border’ line is still detectable around the mat section, but, when 5% of compatibilizer is used, the matrix appears remarkably smoother with less and slightly smaller NC aggregates and the above mentioned voids in the crossing yarns areas are fewer (actually the one depicted in the micrograph is the biggest found in the whole sample).
While taking these pictures, a particular aspect of the sample with 5% of compatibilizer was noticed: it presented a sort of ‘crack’ running in the middle of the glass mat throughout the whole specimen, as showed in the two following micrographs.
Figure 4.15: lam.5.i.epo Figure 4.16: lam.5.i.epo with a higher magnification
In order to check whether this was only an incidental feature, a second sample with the same matrix composition and GF grade was prepared and analysed. It showed exactly the same behaviour as the following two micrographs show.
Figure 4.17: lam.5.i.epo second sample Figure 4.18: lam.5.i.epo second sample with a higher magnification
When observing the micrographs taken from lam.2.i.cle (Figure 4.19) and lam.5.i.cle (Figure 4.20), the same characteristics as the previous pair of samples made with untreated GF mat are noticeable, namely less and smaller aggregates and less crossing yarns voids if 5% of PPgMA is used. Nevertheless, in this case no ‘crack’ is observed in the glass mat section.
In conclusion it is possible to state that higher compatibilizer content yields a matrix with a smoother appearance thanks to a lower concentration of smaller NC aggregates.
Figure 4.19: lam.2.i.cle Figure 4.20: lam.5.i.cle
Moreover, the resulting laminate shows an easier penetration of the polymer through the fibres even though, at a first sight, mat debonding still occurs.
4.5 Focused Ion Beam
In the largest part of the papers quoted in the Literature Review Chapter which study the NC dispersion in a polymeric matrix, micrographs obtained by transmission electron microscopy (TEM) are used to illustrate the actual conformation of the layers in the final nanocomposite. Nevertheless, in the present work, was not possible to adopt this technique.
Figure 4.21: Pure PP Figure 4.22: Nanocor® C.30P
However the focused ion beam (FIB) technique yielded micrographs significant enough to illustrate the behaviour of NC sheets in the PP matrix.
As a reference, the micrograph taken from a pure PP sample and the one taken from the filler rich master batch (which contains 50% of NC) are showed respectively in Figures 4.21 and 4.22. The pure PP surface appears perfectly smooth, whereas the pellet exhibits a high concentration of lighter spots which
are believed to be NC agglomerates cut in section by the gallium ions beam of the machine.
Figure 4.23: 7.4i.00pb.01 Figure 4.24: 7.4i.00pb.01 with a higher magnification
The two micrograph above seem to support this idea: in fact the lighter spots here are thinner and have a thread-like shape, as the higher magnification of the same specimen in Figure 4.24 clearly shows, which is exactly the shape expected from the intercalated or ordered exfoliated nano-clay.
Figure 4.25: 7.4i.00pb.02 Figure 4.26: 5i.5pb.03
Thus, even though this technique is not a quantitative analysis of the dispersion level achieved, it is still evidence that the extrusion actually managed at least to stretch out the NC agglomerates, in Figure 4.24 their average length is 600 nm. Figures 4.25 and 4.26 show micrographs taken from sample respectively with 7.4% of NC without PPgMA and with 5% of NC and 5% of compatibilizer.
4.6 X-Ray Diffraction
4An X-ray diffraction (XRD) analysis performed on a wide angle demonstrated that no significant diffraction peak is present in the range from 30° to 70° and above. A test was performed both on a NC free sample (00.2pb.01 red line in the graph) and on a hybrid (5i.2pb.07 black line in the graph) in order to identify which peaks are related to nanocomposite crystals and which ones to PP and PPgMA. Figure 4.27 shows the superposition of their diffraction patterns.
Operations: Import
PP PPgMA 2% 16h File: baseline2.RAW Type: 2Th/Th locked Start: 1.000 ° End: 35.000 ° Step: 0.040 ° Step time: 1. s Temp.: 25 °C (Room) Time Started: 3 s 2Theta: 1.000 ° Theta: 0.500 ° Phi: 0.00 ° -Operations: Import
PP + 2% PPgMA + 5% powderNC - File: n1_2.RAW - Type: 2Th/Th locked - Start: 1.000 ° - End: 35.000 ° - Step: 0.040 ° - Step time: 1. s - Temp.: 25 °C (Room) - Time Started: 3 s - 2-Theta: 1.000 ° - Theta: 0.500 ° - - Phi:
Lin (Counts) 0 1000 2000 3000 4000 5000 6000 2-Theta - Scale 1.52 3 4 5 6 7 8 9 10 11 12 13 14 15 16 17 18 19 20 21 22 23 24 25 26 27 28 29 30 31 32 33 34 35 31.17525 16.01819 6.30994 5.25508 4.78610 4.19806 4.06945 3.50479 3.12257
Figure 4.27: XRD pattern of a NC free sample (red line) and of a hybrid (black line)
Comparing the two patterns results clear that the peaks corresponding respectively to about 3° and 5.5° depend on the NC presence in the material whereas the peaks from 14° on are still present in the NC free sample. For this reason, all the tests were performed in the range from 1° to 15°.
As showed in Figure 4.27, the diffraction pattern also provides an evaluation of the distance (expressed in Å) between the crystal planes responsible of each peak. In this case the important value is 31.2 Å which is exactly the distance
between the planes which have the largest dhkl value (where hkl is the Miller’s
index for the family of planes), namely the interlayer distance. Accordingly, the
hkl index, when the gallery spacing is concerned, is 001.
In order to assess the reliability of the results, some tests were performed on different specimens taken from the same plaque and the difference between the planes distances estimated was no more than 0.6 Å.
Besides, performing the test twice on the same specimen the result was basically unchanged, in fact the difference was only 0.1 Å.
It is important to highlight that the difference in intensity was never taken into account because this can depend on too many variables, that-is-to-say the concentration of stacked clay layers, the stacked structures size or the number of stacks parallel to the specimen surface (which are the only contributing to the peak intensity).
Table 4.5: Interlayer distance in pristine organo-clay Evaluated d001 (Å) Expected d001 (Å) I.30P 25.9 225 C.30P 22.2 22.86 C15A 31.3 31.57
The cooling rate seems to slightly increase the d001 spacing, as can be gathered
from Table 4.6 in which are listed the results of XRD analysis on two plaques with the same composition but cooled with different rates.
Table 4.6: Cooling rate effect on interlayer distance
Evaluated d001
(Å) Cooling time
5i.2pb.06 32.8 16 hours
5i.2pb.07 31.2 19 minutes
This results leads to the assumption that annealing the material is not connected with an inverse exfoliation, and such behaviour can be considered as an evidence of the thermodynamic stability of the compatibilized NCP structure in
accordance with Reichert et al.8
Despite the expectations, when the test was performed on specimens with two
different profiles of extrusion temperature, the one with a higher Tc exhibited a
lower d001, as Table 4.7 shows.
Table 4.7: Compounding temperature effect on interlayer distance
Evaluated d001 (Å) Tc (°C) 13.8c.00pb.01 32.3 220 13.8c.00pb.02 29.7 160, 165, 170, 170
This result was unexpected since a lower compounding temperature means a higher melt viscosity and, in turn, a higher shear stress which should increase the NC dispersion. Indeed, when the initial optical micrographs were illustrated (see paragraph 3.4.3 and Figures 3.16 and 3.17), the material aspect actually seemed
to be smoother when a lower Tc was used.
Probably the higher shear stress occurred in this case reduced the dimension of the NC aggregates visible by the naked eye but did not have the expected effect on the interlayer distance.
4.6.1 C15A filled hybrid
Table 4.8 lists the result of XRD analysis performed on specimens prepared with the Southern Clay® product.
Plotting the interlayer distance as a function of the compatibilizer/NC ratio, a ‘regular’ trend is clearly noticeable (Figure 4.28).
Table 4.8: XRD results on C15A filled hybrids
Plaque name C15A loading PPgMA loading PPgMA weight
NC weight d001 (Å) 2sc.2pb.04 2 2 1 37.7 2sc.5pb.03 2 5 2.5 38.5 2sc.10pb.07 2 10 5 40.4 5sc.2pb.05 5 2 0.4 32.8 5sc.5pb.06 5 5 1 34.2 5sc.15pb.09 5 15 3 38.0 5sc.25pb.10 5 25 5 37.7 25 27 29 31 33 35 37 39 41 0 1 2 3 4 5 6
PPgMA/NC weight ratio
Interlayer distance (Å)
Initial 2% C15A 5% C15A
Figure 4.28: Dependence of interlayer distance from PPgMA/NC weight ratio in C15A filled hybrids
As expected, and in accordance with Svoboda et al.9 and Nam et al.10, when less
NC is added, a higher dispersion level is achievable, PPgMA/NC weight ratio being equal.
4.6.2 I.30P filled hybrid
Table 4.9 lists the result of XRD analysis performed on specimens prepared with the Nanocor® product.
Table 4.9: XRD results on I.30P filled hybrids
Plaque name I.30P loading PPgMA loading PPgMA weight
NC weight d001 (Å) 7.4i.00pb.02 7.4 0 0 30.2 5i.2pb.06 5 2 0.4 32.8 5i.2pb.07 5 2 0.4 31.2 5i.5pb.05 5 5 1 33.6 5i.5pb.04 5 5 1 33.3 5i.5pb.03 5 5 1 33.3 5i.20pb.03 5 20 4 33.2
When these values are plotted in the same graph as the one used for the Southern Clay® product, the previously noticed trend is no more so evident (Figure 4.29). 25 27 29 31 33 35 37 39 41 0 1 2 3 4 5 6
PPgMA/NC weight ratio
Interlayer distance (Å)
Initial 5% I.30P
Figure 4.29: Dependence of interlayer distance from PPgMA/NC weight ratio in I.30P filled hybrids
This means that, when the Nanocor® product is used, the compatibilizer does not enhance in a significant way the dispersion level.
Such a behaviour can depend either on the larger initial interlayer distance of the Southern Clay® product, which could allow an easier intercalation of the compatibilizer molecules through the gallery, or on a different (probably stronger) interaction between the C15A surface treatment and the modified PP.
However, both using C15A and I.30P, the melt compounding technique always managed to increase the initial interlayer distance, in accordance with the
literature. In fact, the same trend was found by Hasegawa et al.11 even though
they managed to reach higher level of dispersion (up to 63 Å of interlayer distance).
Nevertheless it has to be noted that they adopted a manufacturing procedure which passed, after extruding, through pelletizing and injection moulding, therefore the better dispersion could be the result of a double mixing process.
4.7 Scanning Electron Microscopy
Scanning Electron Microscopy (SEM) was performed on the fracture surfaces of tensile test specimens: when the matrix was examined, no big differences were detectable in micrographs taken from samples respectively with 0%, 2% and 5% of PPgMA and with I.30P and C15A, as the following micrograph show.
Figure 4.30: pure PP
Figure 4.31: 5% of I.30P and 2% of PPgMA Figure 4.32: 5% of I.30P and 5% of PPgMA
Figure 4.33: 5% of C15A and 2% of PPgMA Figure 4.34: 5% of C15A and 5% of PPgMA
NC aggregate
Figure 4.35: 5% of I.30P and 5% of PPgMA
A big clay inclusion was found on the fracture surface of the sample with 5% of I.30P and 5% of PPgMA. A mass spectrograph confirmed the inorganic constitution of the aggregate. Regarding the laminates analysis, the same
classification adopted in paragraph 3.5 will be followed here, and then the micrographs will be divided into two groups.
4.7.1 First group of laminates
In this paragraph the micrographs will be divided in three couples: in each of them the matrix nature will be the same and the behaviour of the two GF mat grades adopted for this group of specimens (epoxy functionalised and heat cleaned) will be observed.
Figure 4.36: Matrix: pure PP Figure 4.37: Matrix: pure PP GF mat: epoxy functionalised GF mat: heat cleaned
When neat PP is used as matrix, the glass fibres show a complete absence of interaction with the polymer: the stress during fracture perfectly manage to detach the inorganic reinforcement from the matrix.
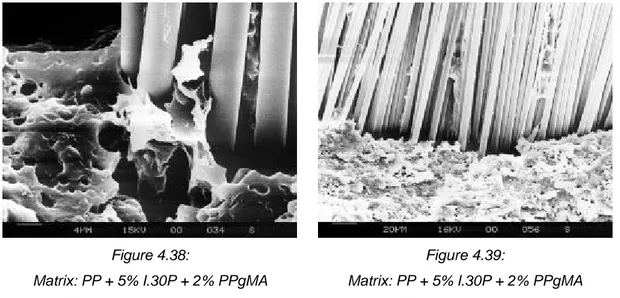
Figure 4.38: Figure 4.39:
Matrix: PP + 5% I.30P + 2% PPgMA Matrix: PP + 5% I.30P + 2% PPgMA GF mat: epoxy functionalised GF mat: heat cleaned
The glass surface results smooth as untouched by the PP: the fibres shape ‘in negative’ is still detectable on the matrix edge in Figure 4.37. The ‘lumps’
observed in between the fibres in Figure 4.36 are residues of the organic binders not any more present in the heat cleaned mat in Figure 4.37.
In the next pair of micrographs (Figures 4.38 and 4.39) NC and 2% of compatibilizer were added to the matrix, nevertheless no big differences are visible in comparison with the previous pair of micrographs: the glass surface is still smooth and ‘clean’ apart for a small amount of material that seem to adhere on some fibres in Figure 4.39.
Figure 4.40: Figure 4.41:
Matrix: PP + 5% I.30P + 5% PPgMA Matrix: PP + 5% I.30P + 5% PPgMA GF mat: epoxy functionalised GF mat: epoxy functionalised
Figures 4.40 and 4.41 are micrographs taken from one sample with 5% of I.30P, 5% of compatibilizer and the epoxy functionalised GF mat.
In this laminate, the matrix-mat interactions seem to become more important: the polymer begins to remain on glass surface after the fracture.
4.7.2 Second group of laminates
Also in this paragraph three pairs of micrographs will be examined, but now, in each of them, the GF mat grade will be the same and, alternatively, the behaviour of 2% and 5% of PPgMA loading will be observed.
Comparing Figure 4.42 with Figure 4.43, it results evident the sharp improvement in terms of adhesion between matrix and glass reinforcement when the PPgMA loading level passes from 2% to 5%.
Figures 4.44 and 4.45 represent an explicit indication of the effectiveness of using a coated GF reinforcement to improve the mat impregnation. For the first time the fibres here are no more divided into separated bundles, but they appear completely immersed into a polymeric structure. Besides the effect of a higher PPgMA loading level is still detectable.
It is worth noting, though, that the coating material does not always well penetrate the matrix bulk, forming a sort of internal surface that keep it separated as evidently appears in the left picture.
Figure 4.42: Figure 4.43:
Matrix: PP + 5% C15A + 2% PPgMA Matrix: PP + 5% C15A + 5% PPgMA GF mat: epoxy functionalised GF mat: epoxy functionalised
Figure 4.44: Figure 4.45:
Matrix: PP + 5% C15A + 2% PPgMA Matrix: PP + 5% C15A + 5% PPgMA GF mat: emulsion coated GF mat: emulsion coated
Figure 4.46: Figure 4.47:
Matrix: PP + 5% C15A + 2% PPgMA Matrix: PP + 5% C15A + 5% PPgMA GF mat: pre-preg GF mat: pre-preg
As easily predictable, when pre-pregs are used, the highest level of fibre impregnation is reached. Comparing Figures 4.46 and 4.47 to the micrographs taken from pure PP matrix samples (Figures 4.36 and 4.37) it is evident the noteworthy improvement achieved in terms of glass-polymer interaction. The same PPgMA does not have any more appreciable effect since it is difficult to further advance such a situation.
This ‘close’ overview on the appearance of the fracture areas of broken specimens leads to the conclusion that the bond between the polymer and the mat can be enhanced either increasing the PolyBond® level or changing the GF mat treatment from epoxy resin functionalized to emulsion coated and to pre-pregs. An enhanced bond can, in turn, lead to a better stress transfer from the matrix to the fibres moving from the situation one depicted in picture Figure 4.48 to the situation depicted in Figure 4.49 in which it is still clearly visible material linked to the glass surface even after the fracture.
Figure 4.48: Matrix: pure PP GF mat: epoxy functionalised
Figure 4.49: Matrix: PP + 5% C15A + 5% PPgMA - GF mat: pre-preg
Figure 4.50: Matrix: PP + 5% C15A + 2% PPgMA GF mat: epoxy functionalised
Figure 4.51: Figure 4.52:
Matrix: PP + 5% C15A + 2% PPgMA Matrix: PP + 5% C15A + 5% PPgMA GF mat: emulsion coated GF mat: pre-preg
In fact, the last three micrographs are taken from samples with the same matrix composition but with three different GF mat grades: the fibres are broken in several small pieces in Figure 4.51 and in Figure 4.52 whereas in Figure 4.50 they are all broken at the same height. This indicates that, as expected, when a better interaction between reinforcement and matrix occurs, the stress results more homogeneously distributed throughout the whole fibre. In the case showed in Figure 4.50 (i.e. when the epoxy functionalised GF mat is used) the stress is transferred to the mat only by the clamps of the tensile test loading cell, whereas in the samples depicted in Figures 4.51 and 4.52 (i.e. when more appropriate GF mat grades are used) the stress is transferred from the matrix to the fibres all over the specimen length thanks to the enhanced matrix-filler interactions.
The result is a series of breakages in the fibres and the resulting laminate should have a higher tensile resistance, since the strength necessary to break a shorter fibre is higher than the one necessary to break a longer fibre. And actually, as an anticipation of the tensile test results given in paragraph 4.9.2, can be here
advanced that the increase in tensile modulus, in comparison with the pure PP, yielded by lam.2.sc.epo (Figure 4.50) was ‘only’ 18,74% in relation to the 40.55% and 199.80% respectively shown by lam.2.sc.emu (Figure 4.51) and lam.5.sc.pre (Figure 4.52).
4.8 Dynamical Mechanical Thermal Analysis
4DMTA analysis was performed in order to check the change in glass transition temperature which usually a polymer undergoes when is filled with organo-clay. Nevertheless the expected trend was not confirmed. The following graphs are divided into two groups to separately evaluate the influence of the amount of NC and of maleated PP on the final nanocomposite. In each graph the pure PP pattern is reported as a reference. Besides, the graph title states the values kept constant in the specific experiment whereas the key shows the variables.
4.8.1 NC loading level effect
In order to evaluate the NC loading level effect on Tg, the compatibilizer content of the specimens here analysed will be kept constant at 2%. As Figure 4.53
shows, when PP is filled with 5% of I.30P no significant change in the tg ? peak is
observed, meaning that no difference in Tg can be evaluated.
Analysing the samples containing C15A (Figure 4.54) it results clear that the tg ?
peaks are nearly superimposable for the three specimens: in this case too no difference in Tg can be estimated.
2% PPgMA - 30' cooling time
0,02 0,04 0,06 0,08 0,1 0,12 -50 -30 -10 10 30 50 Temperature (°C) tg delta 5% I.30P 0% I.30P pure PP
2% PPgMA - 30' cooling time
0 0,02 0,04 0,06 0,08 0,1 -50 -30 -10 10 30 50 Temperature (°C) tan delta 2% C15A 5% C15A pure PP
Figure 4.53: I.30P content effect on Tg Figure 4.54: C15A content effect on Tg
4.8.2 Compatibilizer loading level effect
The same result as above is achieved when the PPgMA loading effect is analysed. In fact, the last next graphs (Figures 4.55 and 4.56) show that neither
adding 2% of maleated PP nor 5% affects the tg ? patterns, no matter what NC
5% I.30P - 16h cooling time 0,02 0,04 0,06 0,08 0,1 0,12 -50 -30 -10 10 30 50 Temperature (°C) tan delta 2% PPgMA 5% PPgMA pure PP
2% C15A - 30' cooling time
0 0,02 0,04 0,06 0,08 0,1 -50 -30 -10 10 30 50 Temperature (°C) tan delta 2% PPgMA 5% PPgMA pure PP
Figure 4.55: PPgMA content effect on Tg Figure 4.56: PPgMA content effect on Tg
4.9 Tensile Test
4.9.1 Tensile test on the matrix
Tensile test was performed on pure PP specimens (shown in Figure) in order to have a control reference. Besides some samples made of PP and PPgMA without nano-fillers were prepared in order to check any effect of the compatibilizer on the polyolefin tensile behaviour.
The results are listed in Table 4.10.
Table 4.10: Effect of PPgMA presence on polypropylene
Plaque
name NC grade NC wt% PPgMA wt%
E (GPa) Yield stress (MPa) Elongation at break
pPP - NC free PPgMA free 3.43 22.88 2.39%
00.2pb.03 - NC free 2 3.43 24.62 3.63%
The tensile modulus is unchanged, but the specimen with 2% of PPgMA appears slightly tougher with maximum stress and strain increased respectively of 7.6% and 5.2% probably because of the lower compatibilizer MW.
As an example, the stress-strain curve for a pure PP specimen is shown in the side graph. Pure PP 0 5 10 15 20 25 30 0,0% 0,5% 1,0% 1,5% 2,0% 2,5% 3,0% Strain Stress (MPa)
4.9.1.1 Nano-clay loading effect
When 7.4% of I.30P is added to the poliolefinic matrix, its behaviour changes as shown in Table 4.11.
Table 4.11: Effect of organo-clay presence on polypropylene
Plaque name NC grade NC wt% PPgMA wt% E (GPa) Yield stress (MPa) Elongation at break
7.4i.00pb.02 I.30P 7.4 PPgMA free 3.94 21.49 2.42%
In this case an expected, even if very poor, increase in modulus is observed (14.9%) together, though, with a nearly untouched maximum stress and strain.
As an example, the stress-strain curve for this specimen is shown in the side graph.
4.9.1.2 Compatibilizer loading effect
Compatibilizer loading effect on the hybrid mechanical behaviour was analysed preparing a series of samples in which the PPgMA content was increased while the other affecting variables (NC grade and loading, cooling time and processing parameters) were kept constant.
In Table 4.12 the TT results of the samples prepared with 2% of C15A are listed, while Table 4.13 shows the TT results of the specimens prepared with 5% of C15A. Below each modulus value, its improvement in comparison with the pure PP is shown.
Table 4.12: Effect of PPgMA content on hybrids with 2% of C15A
Plaque name NC grade NC wt% PPgMA wt% E (GPa) Yield stress (MPa) Elongation at break 2sc.2pb.04 2 3.69 (+7.55%) 24.11 3.05% 2sc.5pb.03 5 3.62 (+5.47%) 23.80 2.39% 2sc.10pb.07 C15A 2 10 3.71 (+8.10%) 24.90 2.13%
Plotting these results in Figure 4.57, clearly demonstrates that there is an actual improvement already with 2% of nano-filler and that the PPgMA effect on helping dispersion and, in turn, on enhancing the modulus, is, as expected, more important in specimens with a higher NC content.
7.4i.00pb.02 0 5 10 15 20 25 0,0% 0,5% 1,0% 1,5% 2,0% 2,5% Strain Stress (MPa)
Nevertheless it is noticeable that, after 15% of compatibilizer loading, the curve tends to a plateau with no more significant modulus increase.
Table 4.13: Effect of PPgMA content on hybrids with 5% of C15A
Plaque name NC grade NC wt% PPgMA wt% E (GPa) Yield stress (MPa) Elongation at break 5sc.2pb.05 2 3.85 (+12.17%) 24.11 2.94% 5sc.5pb.06 5 3.87 (+12.71%) 24.33 2.15% 5sc.15pb.08 15 4.00 (+16.69%) 23.90 1.63% 5sc.25pb.10 C15A 5 25 4.04 (+17.70%) 19.42 0.85%
It is important to note that, while the addiction of NC alone does not affect the material toughness (see paragraph 4.9.1.1), when PPgMA is used, the material tends to become much more fragile than the pristine PP: in 5sc.25pb.10 the yield stress and the elongation at break are decreased respectively of 15.1% and of 64.4%. 3,4 3,5 3,6 3,7 3,8 3,9 4 4,1 0,00 5,00 10,00 15,00 20,00 25,00 PPgMA (wt%) E (GPa)
NCP with 2% of C15A NCP with 5% of C15A Pure PP
Figure 4.57
4.9.1.3 Comparing NC grades
Plaques with the same composition and processing history but with different NC grades were examined in order to check any difference between them.
As Table 4.14 shows, modulus and maximum stress are almost equal, whereas a noticeable difference in the strain tolerated by the material is observed.
Table 4.14: Tensile test results of hybrids with different NC grades Plaque name NC grade NC wt% PPgMA wt% E (GPa) Yield stress (MPa) Elongation at break 5i.2pb.07 I.30P 3.74 23.38 5.67% 5sc.2pb.05 C15A 5 2 3.85 24.11 2.94%
4.9.1.4 Tensile test results discussion
As thoroughly explained in Chapter 2, the largest part of the literature concurs that the higher the nano-particle dispersion level achieved, the higher the mechanical improvement in NCP.
Nevertheless, when a possible connection between level of clay layer dispersion through the matrix and tensile properties was evaluated, it was found that the two aspects share only the same general trend but no direct relationship could have been found.
On the other hand, comparing the crystalline phase amount of the manufactured NCP specimens and their Young’s modulus, a very strict correlation between them could be deducted, as the following graph illustrates.
0,00% 5,00% 10,00% 15,00% 20,00% 25,00% 30,00% 35,00% 40,00% 45,00% 50,00% pPP 7.4i.00pb.02 13.8c.00pb.02
5i.5pb.05 5i.2pb.06 5i.2pb.05 5i.5pb.06 5i.15pb.08 5i.25pb.10
0 0,5 1 1,5 2 2,5 3 3,5 4 4,5 5 Crystallinity Young's Modulus (GPa)
Figure 4.58: Crystallinity and elastic modulus follow the same trend
Such a correlation appears more evident when the values are plotted in a crystallinity vs. elastic modulus plane (Figure 4.59).
This result leads to the assumption that the crystallinity improvement in the final material rather than the platelets dispersion level has the major effect on the mechanical nanocomposite performance.
Indeed, nucleation of polymer crystals on nano-particles represents a phenomenon to be further investigated: if the mechanism conducting to a crystallinity improvement can be found, it will be possible to better understand the link between nano-dispersion and enhanced tensile properties.
R2 = 0,9054 2,5 3 3,5 4 4,5 5 25,00% 30,00% 35,00% 40,00% 45,00% 50,00% Crystallinity
Young's Modulus (GPa)
Figure 4.59: Dependence of elastic modulus on crystallinity
It was not easy to compare the obtained tensile test results to those available in
the literature. Hasegawa et al.11 reported the tensile behaviour of a PP based
nanocomposite filled with stearyl amine treated MMT (a NC grade comparable with Nanocor® I.30P analysed in this theses) and obtained by melt blending with maleated PP as compatibilizer. Adding 7.2% both of NC and of PPgMA they increased the Young’s modulus of 7% in contrast with the 14.9% of improvement it was found in the present work testing a specimen with 7.4% of I.30P and compatibilizer free.
On the other hand, Svoboda et al.9 reported an improved modulus of more than
40% adding 5% of Cloisite® 20A and 5% of PolyBond® 3150 (both very close to our Cloisite® 15A and PolyBond® 3200) in a PP matrix, whereas adding the same amount of our analogues, we managed to improve the modulus ‘only’ of 12.71%. However, such a big difference can be explained considering that they used a low modulus (1.6 GPa) polyolefin as matrix in contrast with ours which exhibited a higher, and then more difficult to improve, modulus (3.43 GPa) already in the unfilled state.
4.9.2 Tensile test on laminates
The tensile results for all the manufactured laminates are summarized in Tables 4.15 to4.17. They were divided into four groups in which the GF mat grade was the same for all the specimens, and the matrix composition was changed in NC grade and compatibilizer loading.
For each group a control specimen with a neat PP
matrix was also analyzed. The modulus value is followed by its improvement in comparison with neat PP.
As predictable, the heat cleaned mat gave the worst result in terms of tensile performance as shown in Table 4.15. Apart for a higher maximum strain (in comparison with pure PP), the laminates tensile properties are unaffected by the introduction of the mat in the polymeric matrix. Their behaviour, in fact, is exactly the same as for the specimens without glass reinforcement.
Table 4.15: Tensile test results of heat cleaned GF mat reinforced laminates
Plaque name NC grade PPgMA wt% GF mat grade E (GPa) Yield stress (MPa) Elongation at break
lam.pPP.cle NC free PPgMA
free 3.46 (+0.9%) 22.22 4.38% lam.2.i.cle I.30P 2 Heat cleaned 3.91 (+14.03%) 21.25 3.53%
Analysing the epoxy functionalised laminates behaviour (Table 4.16) it is evident, first of all, the very poor interaction between matrix and glass reinforcement: the modulus of the NC and PPgMA free sample is, in fact, very close to that of neat PP. Analysing the same table, it can be assessed that the effect of different NC grades on the final product is variable: when 2% of compatibilizer is used, the Nanocor® product yields the higher modulus enhancement whereas, when 5% of PPgMA is added, the Southern Clay® product provides the best performance. The lam.5.sc.epo behaviour demonstrates the synergistic reinforcement effect of organo-clays and glass fibres when the maleated PP is used: filling the polyolefin with 5% and C15A and 5% of compatibilizer increases the PP modulus of 12.71% (see Table 4.13), inserting the epoxy functionalized mat in the polypropylenic matrix yields an improvement of 10.24%, whereas, when these two reinforcement media are used together, the Young’s modulus is drastically increased of 67.27%.
Table 4.16: Tensile test results of epoxy functionalised GF mat reinforced laminates
Plaque name NC grade PPgMA wt% GF mat grade E (GPa) Yield stress (MPa) Elongation at break
lam.pPP.epo NC free PPgMA
free 3.78 (+10.24) 23.29 3.37% lam.2.i.epo 2 4.27 (+24.61%) 26.52 2.00% lam.5.i.epo I.30P 5 5.38 (+56.94%) 40.67 1.10% lam.2.sc.epo 2 4.07 (+18.74%) 25.88 0.95% lam.5.sc.epo C15A 5 Epoxy functionalised 5.74 (+67.27%) 38.22 0.95%
Such a performance is due to the compatibilizer contemporary action on silicate filler and glass reinforcement.
Indeed, when Table 4.17 is examined, it can be deducted that the emulsion coating is not effective when a relatively high amount of maleated PP (5%) is
already present in the matrix (indeed lam.5.sc.emu and lam.5.sc.epo share a modulus improvement of the same order of magnitude) whereas such coating can be helpful when PPgMA is totally absent or present in low percentage: the NC and PPgMA free laminate already yields a modulus 47.10% higher than PP if a maleated coating covers the glass fibres.
Table 4.17: Tensile test results of emulsion coated GF mat reinforced laminates
Plaque name NC grade PPgMA wt% GF mat grade E (GPa) Yield stress (MPa) Elongation at break
lam.pPP.emu NC free PPgMA
free 5.05 (+47.10%) 26.95 0.70% lam.2.sc.emu 2 4.82 (+40.55%) 38.38 1.26% lam.5.sc.emu C15A 5 Emulsion coated 5.48 (+59.72%) 41.09 1.33%
The best results in terms of tensile modulus improvement were predictably yielded by the pre-preg laminates as shown in Table 4.18. In this case the reinforcing effect was such at a high level that the nano-filler action was no more detectable at all. Besides, the PPgMA presence in the laminate matrix did not affect the specimens tensile
performance because the maleated PP could not interact directly with the glass fibres,
being the latter, in the
commercially available pre-preg
grade, already completely
covered by a poliolefinic layer. As an example, the stress-strain curve for this specimen is shown in the side graph. As expected the laminate is by far more fragile than the hybrid.
Table 4.18: Tensile test results of pre-preg GF mat reinforced laminates
Plaque name NC grade PPgMA wt% GF mat grade E (GPa) Yield stress (MPa) Elongation at break
lam.pPP.pre NC free PPgMA
free 10.82 (+215.35%) 111.65 1.27% lam.2.sc.pre 2 9.85 (+187.27%) 106.87 1.29% lam.5.sc.pre C15A 5 Pre-preg 10.28 (+199.80%) 105.75 1.32%
Finally it is worth to highlight that the tensile test results regarding the specimens lam.2.sc.epo, lam.2.sc.emu and lam.2.sc.pre confirm what qualitatively
lam.5.sc.pre 0 20 40 60 80 100 120 140 0,0% 0,2% 0,4% 0,6% 0,8% 1,0% 1,2% 1,4% 1,6% Strain Stress (MPa)
anticipated in SEM analysis by studying the micrographs taken on their fracture surfaces (Figures 4.50, 4.51 and 4.52).
1
Nanocor Technical Data, Lit. P-809 “P Series” Concentrate Specifications, http://www.nanocor.com/tech_sheets/P809.pdf (accessed March 2003)
2
Brandup S, Immergut EM, Polymer Handbook, Interscience, New York, 1975 3
Alexandre M, Dubois P, Sun T, Garces J, Jèrôme R, Polymer, 43 (2002) 2123 4
Commin L, De Blic A, Ferrari S, Silbermann V, Novel thermoplastic Matrix Composite, M.Sc. Group Project Report, Cranfield University (2003)
5
Nanocor Technical Papers, Qian G, Cho JW, Lan T, Preparation And Properties Of Polyolefin
Nanocomposites, http://www.nanocor.com/tech_papers/Preparation_Properties_PP_nano.htm (accessed October 2002)
6
Appendix II 7
Southern Clay Products Inc., Cloisite 15 A, http://www.nanoclay.com/data/15A.htm (accessed
March 2003) 8
Reichert P, Hoffmann B, Boch T, Thomann R, Mülhaupt R, Friedrich C, Macromolecular Rapid
Communications, 22 (2001) 519 9
Svoboda P, Zeng C, Wang H, James Lee L, Tomasko DL, Journal Of Applied Polymer Science,
85 (2002) 1562
10
Nam PH, Maiti P, Okamoto M, Kotaka T, Hasegawa N, Usuki A, Polymer, 42 (2001) 9633 11
Hasegawa N, Kawasumi M, Kato M, Usuki A, Okada A, Journal Of Applied Polymer Science,