5 Discussion of seismological results
5.1 Earthquake localization after 3-D inversion
Figures 5.1 and 5.2 show hypocentre locations of the 155 selected events obtained after the 3-D inversion. Since, for seismo-tectonic interpretation, high precision hypocentral coordinates and reliable error-estimates are very important we used the differences between minimum 1-D and 3-D locations to verify the accuracy of hypocentral coordinates (Husen et al., 1999). We note that, after 3-D inversion, most events retain the position derived from the minimum 1-D model computation, demonstrating the accuracy of these hypocenter positions. These location differences are rather small and we may estimate, for the selected events, an average location error of about 2.0 km in horizontal directions and 3.5 km in depth. These values, that are related to earthquake locations in a region extended over 60,000 square kilometers, are similar to those calculated from to the stability test of the Minumum 1-D model (see chapter 3). We underline that the hypocentral coordinates stability is a reliable check of the 3-D inversion (Husen et al., 1999).
In previous studies (Dorel, 1981; Girardin et al., 1991, Bengoubou-Valerius et al., 2008) hypocentral locations were poorly constrained due to the solely use of land stations installed on the islands (Girardin et al., 1991). The use of an off/shore network help us to detect low magnitude earthquakes in the forearc and, due to not good islands arc alignment, to improve azimuthal coverage of hypocentral determination.
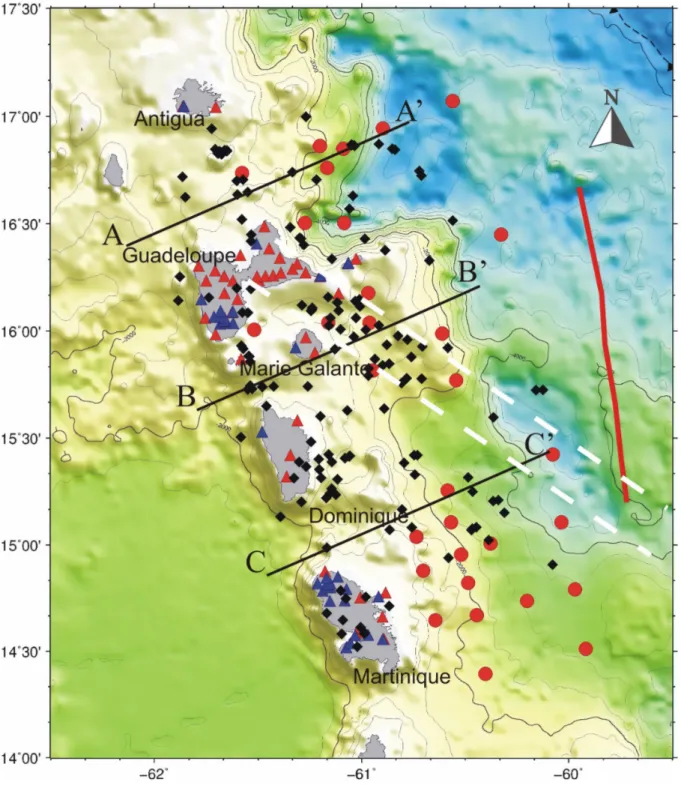
Earthquake locations (figures 5.1 and 5.2), based on the use of a combined on-offshore network SISMANTILLES I, confirms the seismicity to be close to the island arc. We observe a very low seismic activity beneath OBS stations that, on the contrary, is mainly concentrated east of the island arc, not further than 150 km. However, the use of OBS stations, deployed over the forearc, enhances the quality of the offshore seismic locations and allows recording lower magnitude events. Only few events have been detected in the back-arc region, consistent with previous results (Dorel, 1981; Stein et al., 1982). Nevertheless, during the experiment, seismic stations have not been installed at the right place to detect low magnitude earthquakes of the backarc region.
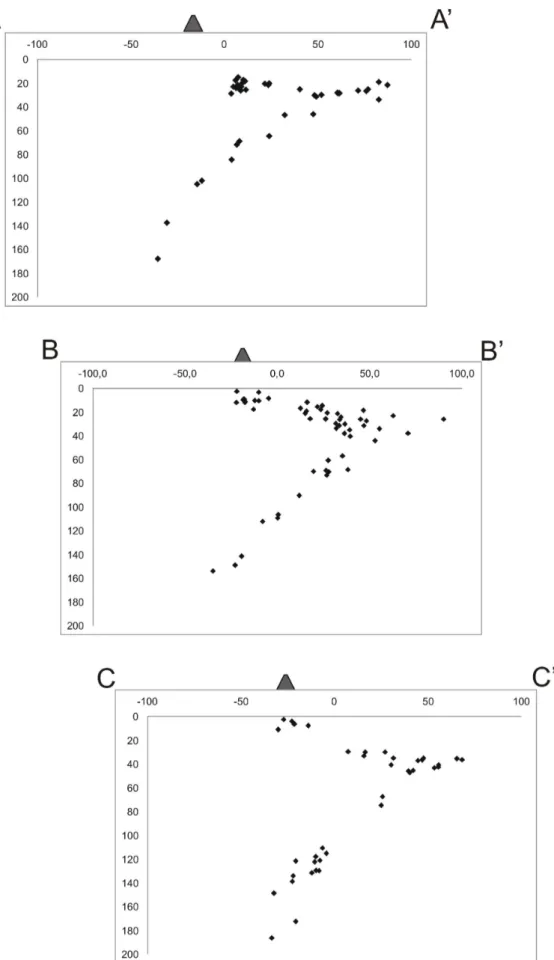
During the 13-month observation period available, depth distribution of seismicity (figure 5.2) highlights two groups of earthquakes, deep earthquakes and earthquakes between 15 and 50 km depth.
Figure 5.1: Epicentral map of the 155 events relocated after 3-D inversion. After 3-D inversion most events retain the position obtained with the minimum 1-D model, demonstrating the stability and accuracy of these hypocenter locations. In the figure are represented stations of OVSG (blue triangles), temporary land stations (red triangles) and OBS (red squares). Dashed white lines are the prolongation of the two borders of the Tiburon ridge according to its trend at the deformation front and assuming a straight subducting path beneath forearc region. Red line is the backstop position derived from the studies of Laigle et al. (2010).
The observed seismic activity deeper than 15 km can be localized between the island arc backstop and the subducting oceanic crust. At greater we detect earthquakes that can be linked to dehydration of sepertinized slab mantle, like suggested by Peacock (2001). At first order, on figure 5.2 seismic events image the Wadati-Benioff zone downdip to 180 km depth. During this period, no earthquakes shallower than 15 km have been detected south of the area under study. This behavior appears to be different to the north where seismic activity is observed on normal and oblique faults (Feuillet et al., 2002; Bazin et al., 2010). From Montserrat to north Dominique island a large en echelon fault system accommodate the deformation in the entire forearc region (Feuillet et al., 2001), while in the remaining part Caribbean plate seismicity is diffuse and cannot be related to any specific structure in the forearc.
In the centre of the arc near 15° 30’, beneath Dominique island, there is a clear concentration of deep events, a similar clustering of events has not been observed in any other sector of the arc and was noted also by Dorel (1981). It is in this area that on November 29, 2007 a 7.4 Mw intraplate earthquake occurred at 150 km depth (IPGP, 2007). This was the largest earthquake in the region since a magnitude 6.9 Mw earthquake which occurred near Antigua island in 1974. When projecting the hypocenter of this earthquake onto a plane having the slab dip and strike, the standard USGS focal mechanism appears basically as a normal-faulting rupture through the slab thickness in a direction indicating lateral extension. This is a contrasted solution with respect to the described downdip extension or downdip compression of the intermediate-depth seismicity related to penetration of the slab through the mantle transition zone, as described in the early review of focal mechanisms in slabs (Isacks et Molnar, 1969). It is tempting to consider possible relations of the rupture along the slab dip evidenced by the Mw 7.4 earthquake with the possible heterogeneous structure of the corresponding slab. Atlantic oceanic transform-faults which are well expressed in the abyssal plain nearby the mid-Atlantic ridge are lithospheric scale structures which enter in the subduction although their morphological expression are more subdued at the deformation front (Müller et Smith, 1993). One of they might be the structure reactivated as a tear in the slab and be responsible of this deep lateral-faulting earthquake (Scarfì et al., in press), but this hypothesis cannot be verified. Few of them are marked by topographical highs or ridges such as the Barracuda and Tiburon ridges, which underline the obliquity of these fracture zones with respect to the convergence and slab dip directions. The arcward prolongation of these not well-mapped subducting fracture zones is furthermore complicated by the increasing dip of the slab.
A surprising observation from figures 5.1 and 5.2 suggests that certain seismicity coincides with the extrapolated surface trace of the Tiburon ridge that several authors considered aseismic (Bouysse et Westercamp, 1990).
Another remark is the no significant seismicity detected either in the accretionnary prism or the outer forearc region. Indeed a clear observation emphasizes by SISMANTILLES I network is the very low seismicity east of the Arawak basin whereas most of the earthquakes are located westward (Figures 1.2 and 5.1). In most subduction zones this limit usually marks the backstop position (Stern, 2002), but, in the Lesser Antilles region, several studies (Christenson et al., 2003; Laigle et al., 2010) locate the backstop position to the east (figure 5.1). In our study area we may assume that the inner forearc controls the seismicity since the main seismic activity begins at its eastern border. Moreover, the outer forearc crust is likely slightly deformed because only few earthquakes have been located there. The occurrence of a high seismicity level far from the backstop position and locate in the slab could be explained by slab bending.
5.2 Tomographic model of Island arc structure
Figure 4.7 displays two NNE-SSW depth sections for the P-wave velocity model. Depth sections are shown between 14° 40’ and 16° 20’. Based on resolution assessment discussed in chapter 4 areas of good resolution are internal the 250 DWS contours. From obtained tomographic images, we reach the conclusion that the island arc, in the investigated are, is composed from three layers (upper, middle and lower crust), which total thickness is of 28-33 km. These values are compatible with crustal investigation of Sevilla et al. (2010) for Montserrat island which estimate a mean crustal thickness of about 30 km and suggest that the crust may be slightly thinner to the northwest of the island (26–30 km) than the south (30–34 km). Their velocity-depth distribution recognizes similar P-wave velocities and provides verification, across the island arc, of our interpretation of crustal velocities. A previous seismic refraction experiment (Boynton et al., 1979) along and across the Lesser Antilles island arc has shown that the crust beneath the arc contains two refractors with average seismic velocities of 6.2 and 6.9 km/s. The upper, 6.2 km/s refractor varies in depth and shows large fluctuations in its seismic velocity. According to these authors, the layer between the refractors has an average thickness of about 10 km and the total thickness of the crust of the arc is about 30 km beneath Martinique Island.
The upper island arc crust, along our two sections, shows little thickness variations. Below the sedimentary coverage, it is interpreted composed primarily by volcaniclastics and intrusive/extrusive igneous rocks and characterized by P-wave velocities between sedimentary values and 5.2-5.5 km/s. This range in upper crustal velocities may be attributed to varying degrees in porosity, fluid content, fracturing, and alteration.
The middle crust layer, which is interpreted to be felsic to intermediate, is characterized by a thickness on the order of 10 km with velocities increasing from 5.5 km/s to 6.8 km/s. These values are in according to the findings of Christensen et Mooney (1995) which show an average compressional wave velocity of the middle crust of 6.45 km/s. Our results are comparable to tomographic images of Mariana Arc where Calvert et al., (2008), documented an average thickness of 10 km and a P-wave velocity between 6.0 and 6.5 km/s. These authors interpreted this midcrustal layer to represent intermediate to felsic plutonic rocks. This interpretation is corroborated by the presence of extensive tonalitic plutons in
exposed middle crust from the Izu‐Bonin arc, preserved in the Tanzawa plutonic complex,
Japan (Kawate et Arima, 1998).
The lower crust shows velocities increasing from 7.1 km/s to 7.3 km/s and forms a layer that has an average thickness of 10 km. This corresponds to a crustal unit along the Izu-Bonin arc (Kodaira et al., 2007) that is interpreted as gabbroic plutons. We have calculated isopach maps of the middle and lower crust as defined by the velocity ranges 5.5–6.8 km/s and 7.1–7.3 km/s, respectively. These velocity intervals have been selected to facilitate comparisons with previously published seismic results from other oceanic arcs (Calvert et al., 2008). In the case of the 35-km-thick Aleutian oceanic arc, velocities of 6.5–7.4 km/s define the midcrust, but this region is underlain by rocks with velocities of 7.3–7.7 km/s (Shillington et al., 2004). Theoretical calculations (Korenaga et al., 2002) and compilations of P wave velocities from rock samples (Christensen et Mooney, 1995) corresponding to 10–20 km depth imply that in situ velocities of 7.0–7.4 km/s in the Mariana arc lower crust represent quartz-poor gabbroic plutons. The Moho, conventionally assumed to separate crustal rocks from upper mantle rocks, and by definition separating rocks with velocities above and below 7.6 km/s (Steinhart, 1967), is sufficiently defined at the average depth of 30 km in the final 3-D velocity model.
5.3 Concluding remarks
In this work seismic data from the 13-months experiment SISMANTILLES I were used to compute a 1-D P- and S-velocity model (figure 3.4) and corresponding station delays (table 3.7) for the Lesser Antilles region according to the procedure outlined by Kissling et al. (1994). In a subsequent step the same data were used for computation of 3-D crustal velocity structure by LET, a process of iterative simultaneous inversion for 3-D velocity structure and hypocentre parameters using traveltime residuals. With this technique we resolve the 3-D P-wave velocity structure of the crust. The computed minimum 1-D model jointly to the velocity anomalies observed in the tomographic Vp model, lead to the following conclusions:
- Station corrections are an integral part of the velocity model and reflect the highly heterogeneous near-surface structure. This experiment provides a rare opportunity to check the efficiency of the minimum 1-D inversion scheme, in particular in retrieving station-terms that are meaningfull in terms of the local structure under the stations that is usually not known independently. In particular, the OBS station-terms are in general positive with respect to land stations indicating late arrivals, consistently with the presence of soft mud and sediments at the sea-bottom, and they vary with their thickness as can be derived here from multi-channel reflection seismic (MCS) profiles shot over them (Laigle et al., 2011).
- The relocated hypocenters after the 1-D and 3-D inversions improve our knowledge on the Subduction Zone because they have smaller uncertainties with respect to the permanent array locations. The results of this work demonstrate that the OBS are needed to extent a passive seismic network towards offshore. A higher noise level yield gives a lower sensitivity for the OBS, but one or two observations improve the azimuthal coverage and constrain a substantially hypocenter location. Moreover our hypocentre locations are validate by stability tests that confirmed small uncertainties.
- In general, we have a more clustered hypocenter distribution after 1-D and 3-D inversion; this is in agreement with the observation of multiplets (figures 2.8 and 2.9), both in picking phase and in a-priori localization.
- The main seismic activity is concentrated arcward, extending not further than 120 km east of the island arc, depth distribution of seismicity highlights two groups of earthquakes, deep earthquakes and earthquakes between 15 and 50 km depth. - Like in the Central Andean Subduction Zone (Scarfì et al., in press), north of our
network seismicity could be related to the subduction of the Tiburon ridge.
- The Lesser Antilles island arc crust is divided into three layers (upper, middle and lower crust) according to the multi-channel reflection seismic profiles of Laigle et al. 2011 and to receiver function analysis of Sevilla et al. 2010.
- Lateral heterogeneity accross the central Lesser Antilles island arc is insignificant compared to tomographic images of the best studied subduction systems (e.g. Alaska-Aleutian trench, Mariana trench).
Trough the Lesser Antilles region is characterized by a seismic quietness (for instance over the 13 months period of SISMANTILLES I experiment there was not a an earthquake with a magnitude large enough to appear in catalogs of the worldwide permanent arrays) it represents a very well suited target area for seismotectonic studies. One of the major logistic problems in this region is the difficulty to realize a sufficiently dense station distribution over a wide region of which large parts are offshore. However the use of OBS in this study has led to high quality hypocenter locations. In order to detect the investigated region with more details additional information is necessary for a reliable interpretation of the deeper structure. Indeed the use of local earthquake restricts the resolution of the tomographic images to the crustal volume above the subducting slab. It should be one of the future tasks to use the SISMANTILLES I data to perform regional teleseismic tomography.