www.small-journal.com
Extending the Colloidal Transition Metal Dichalcogenide
Library to ReS
2
Nanosheets for Application in Gas Sensing
and Electrocatalysis
Beatriz Martín-García,* Davide Spirito, Sebastiano Bellani, Mirko Prato,
Valentino Romano, Anatolii Polovitsyn, Rosaria Brescia, Reinier Oropesa-Nuñez,
Leyla Najafi, Alberto Ansaldo, Giovanna D’Angelo, Vittorio Pellegrini, Roman Krahne,
Iwan Moreels,* and Francesco Bonaccorso*
DOI: 10.1002/smll.201904670
1. Introduction
Transition metal dichalcogenides (TMDCs) are highly interesting and versatile mate rials due to their physicochemical pro perties that can be modified by exfoliation into single or fewlayer structures.[1–4]
Due to quantum confinement and/or surface effects, such single and fewlayer structures can behave differently from their bulk phase and manifest photolumi nescence,[5] catalytically active sites,[6] or
strong light–matter coupling.[7] Moreover,
depending on their composition and struc ture, they can be semiconductors (e.g., MoS2, WS2), metals (e.g., NbS2, VSe2),
or even superconductors (e.g., NbSe2,
TaS2).[1,8] Among the TMDCs, rhenium
disulfide (ReS2) has recently emerged as
an interesting material.[9–11] In contrast to
the wellknown groupVIB TMDCs (MoS2
or WS2), which present a hexagonal crys
talline structure, ReS2 has an unusual dis
torted octahedral (1T) triclinic structure,
Among the large family of transition metal dichalcogenides, recently ReS2
has stood out due to its nearly layer-independent optoelectronic and physicochemical properties related to its 1T distorted octahedral structure. This structure leads to strong in-plane anisotropy, and the presence of active sites at its surface makes ReS2 interesting for gas sensing and catalysts
applications. However, current fabrication methods use chemical or physical vapor deposition (CVD or PVD) processes that are costly, time-consuming and complex, therefore limiting its large-scale production and exploitation. To address this issue, a colloidal synthesis approach is developed, which allows the production of ReS2 at temperatures below 360 °C and with reaction
times shorter than 2h. By combining the solution-based synthesis with surface functionalization strategies, the feasibility of colloidal ReS2 nanosheet films for
sensing different gases is demonstrated with highly competitive performance in comparison with devices built with CVD-grown ReS2 and MoS2. In addition,
the integration of the ReS2 nanosheet films in assemblies together with carbon
nanotubes allows to fabricate electrodes for electrocatalysis for H2 production
in both acid and alkaline conditions. Results from proof-of-principle devices show an electrocatalytic overpotential competitive with devices based on ReS2
produced by CVD, and even with MoS2, WS2, and MoSe2 electrocatalysts.
Dr. B. Martín-García, Dr. S. Bellani, V. Romano, Dr. L. Najafi, Dr. A. Ansaldo, Dr. V. Pellegrini, Dr. F. Bonaccorso
Graphene Labs
Istituto Italiano di Tecnologia via Morego 30, 16163 Genova, Italy
E-mail: [email protected]; [email protected] Dr. B. Martín-García, Dr. A. Polovitsyn, Prof. I. Moreels Nanochemistry Department
Istituto Italiano di Tecnologia via Morego 30, 16163 Genova, Italy
Dr. D. Spirito, Dr. R. Krahne Optoelectronics Group Istituto Italiano di Tecnologia via Morego 30, 16163 Genova, Italy Dr. M. Prato
Materials Characterization Facility Istituto Italiano di Tecnologia via Morego 30, 16163 Genova, Italy V. Romano, Prof. G. D’Angelo
Dipartimento di Scienze Matematiche ed Informatiche Scienze Fisiche e Scienze della Terra
Università di Messina
Viale F. Stagno d’Alcontres 31, S. Agata 98166, Messina, Italy Dr. A. Polovitsyn, Prof. I. Moreels
Department of Chemistry Ghent University
Krijgslaan 281-S3, 9000 Gent, Belgium E-mail: [email protected] Dr. R. Brescia
Electron Microscopy Facility Istituto Italiano di Tecnologia via Morego 30, 16163 Genova, Italy The ORCID identification number(s) for the author(s) of this article
can be found under https://doi.org/10.1002/smll.201904670. © 2019 The Authors. Published by WILEY-VCH Verlag GmbH & Co. KGaA, Weinheim. This is an open access article under the terms of the Creative Commons Attribution License, which permits use, distribution and reproduction in any medium, provided the original work is properly cited.
The copyright line for this article was changed on 4 April 2020 after original online publication.
www.advancedsciencenews.com www.small-journal.com
leading to a strong inplane anisotropy like black phosphorous (BP).[9,10] However, unlike BP, ReS
2 is stable in air.[9,10] The ReS2
structure consists of a P1 symmetry with Re atoms forming Re4 clusters, interconnected in zigzag chains, and distorted S6
octahedra that are formed upon cooperative atomic displacement (Scheme 1).[9,11–13]
Moreover, ReS2 exhibits both metalchalcogen and
metalmetal bonds due to the extra valence electron of Re atoms, since Re belongs to the groupVII of elements.[9,11–13]
This structural anisotropy translates to electrical, optical, vibrational,[15] thermal,[16] and physicochemical properties
that do not depend significantly on the number of layers. For example, ReS2 is a directgap semiconductor (1.4–1.5 eV)
from bulk to monolayer (0.7 nm) thicknesses,[15] unlike MoS 2
or WS2 that instead present an indirect to direct bandgap
(Eg) transition when the thickness is reduced from bulk to a
monolayer.[9,10] The predictability of the physical properties of
ReS2 has made it attractive for a large variety of applications,
in which it can be integrated as monolayer or fewlayer crys tals in polarizationsensitive photodetectors,[17–19] field effect or
heterojunction transistor structures,[20,21] and gas sensors,[25,26]
or as thick nanocrystals or nanocrystal sheets with some tens up to hundred layers in batteries,[24–26] solar cells,[27] and
electrocatalysts.[28,29]
Despite its favorable properties, the feasibility of ReS2 in
technological and economic terms will strongly depend on the development of a scalable synthesis that can be readily
integrated with the current device technology, being compat ible with economic constrictions. In this regard, there are sev eral challenges. First, Re is not an earthabundant element, and therefore, its price (around 2800 € kg−1[30]), determined
by its availability and the market demand, is high in com parison to representative TMDCs, such as Mo and W (less than 30 € kg−1[31]). Moreover, current methods for the pro
duction of ReS2 are mainly based on chemical vapor deposi
tion[19,32–34] (CVD), epitaxial growth,[35] and the Bridgman
method,[20] and rely on high process temperatures (from
450 to 1100 °C) for the precursor decomposition (e.g., the melting points of Re powder 3180 °C; Re–Te eutectoid 430 °C; ReO3 400 °C).[9,10] Moreover, they also imply the use of hal
ogen vapor transport in the case of CVD;[32] or HF treatments
for cleaning in the Bridgman method[20] and as etchant to
delaminate the ReS2 from the mica substrate in the epitaxial
growth.[35] In addition, the aforementioned methods require
long processing times from several hours for CVD[9,10] and
epitaxial growth[9,10] up to several weeks for the Bridgman
method.[9,10,20] Solutionbased techniques, such as chemical
intercalation[36] and liquid phase exfoliation (LPE),[37,38] have
been developed as largescale routes for the ReS2 flakes
production, but in most cases CVDgrown ReS2 is used as
starting material, and therefore these methodologies inevi tably still rely on expensive and demanding processing. To face the challenges related to the fabrication of ReS2, colloidal
synthesis can be an alternative method for its largescale pro duction,[39–41] achieving a compromise between crystal quality
and physical properties that are needed for device applica tions. In fact, colloidal synthesis has already been successful in the development of other TMDCs, such as MoS2,[2,42–45]
Dr. R. Oropesa-Nuñez, Dr. F. Bonaccorso, Dr. V. Pellegrini BeDimensional Spa.
Via Albisola 121, 16163 Genova, Italy
Scheme 1. Sketches of the distorted 1T crystal structure of the ReS2 from different perspectives. Lattice orientations are indicated by the a–b–c axes.
a) A general view of a three-layer system, b) side view of the layers, c) top view of the three layer crystals where the Re4 clusters can be identified,
d) enlarged top view indicating the distances between the atoms. To obtain the crystal structure we used the crystallographic data from Murray et al. and Kelty et al.[12,13] and the VESTA v.3.4.6 software.[14]
MoSe2,[2,46,47] MoTe2,[48] WS2,[49] WSe2,[46] ZrS2,[50] TiS2,[50] and
HfS2.[50]
Transition metal dichalcogenides have already been explored as gas sensing materials showing high sensitivity, room tem perature operation, facile processing, and high resistance to degradation, in order to address the main drawbacks of the materials that are currently used in environmental monitoring such as metal oxides,[51] conducting polymers,[51] and carbon
nanotubes.[51] Recently, an interest in the use of ReS
2 for the
fabrication of gas sensors[22,23] has emerged due to its strong
interaction with nonmetal adatoms (H, N, P, O, S, F, etc.). In transistors built from Scotchtape exfoliated ReS2,[22] a key role
of the sulfur vacancies and interlayer interactions has been demonstrated to enhance the gas sensing capabilities, leading, for example, to better performance than MoS2[52] and gra
phenebased detectors[53] for NH
3 detection. In addition, ReS2
is also sensitive to other gases such as O2 or air, and can be
applied in humidity sensors.[23]
The presence of active sites at the surface, promoted by the stable and distorted 1T structure of the ReS2, can be beneficial
not only for the gas sensing applications but also in electroca talysis for the molecular hydrogen (H2) production from elec
trochemical water splitting,[25,36,54] an important and growing
field due to the high energy density of ≈120–140 MJ kg−1
and sustainability of H2.[55–57] Actually, before ReS2, other
TMDCs have been reported as highperformance hydrogen evolution reaction (HER)electrocatalysts.[6,58–60] In particular,
the groupVIB TMDCs have reached an advanced stage of
development,[6,58–60] exhibiting overpotentials inferior to 0.1 V
at a cathodic current density of 10 mA cm−2 (ƞ
10) in both
acid[61,62] and alkaline[63–65] media. However, only the metallic
edge states of their trigonal prismatic (2H) phase can absorb H+ with a small Gibbs free energy (ΔGH0 ≈ 0.08 eV for MoS2),
acting as active site for HER,[66–68] while the basal planes are
electrocatalytically inactive.[67–69] Recent advances have shown
that the HER activity of groupVIB TMDCs can be significantly
enhanced when the semiconducting 2H phase of MoS2 is
converted into metallic 1T (octahedral) phase.[70,71] In this con
text, the stable and distorted 1T structure of the ReS2 repre
sents an interesting electrocatalyst model, which can be advan tageous compared to groupVIB TMDCs due to its metalmetal
bonds. These bonds create a superlattice structure of Re chains that distort the octahedral structure of 1T phase (C3v
symmetry).[15,28] Consequently, the Gibbs free energy of the
hydrogen adsorption (ΔGH0) on ReS2 basal planes can be as
low as ≈0.1 eV.[28] In fact, recent theoretical and experimental
studies have shown that ReRe bonds serve as electron reser voirs to originate an intrinsic charge distribution regulation, which tunes the Gibbs free energy of the hydrogen adsorption (ΔGH0) on ReS2 basal planes towards the optimal thermoneutral
value (i.e., 0 eV).[54] This value is comparable to that of metallic
edge states of 2HMoS2 (≈0.08 eV).[28,72] However, thanks to
the HERactivity of its basal planes, the ReS2 should exhibit
a higher number of active sites than groupVIB TMDCs.[28] In
addition, in TMDCs such as MoS2 or WS2, the HERactivity
strongly depends on the number of layers due to the depend ence with the Eg, and the HERactivity weakens by passing
from monolayer to fewlayer materials as a consequence of an inefficient intraflake electron transport via a hopping
mechanism.[6,69] In contrast, the nearly layerindependent
properties of ReS2 make it a suitable catalyst, either monolayer
or multilayer structures,[9,15] as it has been demonstrated in 3D
structures composed by multilayer (≥17L) ReS2 flakes.[28,29]
In this work, we report a colloidal approach for the synthesis of ReS2 nanosheets, starting from ReCl5 and elemental sulfur as
precursors. The obtained ReS2 sheets are tested as active mate
rial in gas sensors and HER. For the colloidal synthesis of the ReS2 nanosheets, we use elemental sulfur instead of CS2[42,49,50]
or dodecanethiol (DDT)[43,50] that are used as sulfur source for
the colloidal synthesis of other TMDCs.[42,43,49,50] The advantage
of using elemental sulfur relies on the fact that it is much less hazardous and/or toxic than the aforementioned precursors. We compare the properties of the colloidal ReS2 with their bulk and
LPE counterparts, and find that the colloidal ReS2 nanosheets
have a similar composition and Eg, but lower crystallinity. We fab
ricated gas sensors for a variety of agents by electrically contacting homogenous films of colloidal ReS2 nanosheets. With suitable
ligands for the surface functionalization of the colloidal ReS2
nanosheets, we are able to enhance the gas sensor sensitivity to toxic gases (NH3) and humidity, compared to their nonfunction
alized counterparts. Sensitivity, recovery and time response of the functionalized gas sensors based on colloidal ReS2 nanosheets
can compete with gas sensors fabricated from CVDproduced ReS2 reported in literature.[23] Concerning the HER activity in
acidic media, a mixture of colloidally synthesized ReS2 in com
bination with carbon nanotubes, resulted in electrodes that can compete with the stateofart CVD (KI)aided ReS2.[54]
2. Results and Discussion
The colloidal ReS2 nanosheets were synthesized from ReCl5
and elemental sulfur by a syringe pump method,[42,44,47–49] in
which the Reprecursor is added dropwise in a Soleylamine (SOlAm) solution at 350 °C. This procedure follows the use of chloride metal precursors[42,48–50] and the progressive injec
tion method[42,44,47–49] for the colloidal synthesis of TMDCs, but
it introduces elemental S as the sulfur source. The chalcogen source can play a role in the growth kinetics, in particular in the formation of H2S. Cheon’s group demonstrated that sudden
H2S influx, triggered by CS2, favors the formation of nanodisks,
while continuous H2S formation with DDT leads to flakes.[50]
With elemental sulfur as chalcogen source we obtained nanosheets, and therefore assume slow H2S kinetics in the
oleylamine medium, with a release of ≈75% over a 3 h heating period.[73] For the nucleation and growth of the nanosheets,
we added the ReCl5oleic acid (OA) precursor dropwise, with a
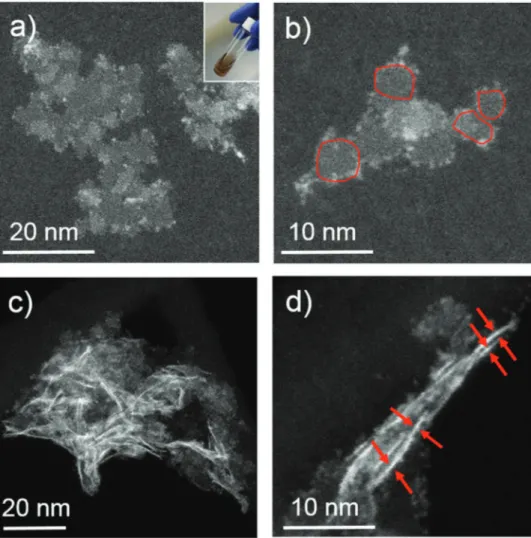
syringe pump, to the hot solution. Highangle annular darkfield scanning transmission electron microscopy (HAADFSTEM) images in Figure 1a,b (see also Figure S1a in the Supporting Information) show the formation of colloidal ReS2 nanosheets
(hereafter, cReS2) with variable dimensions, formed by indi
vidual domains with a lateral size of ≈4 ± 1 nm. Moreover, some cReS2 nanosheets are found lying perpendicular to the
support film (Figure 1c,d). From these images a thickness of ≈0.4 ± 0.1 nm is estimated for individual cReS2 nanosheets.
This value is lower than the 0.7 nm reported for mechanically exfoliated monolayers in ReS2.[15] The discrepancy can be
www.advancedsciencenews.com www.small-journal.com
attributed to the heavy strain building up in these highly ani sotropic colloidal 2D structures, leading to inplane expansion of the lattice and contraction along the outofplane direction.[74]
The obtained cReS2 nanosheets are comparable in morphology
to other colloidal TMDC materials such as MoS2,[42,43,45] WS2,[50]
or WSe2[46] reported in literature. The ReS2 sheets prepared
by LPE (hereafter named LPEReS2), as control material, do
not show aggregation as demonstrated in Figure S2a,b in the Supporting Information. Regarding the nanosheet formation, previous studies on the CVD production of ReS2 proved that
there are two growth mechanisms: a fast one in (100) direc tion, and a slow one in (020) direction. To obtain nanosheets with a 1T distorted octahedral structure, the growth rate in both (100) and (020) directions should be comparable,[19] which
may be achieved by oleic acid, oleylamine and Cl− (from the ReCl5) acting as ligands that passivate different crystal facets. In
order to gain insight into the crystal structure, we compare the selectedarea electron diffraction (SAED) patterns from cReS2
nanosheets and LPEReS2 flakes showing comparable 2θ values
for Bragg peak positions (see Figure S3 in the Supporting Information for the TEMSAED patterns), which correspond to
the 1T distorted octahedral structure. Furthermore, broader dif fraction features characterize the cReS2 nanosheets, due to the
much smaller size of singlecrystal domains (few nm or less in the colloidal sample vs hundreds of nm for LPE flakes).
The composition of the asprepared cReS2 was investi
gated by XRay photoelectron spectroscopy (XPS), as shown in
Figure 2a,b, revealing an atomic stoichiometry Re:S of 1:1.3,
which is estimated from the Re 4f and S 2p spectra. This ratio is slightly smaller than the one expected from the 1:2 ReS2
stoichiometry. However, also the LPE fabricated samples and bulk ReS2 yield lower Re:S stoichiometric values of around
1:1.6 and 1:1.7, respectively (see also Figure S1e in the Sup porting Information for complementary elemental analysis). It is interesting to note that in the LPE and bulk cases, the S 2p signal can be decomposed in two different doublets, cor responding to two different chemical environments of sulfur. Similar results have been reported by Dalmatova et al.,[75] and
the two S components have been assigned to ReS2 (doublet at
lower binding energy, with S 2p3/2 component at ≈161.4 eV)
and to S atoms that are not connected to Re atoms (doublet at higher binding energy, with S 2p3/2 component at ≈162.1 eV).
Figure 1. Representative HAADF-STEM images of the c-ReS2 nanosheets, showing a,b) nanosheets lying mainly parallel to the support film, with
individual domains highlighted in (b). In c,d) the nanosheets lie mainly perpendicular to the carbon support film, as clarified in (d) by arrows pointing at nanosheets viewed along their side. The inset in (a) shows a photograph of the c-ReS2 dispersion in toluene.
However, we cannot discard that the two S components come from the existence of different ReS bond lengths in the dis torted ReS2 structure, as illustrated in Scheme 1d.[12,13] For col
loidal ReS2, a good fitting of the S 2p profile was obtained by
using two doublets as for the LPE and bulkcounterparts, with S 2p3/2 components at ≈161.6 and ≈162.2 eV. Moreover, XPS
peaks in cReS2 are broader than the ones for the LPE and bulk
materials likely indicating a less crystalline structure in the colloidal case.[76] To support this statement, we also evaluated
the extinction coefficient and Raman spectra of the materials, which are plotted in Figure 2c,d,e. As expected for ReS2,[9,10,77]
the cReS2 material shows a strong and broad extinction from
300 to almost 1000 nm. However, in contrast to its LPE equivalent,
there is no clear excitonic peak at ≈810 nm that corresponds to the Eg of the ReS2.[77] The Eg was obtained from the (αhν)n
versus hν (Tauc plot) analysis (see Figures S1d and S2c in the Supporting Information) using the Tauc relation Ahν = Y(hν
Eg)n, in which A is the absorbance, h is Planck’s constant, ν is
the photon’s frequency, and Y is a proportionality constant.[78]
The value of the exponent denotes whether it is a direct transi tion (n = 2) or an indirect one (n = 0.5).[79] Since ReS
2 is a direct
bandgap semiconductor, we applied n = 2, resulting in an Eg
of ≈1.41 eV (colloidal) and ≈1.43 eV (LPE). Both values are in agreement with the theoretical (1.41 eV)[80] and experimental
values (1.4–1.5 eV) from bulk to monolayer (0.7 nm) thick nesses.[15] The analysis of the Raman spectra in Figure 2d,e
Figure 2. a,b) Re 4f and S 2p XPS core-level spectra collected from the c-ReS2, LPE-ReS2, and bulk-ReS2 samples, in which the fitting reveals the
decon-voluted peaks. c) Extinction spectra of c-ReS2 and LPE-ReS2 dispersed in toluene and isopropanol, respectively. An offset was applied to the curves for
clarity. d,e) Representative Raman spectra collected at d) 532 and e) 785 nm excitation wavelength on the c-ReS2, LPE-ReS2, and bulk ReS2 samples
www.advancedsciencenews.com www.small-journal.com
has been performed following the detailed reports on ReS2
carried out by Balicas’ and Terrones’ groups,[81,82] which iden
tified 18 firstorder modes in the 100–450 cm−1 range (for Raman peaks interpretation, see the Supporting Information). Since in the randomly oriented assembly of the nanosheets we cannot control the crystal orientation, we performed a comparative Raman analysis at two different excitation wave lengths, i.e., 532 and 785 nm. Independently of the excitation wavelength and synthesis batch, the Raman peaks from the colloidal sample are broader than the corresponding ones in the LPE sample. Such broader linewidth in the Raman signal of the colloidal sample indicates a lower degree of crystallinity compared to the LPE one,[83] which can be related to the differ
ence in the temperature that is needed for their preparation. Highly crystalline ReS2 fabricated by CVD requires a tempera
ture >600 °C,[35] while the colloidal synthesis is performed at
350 °C. The low crystallinity of the cReS2 might also be the
cause for the absence of the excitonic peak in its extinction spectrum in Figure 2c.
For both colloidal and LPE samples, the following Raman modes are enhanced at 785 nm excitation compared to the 532 nm excitation, Ag9 (273 cm−1), Ag10 (279 cm−1),
Ag12 (305 cm−1), Ag13,14 (322 cm−1), Ag16 (366 cm−1), Ag17
(373 cm−1), A
g18 (405 cm−1), and Ag3 (417 cm−1), while the Ag15
(350 cm−1) and Ag2 (440 cm−1) modes disappear, indicating that
the samples are composed by fewlayer (2L–4L) ReS2 sheets,
in agreement with the data reported by Terrones’ group.[82] In
order to prove that our colloidal synthetic approach can be ver satile also for other materials, we fabricated ReSe2 using Se
powder as chalcogen source (see Figure S4 in the Supporting Information for synthesis details and material characterization).
In order to test the suitability of the ReS2 sheets as films for
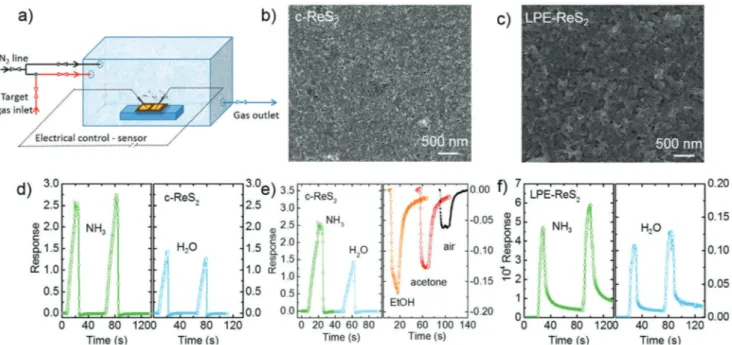
gas sensing, and to compare the performance of the colloidal and LPE samples, we prepared their corresponding films on glass substrates by drop casting (Figure 3a). For the cReS2
nanosheets, we used the original dispersion for drop casting, followed by annealing at 300 °C in a glovebox (3 h) to remove the organic ligands from synthesis (oleic acid and oleylamine) with the aim to make the film electrically conductive. Films from LPE samples were fabricated by drop casting without any further treatment. In this way, we obtained continuous and compact films with thickness of ≈400 nm, as shown in the scanning electron microscopy (SEM) images in Figure 3b,c (see the Experimental Section for fabrication details). The devices were completed by the evaporation of Au electrodes as contacts. All devices manifest an ohmic behavior (see Figure S5a in the Supporting Information for conductance measurements under inert –N2– atmosphere), however the resistance of the devices
made from the cReS2 is much lower (460 MΩ) than the one of
devices fabricated with LPEReS2 (5.9 GΩ). For gas sensing via
the detection of conductance changes of the film, we positioned the samples inside a chamber with controlled atmosphere connected to a probe station (see Figure 3a and the Experi mental Section for details on the gas filling of the chamber and measurement protocols). From the gas flow rates we estimate the filling and purging time of the chamber to be around 1s, which is shorter than the response times that we measured on our devices. We tested the response to humidity, to NH3 that
is a toxic agent, and to ethanol (EtOH) and acetone as repre sentative volatile organic compounds. Figure 3d–f shows the representative response ( ) for different gases of the devices obtained via the relative changes of the film conductance
Figure 3. a) Sketch showing the chamber used for the gas sensing experiments. b,c) Representative SEM images of the colloidal and LPE-ReS2
-based gas sensors, respectively. The films (≈400 nm thickness) were prepared by drop casting the corresponding dispersions on glass substrates. d) Representative gas-induced time response of the device built with ann-ReS2 in two consecutive cycles exposed to NH3 (left) and H2O (right). e)
Rep-resentative gas-induced time response of the device built with ann-ReS2 exposed to different gases: NH3, H2O (left), EtOH, acetone, and dry air (right).
f) Representative gas-induced time response of the device built with LPE-ReS2 exposed in two consecutive cycles to NH3 (left) and H2O (right). In all
(G)[51] in the presence of the target gas compared to inert (N 2)
atmosphere, (= Ggas−Ginert)/Ginert. The numerical values are
reported in Table S1 in the Supporting Information, in which also the response in terms of resistance is given for comparison with literature.
For NH3 and H2O, the response of the gas sensors is posi
tive, i.e., the conductance under the target gas is higher compared to that under the inert N2 atmosphere. This can be
explained by physisorption of the gas molecules that act as electron donors.[22,23,51,84,85] The higher response for gas sen
sors based on ReS2 under NH3 compared to air and O2 was
also reported in theoretical studies.[22] For NH
3 detection, the
relative response of the devices built from LPEReS2 flakes
(hereafter, "LPE devices") (Figure 3f) is much higher compared to the ones fabricated from annealed cReS2 (in the following
noted as "colloidal devices"). However, this result is mainly related to the very low electrical conductivity of the LPE device under inert atmosphere. In fact, the recovery time of the LPE devices to the initial currents (i.e., in the nA range) is of the order of hours, while the recovery time of the colloidal devices is of the order of seconds (see Table S2 in the Supporting Information for rise and fall times of conductance response of the different devices; and Tables S3 and S4 in the Supporting Information for estimated minimum amounts detectable with the technique). In practical terms, this means that, for detection with response times of few seconds, the baseline of the LPE device is at a value of ≈1000, and therefore the rela tive response to NH3 at such time scales is ≈10, while that of
the colloidal device is ≈2.5–3. Concerning humidity detection, the response of the devices made from cReS2 ( = 1.2; rise
time (τR= 8.7 s); fall time (τF= 0.3 s)) outperforms clearly the
ones based on LPE flakes ( = 8.8; τR = 5.2 s; τF = 31 s). In
fact, the recovery time to return to 10% of the response after the gas flow stopped is one order of magnitude shorter for cReS2 compared to the LPE flakes one. For EtOH, acetone
and compressed air the conductance of the devices made from cReS2 decreases compared to one achieved in inert N2 atmos
phere (Figure 3e). This result can be rationalized by oxida tion of the film due to the incorporation of electron acceptor molecules.[51,84,85] Furthermore, the relative conductivity change
of the devices made from cReS2 exposed to EtOH, acetone and
compressed air is much weaker ( EtOH= −0.15; acetone= −0.12;
and air = −0.06) and slower in recovery (EtOH: τR = 5.2 s;
τF = 25 s; acetone: τR = 1 s; τF = 56 s; and air τR = 2.3 s;
τF = 12 s) as compared to their exposure to NH3 ( = 2.4;
τR = 9.3 s; τF = 1.3 s) or H2O ( = 1.2; τR = 8.7 s; τF = 0.3 s).
The circumstance that the cReS2 are passivated by organic
ligands opens the possibility to manipulate the film conduc tivity by ligand exchange with other molecules. We therefore use this approach to improve the performance of the cReS2
based sensors, in terms of recovery time and response. In par ticular, we performed a ligand exchange process that replaces the longchain organic ligands used in the synthesis (oleic acid and oleylamine, both with a C18 aliphatic chain) with shorter
molecules that contain Cx aliphatic chains with x < 4 or an
aromatic ring (see the Experimental Section for more details). Shorter ligands lead typically to stronger coupling of the nanomaterial in a compact film, which increases the charge carrier mobility.[86,87] Moreover, chemical modification of the
nanomaterial surface by ligand exchange can modify the elec tronic properties of the material, as well as its reactivity with the functional groups of the gas molecules.[51,84] We tested
different short chain molecules in this respect: 3mercapto propionic acid (MPA), 1,4benzenedithiol (BDT) and 4amin obenzoic acid (ABA), and performed the ligand exchange in solution. The films from the ligandexchanged solutions were prepared by dropcasting, which ensured a compact film with a thickness of ≈400 nm (Figure 4a,b, also see Figure S6 in the Supporting Information for additional characterization). A larger S contribution in the XPS signal (compared to the samples before ligand exchange) that results from the thiol groups of the exchanged molecules confirmed the presence of MPA and BDT molecules. Concerning the exchange with ABA, the success of the ligand exchange process can only be assessed from the increase of the conductivity, since the char acteristic N 1s XPS peak (NH2, at 400.5 eV) also originates
from oleylamine. The ligandexchanged films also show ohmic conductivity, and their resistance strongly depends on the indi vidual ligands (see Figure S5b in the Supporting Information for conductance measurements under inert –N2– atmosphere).
Here, devices made from MPAexchanged cReS2 manifested
the highest conductance (R = 120 MΩ), followed by ABA (R = 510 MΩ) and BDT (R = 200 MΩ). Compared to the orig inal device discussed in Figure 3, we achieved an increase in electrical conductivity by a factor of 4 with the MPA ligands. We tested the ligandexchanged films for gas sensing with the same procedure as described before. Overall, we observe similar behavior before and after the ligand exchange process, with an electrical current increase under NH3, H2O, and CO2,
and, instead, decrease under EtOH, acetone and air. Figure 4c depicts the response of the device built from MPAexchanged cReS2 nanosheets to different gases: NH3, H2O, and CO2
that lead to current increase, and EtOH, acetone and air that result in a small current decrease. Therefore, we can assume that in all the cases, colloidal, LPE, and ligand exchange fab ricated devices, the sensing mechanism is based on a charge transfer between the physisorbed gas molecules and the ReS2
structure.[51,85] Figure 4d shows the response of the gas sen
sors made with ligandexchanged cReS2 films when exposed
to NH3. In this context, the device made from MPAexchanged
cReS2 shows the highest response ( = 31, with a response
time of 3.3 s), followed by the ones built from BDT and ABA exchanged cReS2. The functionalization of cReS2 with BDT
yields a higher sensitivity ( = 24 response for NH3 detection)
than ABA ( = 16 response for NH3 detection), although the
conductance of ABA (RABA= 510 MΩ vs RBDT= 200 MΩ) is
higher under inert atmosphere. The different results in terms of sensitivity and responsivity obtained without and with the functionalization of cReS2, and even more, by varying
the molecules used for the functionalization, point to the importance of: i) possible sites for the binding of gas mole cules; ii) the efficiency of charge transfer for the gas sensing sensitivity, and iii) a good film conductivity, which is benefi cial for a fast response and recovery. Here, we can expect a tradeoff between a film with high surface area that is ben eficial for interaction with the gas molecules, and a compact film that results in high conductivity and from which a fast response can be expected. In particular, the high sensitivity
www.advancedsciencenews.com www.small-journal.com
obtained with the BDT and MPA ligand exchange for NH3
( BDT = 24 and MPA= 31, respectively) and H2O ( BDT= 2.4
and MPA = 4.5, respectively) points to a beneficial role of the
SH groups of MPA and BDT for physisorption of the gas molecules and the electron transfer towards the ReS2 film.
We note that the performance of the device made from MPA exchanged cReS2 is superior to the one built with LPEReS2
in Figure 3 in terms of sensitivity and response time (e.g., for NH3 detection, = 9.9, with a response time of 5.2 s for
LPEReS2 and = 31, with a response time of 3.3 s for MPA
exchanged cReS2).
The gas sensor built from MPAexchanged cReS2 outper
forms, to the best of our knowledge, those reported in litera ture fabricated with CVDgrown ReS2.[23] The humidity sensor
reported by Yang et al.[23] made by CVDgrown ReS
2 has a resist
ance variation of ≈−60% at a relative humidity of 70%, with a response time of the order of tens of seconds, while our gas sensor fabricated with MPAexchanged cReS2 reaches a varia
tion of 80% with much faster response time (4.1 s) and compa rable recovery time (1 s). Gas sensing (NH3, O2, air) has been
also reported from phototransistors made from micromechani cally exfoliated ReS2 flakes,[22] with a response time in the order
of ms. However, this response time is related to the illumina tion of the device and therefore does not directly compare to our devices that work in dark condition. Concerning the gas sen sors for NH3 and EtOH based on other 2D materials, we note
that our MPAfunctionalized cReS2 based sensor has a faster
response time and better recovery of the initial conductance
state than devices that use micromechanically exfoliated or CVDgrown MoS2.[88,89]
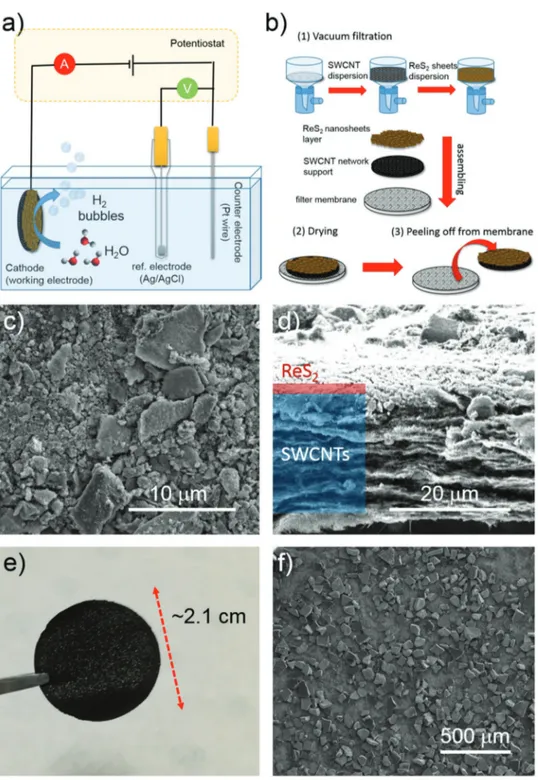
Finally, we tested cReS2 films as an electrocatalytic film for
HER (Figure 5a). To make the cReS2 more electrochemically
active, we isolated the nanosheets from the dispersion by cen trifugation and solvent evaporation. The obtained powder was then treated by thermal annealing (Ar flow, 500 °C) to remove the organic ligands from synthesis, and thereby expose the cat alytically active surface of the nanosheets. After the annealing, the cReS2 powder was dispersed in Nmethyl2pyrrolidone
(NMP) by ultrasonication, and the obtained dispersion was used for the deposition on glassy carbon (GC) rigid electrodes and singlewalled carbon nanotubes (SWCNTs)based flexible papers (i.e., buckypapers) (Figure 5b) (see the Experimental Section for more details). The choice of the SWCNTbased paper as support relies on our recent works,[61,63] in which we
demonstrated a longrange (≥1 µm) electrochemical coupling between HERactive TMDCs and SWCNTs for increasing the HERactivity of TMDCs.[61,63] Moreover, the porosity of such
substrate promotes the adhesion of the TMDC films without the need of ion conducting catalyst binders[61,63,90,91] (e.g.,
Nafion in acid solution[92] and Tokuyama AS4 in the alkaline
one[93]), which can degrade the electrocatalytic activity of the
catalyst.[94,95] The GCbased electrodes were obtained by drop
casting the cReS2 dispersions at a mass loading of 0.13 mg
cm−2. The hybrid SWCNTs/cReS2 electrodes were produced
through a sequential vacuum filtration deposition of the mate rial dispersions onto nylon membranes (material mass loading
Figure 4. a,b) Representative SEM images of the device built from MPA-exchanged c-ReS2. The film (with ≈ 400 nm thickness) was prepared by drop
casting the corresponding dispersion. c) Representative gas-induced response time of the device made from MPA-exchanged c-ReS2 under the
expo-sure to different gases: (left) NH3, H2O, and CO2, (right) EtOH, acetone, and dry air. The inset in the left panel shows the CO2 data on a magnified
scale. d) Comparison of the device performance in terms of response to NH3 exposure for the different ligand molecules used: MPA, ABA, and BDT.
of 1.5 mg cm−2 for both SWCNTs and cReS
2 (5 mg of each
material)). Figure 5c,d display topview and crosssectional SEM images of a representative SWCNTs/cReS2 electrode. The
cReS2 form a film atop the SWCNTs network, and the elec
trode shows a bilayer architecture with ≈20 µm thick SWCNT based collector and a thin cReS2based active film (thickness
in the order of 1 µm). The highmagnification SEM image (Figure 5c) reveals the presence of lateral cReS2 aggregates
with various dimensions, in the 0.5–10 µm range. The smallest cReS2 aggregates (lateral size <500 nm) penetrate the
mesoporous SWCNT network (see Figure S9 in the Supporting Information). For such configuration, SWCNTs increase the electron accessibility to the HERactive sites of cReS2, speeding
up the HERkinetics compared to flat GC.[61,90,96,97] Figure 5e
shows a topview photograph of the asproduced SWCNTs/c ReS2 (electrode area of ≈3.5 cm2), in which the presence of
Figure 5. a) Scheme of the electrochemical setup for measuring the electrocatalysts. b) Sketch of the fabrication of the c-ReS2-based electrodes on
SWCNTs c,d) Top-view and cross-sectional SEM images of SWCNTs/c-ReS2. e) Top-view photograph of SWCNTs/c-ReS2 (electrode area: 3.5 cm2).
www.advancedsciencenews.com www.small-journal.com
ReS2 aggregates is visible. Such aggregates are also evident in
SEM images (Figure 5f) with a lateral size ranging from 50 to 200 µm.
The HERactivity of the SWCNTs/cReS2 was tested in both
in acidic (0.5 m H2SO4) and alkaline (1 m KOH) media. In prin
ciple, the HER in acidic solution proceeds with an initial dis charge of the hydronium ion (H3O+) and the formation of atomic
H adsorbed on the electrocatalyst surface (Hads), in the socalled
Volmer step (H3O+ + e− ⇄ Hads + H2O), followed by either
an electrochemical Heyrovsky step (Hads+ H3O++ e−⇄ H2+
H2O) or a chemical Tafel recombination step (2Hads ⇄ H2).
In alkaline media, the Hads is formed by discharging H2O (H2O
+ e− ⇄ H
ads + OH−). Then, either a Heyrovsky step (H2O +
Hads + e− ⇄ H2 + OH−) or a chemical Tafel recombina
tion step (2Hads ⇄ H2) occurs. Apart from the cathodic cur
rent density ƞ10, the Tafel slope is also an important figure
of merit to assess the HERactivity of an electrode.[98]
However, a rigorous kinetic analysis of the HER through the Tafel slope analysis was not carried out for our elec trodes, since SWCNTs hold a high surface area that leads to a remarkable capacitive current density (in the order of 1 mA cm−2) even at a low LSV sweep voltage rate (≤5 mV s−1).
This can be the cause of misleading interpretations of the esti mated kinetic parameters.[63,99]
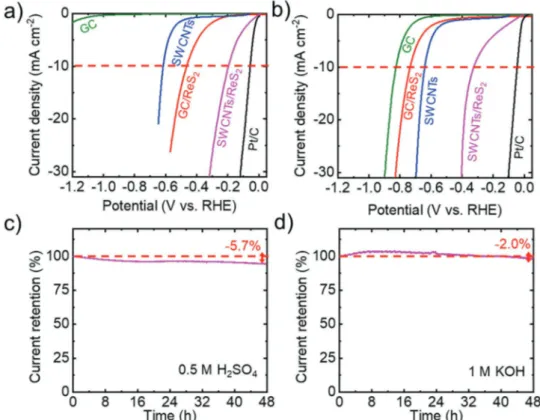
Figure 6a,b shows the currentresistance (iR)corrected
polarization curves of GC/cReS2 and SWCNTs/cReS2 elec
trodes in acidic (0.5 m H2SO4) and alkaline (1 m KOH) aqueous
solutions, respectively. The series resistance that arises from
the electrical resistance of the working electrode and the elec trolyte resistance, i.e., R, was extrapolated by single frequency electrochemical impedance spectroscopy (EIS) (see the Experi mental Section for further details). The curves measured for the substrates, i.e., GC and SWCNTs, are also shown as ref erences. The curve measured for commercial platinum on carbon (Pt/C) is reported as benchmark for HER. The cReS2
based electrodes show an enhanced HERactivity compared to those of the substrates, i.e., GC and SWCNTs. Noteworthy, the use of SWCNTs as the substrate significantly increases the cathodic current densities, i.e., the HERactivity, com pared to those shown by CG/cReS2. Thus, in acidic media,
ƞ10 decreases from 0.465 V for the GC/cReS2 to 0.196 V for
SWCNTs/cReS2. In alkaline solutions, GC/cReS2 electrode
is poorly HERactive (ƞ10 > 0.7 V). Interestingly, SWCNTs/c
ReS2 electrode exhibits a ƞ10 of 0.299 V, indicating that the
SWCNTs and cReS2 interact to synergistically enhance the
HERactivity of the electrode. This effect is attributed to the activity of the SWCNTs for initiating the H2O discharge, thus
accelerating the Volmer reaction on the cReS2 in alkaline
conditions.[100] In addition, it is worth noticing that SWCNTs/c
ReS2 displays an HERactivity in acidic media comparable to
the one shown by SWCNTs/LPEReS2 (ƞ10= 0.192 V), which,
however, shows a better HERactivity in alkaline media (ƞ10 = 0.238 V). The morphological and electrochemical char
acterization of SWCNTs/LPEReS2 electrode is reported in
Figure S10 in the Supporting Information. Electrochemical impedance spectroscopy measurements do not show any
Figure 6. a,b) iR-corrected polarization curves measured for GC, SWCNTs, CG/c-ReS2, SWCNTs/c-ReS2, and Pt/C in acidic (0.5 m H2SO4) and alkaline
(1 m KOH) solutions, respectively. c,d) Chronoamperometry measurements (current retention vs time) for the SWCNTs/c-ReS2 electrode in 0.5 m H2SO4
and 1 m KOH solutions. A constant overpotential has been applied in order to give an equal starting cathodic current density of 20 mA cm−2. The inset
significant differences between SWCNTs/cReS2 and SWCNTs/
LPEReS2 (see Nyquist plot in Figure S11 in the Supporting
Information). Moreover, we estimated the doublelayer capaci tances (Cdl) of cReS2 and LPEReS2 films deposited on GC from
cyclic voltammetry (CV) measurements (see for further details, Figure S12a in the Supporting Information). The calculated Cdl
values, ≈0.162 mF cm−2 for cReS
2 film and ≈0.110 mF cm−2
for LPEReS2 film, indicate that the electrochemical acces
sible surface area of cReS2 film is superior to the one of the
LPEReS2 film. The larger accessible surface area of cReS2 (≈
4 ± 1 nm determined by TEM), compared to the LPEReS2, can
be attributed to the small lateral size of the cReS2, as well as
their arrangement relatively to the substrate (see Figure S12b,c in the Supporting Information).
Beyond the electrocatalytic activity, the durability is another important criterion for the exploitation of an electrocatalyst. Figure 6c,d shows the chronoamperometry measurements (current retention vs time) for SWCNTs/cReS2, in acidic and
alkaline solutions, respectively. A constant overpotential was applied in order to provide the same starting cathodic current density of 20 mA cm−2 for HER. Glassy carbon rod has been used as counterelectrode to avoid Pt dissolution/redeposition effects altering the HERactivity of working electrode in pres ence of Ptbased counter electrodes. In both acidic and alkaline media, SWCNTs/cReS2 exhibit a nearly stable behavior over
48 h (current retention of 94.3% and 98.0%, respectively). The slight fluctuation of the HERactivity can be tentatively attrib uted to morphological changes of the electrode film during the HER process. Similar effects have been previously observed in electrocatalysts based on metallic TMDCs, such as TaS2[101] and
NbS2[91,102] nanosheets, as well as in other 2D materialbased
electrodes, including graphenebased electrocatalysts.[103] In
fact, the mechanical stresses originated by H2 bubbling can
cause a reorientation/fragmentation of the 2D electrocatalysts, which, consequently, shows higher electrochemically acces sible surface area.[101,102,104] Moreover, such mechanical stresses
occasionally caused the formation of cracks in the active mate rial films, as observed by SEM image analysis of additional electrodes (Figure S13, Supporting Information). This led to a significant change of the cathodic current of the electrodes over time in both acidic and alkaline media. For example, in acidic media some electrodes reported an increase of the initial HERactivity over 24 h, achieving a ƞ0= 0.162 V versus RHE
(see Figure S14a in the Supporting Information). This behavior might be attributed to the progressive increase of the H+ acces sibility to the HERactive sites of the electrodes.[101,102,104] In
alkaline media, the electrodes often displayed an increase of the electrical resistance (e.g., from 4.4 to 45.9 Ω, measured by single frequency EIS), which caused a decrease of 21.5% of the initial current density (see Figure S14b, Supporting Informa tion). Despite the decrease of the HERactivity of the electrode, the iRcorrected polarization curves shows an electrochemical activation of the cReS2 after 24 h (ƞ10 reduced from 0.327 to
0.181 V), similarly to the electrodes tested in acidic media. The use of electrocatalyst binders, such as sulfonated tetrafluoro ethylenebased fluoropolymer copolymers (e.g., Nafion), could prospectively “freeze” an optimized electrode morphology of the current electrodes, as well as an increase of the electrode durability under HERoperation.
Table 1 summarizes the ƞ10 achieved by our electrode in
comparison with those reported by different literature results on ReS2based electrocatalysts, as well as other promising elec
trocatalysts based on other TMDCs (MoS2,[67,96,105–107] WS2,[108]
and MoSe2[61]) and phosphides (NiCo2Px).[109] In particular,
in acidic solution, ƞ10 of SWCNTs/ReS2 (0.196, 0.162 V after
24 h stability test) approaches the best values obtained by ReS2
based electrocatalysts (0.147 V),[54] which come from a defect
activated monolayer ReS2 grown by CVD. These results indi
cate that there is still room for improvement in our system by properly optimizing the material surface in future experiments, as it has also been demonstrated for other TMDCs.[105,110,111]
Additionally, the HERperformance of our electrocatalysts are comparable or superior to those previously reported for elec trocatalysts based on other TMDCs (ƞ10 values between 0.170
and 0.372 V), concretely, in absence of either mechanical strain or doping effects, including the most studied MoS2,[67,96,105–107]
WS2,[108] and MoSe2.[61] The relevant electrocatalytic proper
ties of ReS2 have been recently attributed to the presence of
metalmetal bonds (not present for groupVIB TMDCs),[9,11–13]
which are highly HERactive sites in presence of vacancies causing an intrinsic HERpromoting optimization of the elec tronic charge distribution.[54] Moreover, we reported here also
the HERactivity of ReS2based electrocatalyst in alkaline con
ditions, providing new insight for the development of pH universal electrocatalysts to be exploited as cathode materials in current largescale H2 production technologies,[112–114] e.g.,
chloroalkaline systems[115] or alkaline zerogap water elec
trolysis units,[116] and proton exchange membrane (PEM)
electrolysis.[117,118]
3. Conclusions
We report a bottomup approach for the synthesis of colloidal ReS2 (cReS2) nanosheets that relies on low fabrication tem
peratures (below 360 °C) and process times inferior to 4 h. We use elemental sulfur as source, which is more accessible and environmentally friendly than other precursor materials currently used in the colloidal synthesis of different TMDCs. Dropcast cReS2based films are tested as gas sensors for a
variety of agents, achieving highly competitive performance after annealing or ligand exchange in comparison with devices built with CVDReS2 or MoS2. Furthermore, the colloidal
ReS2 nanosheets were tested as HERelectrocatalysts operating
both in alkaline and acidic media. In particular, electrodes made by cReS2 films deposited on SWCNT (SWCNTs/cReS2)
exhibit overpotentials at a cathodic current density of 10 mA cm−2 (ƞ10) of 0.196 V in 0.5 m in H2SO4 and 0.299 V in 1 m
KOH. In acidic media, the ƞ10 of SWCNTs/cReS2 approaches
the best values obtained by CVDgrown defectactivated ReS2
based electrocatalysts. In comparison with nonoptimized electrocatalysts based on other groupVIB TMDCs, the ReS2
based electrocatalysts here developed exhibit similar or even superior HERactivity. The cReS2 can therefore present a
promising solution for the fabrication of gas sensors and HER electrocatalysts, with still considerable room for improve ment by exploiting device designs and finely tuned surface modifications.
www.advancedsciencenews.com www.small-journal.com
4. Experimental Section
Materials: Rhenium (V) chloride (ReCl5, 99.9%, Alfa Aesar); sulfur
powder (99%, Strem Chemicals); oleic acid (OA, 90%, Sigma Aldrich, degassed at 100 °C 2 h); oleylamine (OlAm, 70%, Sigma Aldrich); 1-octadecene (ODE, 90%, Sigma Aldrich, degassed at 150 °C 3 h); acetone (≥99.5%, Sigma Aldrich); ethanol (EtOH, (≥99.8, without additive, Sigma Aldrich); methanol (MeOH, ≥99.8%, Sigma Aldrich); 2-propanol (IsOH, ≥99.8%, Sigma Aldrich); 3-mercaptopropionic acid (MPA, ≥99%, Sigma Aldrich); 4-aminobenzoic acid (ABA, ≥99%, Sigma Aldrich); 1,4-benzenedithiol (BDT, 97%, Alfa Aesar). Au pellets (99.999%) were purchased from Kurt J. Lesker.
Colloidal Synthesis of ReS2 Nanosheets: The general procedure to
obtain c-ReS2 consists in the use of two separated precursor solutions:
one in the round-bottom flask and the second one added by syringe pump method. For the reaction, a metal:chalcogenide molar ratio of 1:6 was used . The dispersion that contained the Re precursor (ReCl5 67 mg)
was prepared by sonication in a bath at 60 °C (1 h) with 500 µL OA + 2 mL ODE. This was added by syringe pump (rate 2 mL h−1) in a hot
medium under Ar flow (350 °C) of S-OlAm. The synthesis medium itself was prepared by mixing 35 mg S with 7 mL OlAm and degassing under
Ar during 2 h at 250 °C in a Schlenk line until a clear orange-brownish solution was achieved. The reaction temperature was set to 350 °C. The suspension as obtained from synthesis was purified twice (in air) by adding toluene, acetone, and isopropanol (15:10:5 mL), followed by centrifugation (2599 × g, Sigma 3-16P centrifuge, rotor 19776). The sheets were finally dispersed in toluene using a vortex.
TEM: The morphology of the synthesized c-ReX2 nanosheets and
LPE-ReX2 (X = S or Se) flakes was evaluated by transmission electron
microscopy in a JEOL JEM-1011 microscope (W filament), operated at 100 kV. Samples were drop cast on carbon-coated copper grids. Selected area electron diffraction patterns and overview TEM images were also acquired with a JEOL JEM-1400Plus TEM, with a thermionic source (LaB6 crystal), operated at 120 kV. Selected area electron diffraction
pattern processing (azimuthal integration, background subtraction) was done using the PASAD plugin for Digital Micrograph.[120] High-angle
annular dark-field scanning TEM and bright-field TEM imaging at higher magnification of the c-ReX2 nanosheets (X = S or Se) samples were
carried out by using a FEI Tecnai G2 F20, with Schottky emitter, operated
at 200 kV. Statistics for the estimation of the lateral size and thickness were carried out considering 20 individual domains in the nanosheets for each sample.
Table 1. Summary of the ƞ10 values measured for our electrodes and other ReS2-based electrocatalysts reported in literature in acid and basic
condi-tions. For comparison we also show ƞ10 values measured for electrocatalysts based on MoS2, MoSe2, WS2, and phosphides.
Electrocatalyst ƞ10 [V] Electrolyte Mass loading [mg cm−2] Ref.
GC/ReS2 0.465 0.5 m H2SO4 ≈0.13 This work
0.735 1 m KOH
SWCNTs/ReS2 0.195 (0.162 after 24 h) 0.5 m H2SO4 ≈1.59 This work
0.327 (0.181 after 24 h) 1 m KOH
Chemically exfoliated ReS2 nanosheets ≈0.3a) 0.5 m H2SO4 Not reported [36]
Defects-activated monolayer ReS2 0.147 0.5 m H2SO4 Monolayer [54]
Vertically Oriented Arrays of ReS2 Nanosheets ≈0.3 0.5 m H2SO4 ≈0.67 [25]
Lithiated Vertically Oriented Arrays of ReS2 Nanosheets ≈0.2 0.5 m H2SO4 ≈0.67 (excluding Li) [25] ReS2 3D reticulated vitreous carbon foams 0.336a) 0.5 m H2SO4 Not reported (ReS2 grown
onto carbon foam)
[28]
One-pot synthetized ReS2 >0.35 0.5 m H2SO4 0.02 [119]
MoS2 > 0.35 0.5 m H2SO4 Monolayer [105]
MoS2 with S vacancies 0.25 0.5 m H2SO4
Strained MoS2 with S vacancies 0.17 0.5 m H2SO4
Co-doped MoS2 0.159 0.5 m H2SO4 0.5 [110]
Reduced graphene oxide:MoS2 hybrid on GC ≈0.15 0.5 m H2SO4 0.285 [111]
Reduced graphene oxide:MoS2 hybrid on carbon fibers ≈0.15 0.5 m H2SO4 1
MoS2 nanosheets > 0.3 0.5 m H2SO4 0.05 [67]
Metallic (1T) MoS2 nanosheets ≈0.20 0.5 m H2SO4 0.05
Liquid-phase exfoliated MoS2 0.372 0.5 m H2SO4 0.5 [96]
Graphene/MoS2 0.175 0.5 m H2SO4 0.5
Chemically exfoliated metallic (1T)-MoS2 0.235 0.5 m H2SO4 0.5
CVD-grown MoS2 monolayer on GC 0.342 0.5 m H2SO4 Not reported [106]
Solvothermal produced MoS2 on GC 0.252 0.5 m H2SO4 ≈0.5 [107]
Liquid-phase exfoliated MoSe2 0.37 0.5 m H2SO4 2 [61]
SWCNTs/MoSe2 0.17 0.5 m H2SO4 2 [61]
WS2 nanosheets >150 0.5 m H2SO4 0.35 [108]
NiCo2Px Nanowires 0.104 0.5 m H2SO4 5.9 [109]
Atomic force microscopy (AFM): AFM images were acquired by using
a Nanowizard III (JPK Instruments, Germany) mounted on an Axio Observer D1 (Carl Zeiss, Germany) inverted optical microscope. The samples were prepared by drop casting c-ReS2 flakes dispersion onto
a freshly cleaved mica substrate (G250-1, Agar Scientific Ltd., Essex, U.K.) and the AFM measurements were carried out by using PPP-NCHR cantilevers (Nanosensors, USA) with a nominal tip diameter of 10 nm. Intermittent contact mode AFM images of 5 × 5 µm2 and 1.5 × 1.5 µm2
were collected with 1024 data points per line and the working set point is kept above 70% of the free oscillation amplitude. The scan rate for the acquisition of images was 0.9 Hz. Height profiles were processed by using the JPK Data Processing software (JPK Instruments, Germany) and the data were analyzed with OriginPro 9.1 software.
XPS: X-ray photoelectron spectroscopy was carried out in a Kratos
Axis UltraDLD spectrometer using a monochromatic Al K a source (15 kV, 20 mA). High-resolution scans were performed at a constant pass energy of 10 eV and steps of 0.1 eV. The photo-electrons were detected at a take-off angle ϕ = 0° with respect to the surface normal. The pressure in the analysis chamber was kept below 7 × 10⁻⁹ Torr. The
binding energy scale was internally referenced to the Au 4f7/2 peak at
84 eV. The spectra were analyzed using the CasaXPS software (Version 2.3.16).
Raman Spectroscopy Characterization: Raman measurements were
performed in a Renishaw inVia micro-Raman microscope equipped with a 50× (0.75 N.A.) objective with excitation wavelengths of 532 and 785 nm and an incident power ≤1 mW to avoid heating and damage of the samples. The samples were prepared by drop casting the diluted materials dispersion onto a Si wafer covered with 300 nm thermally grown SiO2 (LDB Technologies Ltd.). For each sample, at least
50 spectra were collected.
Fabrication of the Gas Sensors: A ligand exchange procedure in
solution was carried out with the as-prepared OA/OlAm-capped ReS2
nanosheets dispersed in toluene. The different ligands (MPA, ATP and BDT) were dissolved in MeOH at a concentration of 1 × 10⁻³m. The
c-ReS2 dispersion in toluene (50 mg mL−1) and the ligand solution were
mixed in a volume ratio of 1:1 and stirred 2 min in a vortex, following by centrifugation (5000 rpm) and removal of the supernatant. Then, procedure was repeated once more, with a subsequent purification step with toluene: MeOH twice and centrifugation. Finally, the ligand exchanged ReS2 nanosheets were dispersed in isopropanol at a
concentration of 50 mg mL−1, and immediately used for the preparation
of the films on cleaned glass slides (≈1.5 × 1.5 cm2) by drop casting
(100 µL). Prior to the deposition, the glass substrates were cleaned in an ultrasonic bath (8 min each step), first with acetone, followed by isopropanol, dried with a N2 flow, and finally cleaned under N2 plasma
(100 W, 2 min). For the Au contacts deposition, a shadow mask with square holes of 1 × 1 mm2 area, separated by 100 µm, was used. The Au
film with a thickness of 80 nm was evaporated in a Kenosistec e-beam evaporator at a deposition rate of 0.3 Å s−1 and base pressure of about
1.0 10−6 mbar. The thickness of the different films was measured with a
Veeco Dektak 150 profilometer.
Electrical Characterization of the Gas Sensors: The electrical tests were
carried out in a chamber (see Figure 3a) equipped with two inlets, one for the N2 and the other for the target gases. Side ports allow the access
of micromanipulators connected to a Keithley 2612 source-meter. The chamber (≈643 cm3) had a transparent top lid, so that positioning of the
tips was possible by eye. A N2 line, at a pressure slightly above ambient
pressure (1.2 bar, flow of ≈667 cm3 s−1 determined with a flowmeter
(Yokogawa)), provided the inert atmosphere used as reference and allows to fill and purge the chamber in ≈1 s. A glass bubbler was connected and used for containing the water (MilliQ), ammonia (2% vol aq. solution), EtOH and acetone while bubbling with the N2 flow used
as carrier to create the saturated atmosphere. To ensure uniform evaporation of the volatile gases, the bubbler was kept in a warm water bath (60 °C). For CO2 and compressed dry air, reservoirs connected to
the experimental chamber were used. The experiments were performed according to the following procedure: current was measured as a function of time, first under N2 flux, then the test gas was injected in the
chamber for 10 s, then the flux was switched back to N2 until recovery
of the base current. The procedure was repeated multiple times for each device to ensure reproducibility.
Fabrication of the Electrocatalyst Electrodes: The solvent was removed
from the as-prepared (c-ReS2) sample by bubbling with nitrogen. The
obtained powder was annealed in a tubular furnace (PSC 12/-/600H, Lenton, UK, 25 mm inner tube diameter, Ar 100 sccm) at 500 °C for 8 h. Then, the powder was dispersed in NMP at a concentration of 1 mg mL−1
and sonicated for 7 h. The GC/c-ReS2 electrodes were prepared by drop
casting the c-ReS2 NMP dispersion (0.2 mg) on GC substrates (Sigma
Aldrich) with geometrical area of 1 × 1.5 cm2 (c-ReS
2 mass loading
≈0.13 mg cm−2). Electrodes of Pt/C were produced as benchmark for
HER by depositing the Pt/C dispersion onto GC substrates. The Pt/C dispersion was produced by dissolving 4 mg of Pt/C (5 wt% Pt loading, Sigma Aldrich) and 80 µL of Nafion solution (5 wt%, Sigma Aldrich) in 1 mL of 1:4 v/v ethanol/water. The Pt/C mass loading of the electrodes was 0.262 mg cm−2, in agreement with protocols developed
previously.[100,103] The SWCNTs/c-ReS
2 electrodes were fabricated by
sequential vacuum filtrations of 5 mg of SWCNTs (>90%, Cheap Tubes, sonic-tip de-bundled in NMP at a 0.4 mg mL−1 concentration[61,63]) and
5 mg of c-ReS2 on nylon filter membranes (0.2 µm pore size, 25 mm
diameter from Sigma Aldrich). The as-produced films (geometrical area = 3.5 cm2, and c-ReS
2 mass loading ≈1.59 mg cm−2) spontaneously
peeled off the nylon membrane during the drying, resulting in self-standing electrodes ready to be used. The SWCNTs/LPE-ReS2 electrodes
were produced using the same protocols described for SWCNTs/ c-ReS2, except for the use of the as-produced LPE-ReS2 dispersion in
isopropanol instead of c-ReS2 one. Additional electrodes were produced
by depositing the c-ReS2 and LPE-ReS2 nanosheet dispersions onto
GC by drop casting method (catalyst mass loading = 0.2 mg cm−2). All
the electrodes were dried overnight at room temperature before their electrochemical characterization.
Electrochemical Measurements of the Electrodes: Measurements were
carried out at room temperature in a flat-bottom quartz cell under a three-electrode configuration using an Ivium CompactStat potentiostat/ galvanostat station controlled via IviumSoft. A Pt wire or a GC rod were used as the counter electrode and a KCl-saturated Ag/AgCl was used as the reference electrode. As aqueous medium, 200 mL of two aqueous solutions were used: 0.5 m H2SO4 (99.999%, Sigma-Aldrich) and
1 m KOH (90%, Sigma Aldrich). MilliQ water was used to prepare the
solutions. Oxygen was purged from electrolyte solutions by flowing N2
throughout the aqueous medium using a porous frit for 30 min before starting the measurements. A constant N2 flow was kept afterward for
the whole duration of the experiments to avoid re-dissolution of O2 in the
electrolyte. The potential difference between the working electrode and the Ag/AgCl reference electrode was converted to the RHE scale using the Nernst equation: ERHE=EAg/AgCl+0.059pH+EAg/AgCl0 , where ERHE is the
converted potential versus RHE, EAg/AgCl is the potential experimentally
measured against the Ag/AgCl reference electrode, and E0
Ag/AgCl is the
standard potential of Ag/AgCl at 25 °C (0.1976 V). The LSV curves were acquired at the scan rate of 5 mV s−1. Polarization curves were iR-corrected, in which i is the measured working electrode current and the R is the series resistance that arises from the working electrode substrate and electrolyte resistances. R was extrapolated by the real part of the impedance (Re[Z]) measured by single frequency EIS at open-circuit potential and at the frequency of 100 kHz. Electrochemical impedance spectra of the SWCNTs/c-ReS2 and SWCNTs/LPE-ReS2 were acquired
at open circuit potential at frequencies between 0.1 Hz and 200 kHz. Stability tests were carried out by chronoamperometry measurements (j–t curves) by measuring the current in the potentiostatic mode at a fixed overpotential in order to provide the same starting cathodic current density of 20 mA cm−2 for HER. The C
dl of the c-ReS2 and LPE-ReS2
films deposited onto GC were estimated by CV measurements in a non-Faradaic region of potential (i.e., potential between 0.30 and 0.45 V vs Ag/AgCl) at various potential scan rates (from 20 to 800 mV s−1) in
0.5 m H2SO4.
SEM/EDX Characterization: SEM/EDX measurements were performed
www.advancedsciencenews.com www.small-journal.com
600 (FEI Company) microscope. SEM measurements were performed at 5 kV and 0.2 nA. For the cross-section images, the electrodes were carefully cut with a scalpel and measured in 90° tilted sample holder.
Supporting Information
Supporting Information is available from the Wiley Online Library or from the author.
Acknowledgements
This project received funding from the European Union’s Horizon 2020 research and innovation programme under grant agreement no. 785219 (GrapheneCore2), and the European Research Council (grant agreement no. 714876 PHOCONA). The authors thank Dr. A. Toma for the access to the IIT clean room facilities for the SEM measurements and evaporation procedures, Dr. F. de Angelis for the access to the Raman lab and the Materials Characterization and Electron Microscopy facilities for the access to the XPS equipment and TEM, respectively. M. Leoncini is acknowledged for the support in the fabrication of the gas chamber.
Conflict of Interest
The authors declare no conflict of interest.
Keywords
colloidal synthesis, electrocatalysts, gas sensors, hydrogen evolution reaction, transition metal dichalcogenides
Received: August 19, 2019 Revised: November 4, 2019 Published online: December 1, 2019
[1] R. Lv, J. A. Robinson, R. E. Schaak, D. Sun, Y. Sun, T. E. Mallouk, M. Terrones, Acc. Chem. Res. 2015, 48, 56.
[2] Z. Lin, A. McCreary, N. Briggs, S. Subramanian, K. Zhang, Y. Sun, X. Li, N. J. Borys, H. Yuan, S. K. Fullerton-Shirey, A. Chernikov, H. Zhao, S. McDonnell, A. M. Lindenberg, K. Xiao, B. J. LeRoy, M. Drndic´, J. C. M. Hwang, J. Park, M. Chhowalla, R. E. Schaak, A. Javey, M. C. Hersam, J. Robinson, M. Terrones, 2D Mater. 2016,
3, 042001.
[3] J. H. Han, M. Kwak, Y. Kim, J. Cheon, Chem. Rev. 2018, 118, 6151. [4] W. S. Yun, S. W. Han, S. C. Hong, I. G. Kim, J. D. Lee, Phys. Rev. B
2012, 85, 033305.
[5] P. Tonndorf, R. Schmidt, P. Böttger, X. Zhang, J. Börner, A. Liebig, M. Albrecht, C. Kloc, O. Gordan, D. R. T. Zahn, S. Michaelis de Vasconcellos, R. Bratschitsch, Opt. Express 2013, 21, 4908. [6] X. Chia, A. Y. S. Eng, A. Ambrosi, S. M. Tan, M. Pumera, Chem.
Rev. 2015, 115, 11941.
[7] X. Liu, T. Galfsky, Z. Sun, F. Xia, E. Lin, Y.-H. Lee, S. Kéna-Cohen, V. M. Menon, Nat. Photonics 2015, 9, 30.
[8] A. A. Tedstone, D. J. Lewis, P. O’Brien, Chem. Mater. 2016, 28, 1965. [9] M. Rahman, K. Davey, S.-Z. Qiao, Adv. Funct. Mater. 2017, 27,
1606129.
[10] M. Hafeez, L. Gan, A. Saleem Bhatti, T. Zhai, Mater. Chem. Front.
2017, 1, 1917.
[11] D. A. Chenet, O. B. Aslan, P. Y. Huang, C. Fan, A. M. van der Zande, T. F. Heinz, J. C. Hone, Nano Lett. 2015, 15, 5667.
[12] H. H. Murray, S. P. Kelty, R. R. Chianelli, C. S. Day, Inorg. Chem.
1994, 33, 4418.
[13] S. P. Kelty, A. F. Ruppert, R. R. Chianelli, J. Ren, M.-H. Whangbo,
J. Am. Chem. Soc. 1994, 116, 7857.
[14] K. Momma, F. Izumi, J. Appl. Crystallogr. 2011, 44, 1272.
[15] S. Tongay, H. Sahin, C. Ko, A. Luce, W. Fan, K. Liu, J. Zhou, Y.-S. Huang, C.-H. Ho, J. Yan, D. F. Ogletree, S. Aloni, J. Ji, S. Li, J. Li, F. M. Peeters, J. Wu, Nat. Commun. 2014, 5, 3252.
[16] H. Jang, C. R. Ryder, J. D. Wood, M. C. Hersam, D. G. Cahill, Adv.
Mater. 2017, 29, 1700650.
[17] O. B. Aslan, D. A. Chenet, A. M. van der Zande, J. C. Hone, T. F. Heinz, ACS Photonics 2016, 3, 96.
[18] S.-H. Jo, H.-Y. Park, D.-H. Kang, J. Shim, J. Jeon, S. Choi, M. Kim, Y. Park, J. Lee, Y. J. Song, S. Lee, J.-H. Park, Adv. Mater. 2016, 28, 6711.
[19] M. Hafeez, L. Gan, H. Li, Y. Ma, T. Zhai, Adv. Funct. Mater. 2016,
26, 4551.
[20] B. Jariwala, D. Voiry, A. Jindal, B. A. Chalke, R. Bapat, A. Thamizhavel, M. Chhowalla, M. Deshmukh, A. Bhattacharya,
Chem. Mater. 2016, 28, 3352.
[21] G. Nazir, M. A. Rehman, M. F. Khan, G. Dastgeer, S. Aftab, A. M. Afzal, Y. Seo, J. Eom, ACS Appl. Mater. Interfaces 2018, 10, 32501.
[22] S. Yang, J. Kang, Q. Yue, J. M. D. Coey, C. Jiang, Adv. Mater.
Interfaces 2016, 3, 1500707.
[23] A. Yang, J. Gao, B. Li, J. Tan, Y. Xiang, T. Gupta, L. Li, S. Suresh, J. C. Idrobo, T.-M. Lu, M. Rong, N. Koratkar, 2D Mater. 2016, 3, 045012.
[24] Q. Zhang, S. Tan, R. G. Mendes, Z. Sun, Y. Chen, X. Kong, Y. Xue, M. H. Rümmeli, X. Wu, S. Chen, L. Fu, Adv. Mater. 2016, 28, 2616. [25] J. Gao, L. Li, J. Tan, H. Sun, B. Li, J. C. Idrobo, C. V. Singh, T.-M. Lu,
N. Koratkar, Nano Lett. 2016, 16, 3780.
[26] Q. Li, Y. Xu, Z. Yao, J. Kang, X. Liu, C. Wolverton, M. C. Hersam, J. Wu, V. P. Dravid, ACS Nano 2018, 12, 7875.
[27] A.-J. Cho, S. D. Namgung, H. Kim, J.-Y. Kwon, APL Mater. 2017, 5, 076101.
[28] L. Wang, Z. Sofer, J. Luxa, D. Sedmidubský, A. Ambrosi, M. Pumera, Electrochem. Commun. 2016, 63, 39.
[29] Q. Zhang, W. Wang, J. Zhang, X. Zhu, Q. Zhang, Y. Zhang, Z. Ren, S. Song, J. Wang, Z. Ying, R. Wang, X. Qiu, T. Peng, L. Fu, Adv.
Mater. 2018, 30, 1707123.
[30] Live PGM Prices, https://www.metalsdaily.com/live-prices/pgms, (accessed: March 2019).
[31] Engelhard Industrial Bullion (EIB) Prices, https://apps.catalysts. basf.com/apps/eibprices/mp/, (accessed: March 2019).
[32] K. Keyshar, Y. Gong, G. Ye, G. Brunetto, W. Zhou, D. P. Cole, K. Hackenberg, Y. He, L. Machado, M. Kabbani, A. H. C. Hart, B. Li, D. S. Galvao, A. George, R. Vajtai, C. S. Tiwary, P. M. Ajayan,
Adv. Mater. 2015, 27, 4640.
[33] N. Al-Dulaimi, D. J. Lewis, X. L. Zhong, M. Azad Malik, P. O’Brien,
J. Mater. Chem. C 2016, 4, 2312.
[34] Y. Kim, B. Kang, Y. Choi, J. H. Cho, C. Lee, 2D Mater. 2017, 4, 025057.
[35] F. Cui, C. Wang, X. Li, G. Wang, K. Liu, Z. Yang, Q. Feng, X. Liang, Z. Zhang, S. Liu, Z. Lei, Z. Liu, H. Xu, J. Zhang, Adv. Mater. 2016,
28, 5019.
[36] T. Fujita, Y. Ito, Y. Tan, H. Yamaguchi, D. Hojo, A. Hirata, D. Voiry, M. Chhowalla, M. Chen, Nanoscale 2014, 6, 12458.
[37] N. Al-Dulaimi, E. A. Lewis, D. J. Lewis, S. K. Howell, S. J. Haigh, P. O’Brien, Chem. Commun. 2016, 52, 7878.
[38] J. Kang, V. K. Sangwan, J. D. Wood, X. Liu, I. Balla, D. Lam, M. C. Hersam, Nano Lett. 2016, 16, 7216.
[39] H. Weller, J. Niehaus, GB2457314A, 2009. [40] H. Weller, J. Niehaus, WO2009101091A1, 2009. [41] H. Weller, J. Niehaus, US9084979B2, 2015.