Simulations on the fine grid
4.1
Description of the test case
4.1.1
2D Mesh
The flow to be simulated here is the same are described in Chapter 3, i.e. the
flow past a circular cylinder at Mach number M∞ = 0.1 and at a subcritical
Reynolds number ReD of 3900 (ReD =
u∞D
ν ) based on cylinder diameter D
and free-steam velocity u∞. The fine grid was definitely more complicated
to build than the coarse one. In particular, a grid with at least one million nodes was required. An higher refinement with respect to the coarse grid was required near the body surface, in the recirculation zone behind the cylinder and in the wake down. The first two grid zones are also the most important ones for a correct numerical simulation and for this an ad-hoc refinement was performed. Obviously the shape of the wake was not previously known, so we referred to experiments in Ref.[22]. The averaged distance request of the
nearest point to the cylinder boundary is 0.005D which corresponds to y+ ≈
1, where y+ is the distance from cylinder surface in wall units. The domain
dimensions have been slightely changed in comparison with the coarse grid, reducing the y dimension, while the x dimension and the spanwise z have remained the same. This modification has been done to try to optimize the
−10 ≤ x/D ≤ 25, −15 ≤ y/D ≤ 15 and −π/2 ≤ z/D ≤ π/2
where x, y and z denote the streamwise, transverse and spanwise direction respectively. The characteristics of the domain are the following:
Li/D = 10, L0/D = 25, Hy/D = 15 and Hz/D = π
The cylinder of unit diameter is centered on (x,y) = (0,0).
with the definition of the domain 2D. As we had to build an extremely ac-curated grid around the cylinder, 30 circumferences have been constructed around the cylinder of which ten 0.005D far from the other ones and the others with a constant expansion in the diameter of one percent, following
in this way the D0 = D−1+ D−1/100 law. The circumferences around the
cylinder were divided on 160 parts. The circumferences around the cylinder have been represented in the Figure 4.2.
Figure 4.2. 30 circumferences of construction
A complete view of the lines of the grid construction is represented in Figure 4.3.
Figure 4.3. Lines of grid construction
As for the coarse grid the fine mesh was performed with the Tetrahedral elements in the volume. We have initially built a 2D mesh show in Figure 4.4 we can note the high refined zone behind the cylinder and relating to the separation of the boundary layer. In Figure 4.5 we have reported the zoom near the cylinder. In Figure 4.6 we have reported the complete 2D mesh which has got 22795 nodes. In Figure 4.7 we can see the progressive expansion of the 30 circumferences of construction.
4.1.2
3D Mesh
After building the 2D mesh we proceeded to construct the 3D mesh. The domain has been extruded of (π D) /4 and reflected twice. This operation was necessary not to have problems in the machine memory. Using the same procedure we have carried out the lines of construction of the grid in order to give them their relative bonds. Not to have problems of high tetrahedral stretch of the mesh mostly in the zone near the cylinder 32 subdivisions in the
z spanwise direction has been done. We chose this way giving the maximum
admissible value of the ratio between the maximum height of the tetrahedra faces and the minimum one could be equal to five:
hM ax T etrahedral/hM in T etrahedral = 5
In our case the minimum height is equal to the distance of the circum-ferences of construction, that is 0.005D. Knowing that the length in the z spanwise dimension is π/4, we find that:
π/4 D
0.005D ≈ 32
The subdivisions in the spanwise z will be 128.
In Figure 4.8 we reported the 3D domain and in Figure 4.9 the relative zoom.
Then we built the volume mesh. In Figure 4.10 we reported the volume grid near the cylinder.
4.1.3
Boundary conditions; CFL number; Numerical
viscosity
γ
Boundary conditions are the same as for the coarse grid. At the inflow the the flow is assumed to be undisturbed and the Steger-Warming [14] conditions are applied. Boundary conditions based on the Steger-Warming decomposition
are used at the outflow as well. On the lateral surfaces (y = ±Hy, z = ±Hz)
slip conditions are imposed. Finally, the flow is assumed to be periodic in the spanwise direction in order to simulate a cylinder of infinite spanwise length. The numerical parameter γ, which controls the amount of numerical vis-cosity introduced in the simulation, has been set equal to 0.3, in order to obtain stable simulations.
The simulations have been implicitly advanced in time, with a maximum CFL number equal to 80.
4.2
Results of the simulations
Following the results of the study on the coarse grid, the simulations on the fine grid have been performed using preconditioning. As usual, for the evaluation of the results we have omitted the initial transient period. We have considered about thirty cycles of vortex shedding to obtain steady statistics. In Figure 4.11(a) the coefficients Cl and Cd are shown as a function of the time.
Time-averaged bulk coefficients for the fine grid are summarized in Table 4.1 in which the results obtained with the coarse grid are also reported for
comparison. Cd denotes the mean drag coefficient, C
′
d and C
′
l the root mean
square values of the drag and lift respectively, St the Strouhal number, lrthe
length of the mean recirculation bubble (measured on the line y = z = 0)
θsep the separation angle and Umin the minimum mean streamwise velocity
measured on the line y = z = 0.
220 240 260 280 300 320 340 360 380 −0.2 −0.15 −0.1 −0.05 0 0.05 0.1 0.15 Lift coefficient Time Cl (a) 220 240 260 280 300 320 340 360 380 0.8 0.85 0.9 0.95 1 1.05 1.1 Drag coefficient Time Cd (b)
Figure 4.11. Lift (a) and drag (b) coefficients versus time obtained with the WALE model
Data from St Cd Cd′ Cl′ lr θsep Umin WALE 0.218 0.95 0.0213 0.0435 1.95 83 -0.25 fine grid Vreman 0.215 0.94 0.0180 0.0374 2.03 82 -0.27 fine grid Vreman 0.215 0.94 0.0139 0.0415 2.05 82 -0.37 Barth cells fine grid Smago. 0.219 1.18 0.0842 0.497 0.89 95 -0.28 coarse grid Vreman 0.212 1.17 0.0750 0.483 0.94 93 -0.31 coarse grid WALE 0.215 1.23 0.0639 0.592 0.92 93 -0.26 coarse grid Smago. prec. 0.221 0.99 0.0359 0.259 1.11 87 -0.29 coarse grid WALE prec. 0.220 0.96 0.0274 0.196 1.17 87 -0.27 coarse grid Experiments [18], [17], [16] 0.215±0.05 0.99±0.05 1.33±0.02 85±2 -0.24±0.1 [19], [26] 0.21±0.05 1.18±0.05
Table 4.1. Bulk coefficients: results obtained with the fine grid, the coarse grid and from experiments
grid (fine grid FG) are in a worse agreement with the experiments than to the results obtained with the coarse grid (coarse grid CG). For instance let us consider the simulations with the WALE and Vreman models. The
parameter which results in greatest disagreement with the experiments is lr,
the mean recirculation length which is largely overestimated. Conversely, the preconditioned WALE model for the coarse grid (precondition, coarse grid
PCG) predicts lr with reasonable accuracy.
The parameters Cd′ and Cl′ are smaller than those obtained on the coarse
grid: the C′
d obtained with the WALE model on the fine grid is about 29%
smaller than the one provided by the WALE PCG simulation. The C′
d ob-tained with the Vreman model results 52% smaller than the one provided
by the WALE PCG simulation. Referring to the C′
l and still taking as
ref-erence the preconditioned WALE model on the coarse grid, C′
l provided by
parameters C′
d and C
′
l become as the alternate vortices develop more
down-stream and have then less effect on the aerodynamic forces acting on the the circular cylinder.
The separation angle θsep for all the simulations is in a good agreement
with the experimental data. Instead, concerning Umin, the WALE FG model
and the Vreman FG model are in slightly better agreement with the experi-mental values than those obtained with the WALE PCG model. The value
of Cd does not change significately from the coarse grid to the fine grid.
The Strouhal number for all the simulations is in a good agreement with the experimental data. Therefore we notice that, the parameter truly far from the experimental data is the recirculation length. In orther to investigate the reasons that led to the previously described results, we have then performed another simulation on the fine grid for the Vreman model and using the Barth cells. Indeed, inside the grid there could be some cells with a high aspect ratio affecting the overall accuracy of the simulations.We thus compare the results given by the Vreman FG model with those of the Vreman FG model with the Barth cells. All the values remain essentially the same, except the
Umin. Thus, this test shows that using the Barth cells does not improve the
simulation for the fine grid. Further, we have performed simulations reducing the CFL, always using the Vreman model on the fine grid. However, no significant improvement was found.
Subsequently we have reported the typical graphs that summarize all the various tests on the fine grid. As usual the various data of the numerical smulations have been compared to the experimental data. The graphs in Figure 4.12, 4.13, 4.14 have been carried out averaging the data in the 32
centerline using different subgrid scale models in the fine grid. The difference between the experimental data and the various curves is considerable. As reported in the Table 4.1 the recirculation length is much larger for all the various models on the fine grid than to the experimental one. The WALE model is slightly better than the other ones. Using the Barth cells does not
improve the simulation, on the contrary it deteriorates the of Umin. Far from
the cylinder the various curves show the same trend.
In figure 4.13 the curves of Cp are shown. The curves related to the fine grid are in a better agreement respect the experimental data than those ones related to the coarse grid. In particular,the trend of the 60 and 90 degrees is in a better agreement for the simulations on the fine grid than for those ones on the coarse grid and in fact the values of cdm are better (they are closer to the experimental data) than those ones on the coarse grid.
Figure 4.14 shows the components u′u′ and v′v′ of the SGS tensor. For Figure 4.14(a) it is possible to notice the similar v-shape between the curves simulated and the curve in the experimental data. In Figure 4.14(b) the simulated curves have a completely different trend. To understand these incongruities we have to analyse the field of SGS viscosity.
0.5 1 1.5 2 2.5 3 3.5 4 4.5 5 5.5 6 6.5 7 7.5 8 8.5 9 9.5 10 −0.4 −0.2 0 0.2 0.4 0.6 0.8 1 x Um WALE
Vreman, Barth cells Vreman Experiment (a) 0.5 1 1.5 2 2.5 3 −0.4 −0.2 0 0.2 0.4 0.6 0.8 1 x Um WALE
Vreman, Barth cells Vreman
Experiment
(b)
Figure 4.12. Mean streamwise velocity along the centerline using different subgrid scale model
0 10 20 30 40 50 60 70 80 90 100 110 120 130 140 150 160 170 180 −1.2 −1 −0.8 −0.6 −0.4 −0.2 0 0.2 0.4 0.6 0.8 1 1.2 θ degrees Cp m WALE Vreman, Barth cells Vreman Experiment (a) 50 60 70 80 90 −1.2 −1 −0.8 −0.6 θ degrees Cp m WALE Vreman, Barth cells Vreman Experiment (b) 80 85 90 95 100 105 110 115 120 −2 −1.8 −1.6 −1.4 −1.2 −1 −0.8 −0.6 −0.4 −0.2 0 θ degrees Cp m WALE Vreman, Barth cells Vreman Experiment
(c)
(a)
(b)
4.3
Analysis of the flow fields
The average fields relating to Cp are examined, first. In Figure 4.15 and in Figure 4.16 we have reported the Cp obtained with the WALE FG, Vreman FG, Vreman FG Barth cells, compared with the Smagoringky PCG model taken as a reference. We immediately can see that the region of negative Cp behind the cylinder is much wider in the streamwise direction for the Smagorinsky model, that is the recirculation length is much more evident in comparison with the coarse grid. In the Smagorinsky PCG model the Cp are much larger in absolute value (that is they are more negative), since an eddy originates just behind the cylinder and so we have strongly negative Cp. There are no considerable differences among the various models as shown comparing Figure 4.15(b), Figure 4.16(a) and Figure 4.16(b). Using Barth cells, as we see from Figure 4.16, does not improve the results.
In Figure 4.17 we have reported the vorticity field ωz relating to the
WALE FG model in the plane z = 0. In Figure 4.17(b) we have also shown the grid. You can notice how the vorticity structures which are detaching from the cylinder are visible. These structures remain delimited inside the refined grid region behind the cylinder. In Figures 4.17(a) we can see the vorticity that separates from the cylinder and that forms eddies more downstream. In Figure 4.19 we can see a zoom view of the field in Figure 4.17(a). The Figure 4.18 shows that the recirculation zones and the separation of the boundary layer is inside the most refined zone behind the cylinder as it was requested in advance. Figures 4.19 show the main differences between the recirculation length for coarse grid and fine grid. We can notice that, as for Figure 4.19(a) the boundary layer separates from the cylinder and forms an eddy immediately after it. For the figure 4.19(b), on the contrary, the boundary layer separates from the cylinder but forms the eddies definetly more downstream.
In Figure 4.20 and in Figure 4.21 we have reported the field of the U variable on the z = 0 plane for Smagorinsky, Vreman and WALE models.
(a)
(b)
Figure 4.15. Cp time average isocontours. Smagorinsky
PCG [min max]value = [−1.78 1.28]; WALE FG model
(a)
(b)
Figure 4.16. Cp time average isocontours. Vreman FG (a) with the me-dian cells [min max]value= [−1.10 1.05]; Vreman FG with Barth cells (b) [min max]value= [−1.17 1.06]
for the model Vreman FG with the Barth cells and for Vreman FG with the median cells the maximum values are the same, while the minimum values (in absolute value) are higher for the model with the Barth cells. Figure 4.22 and Figure 4.23 shown a zoom of Figure 4.20 and Figure 4.21. From these figures the significant differences between the coarse grid (Figure 4.22(a)) and the fine grid (Figures 4.22(b) can again be seen.
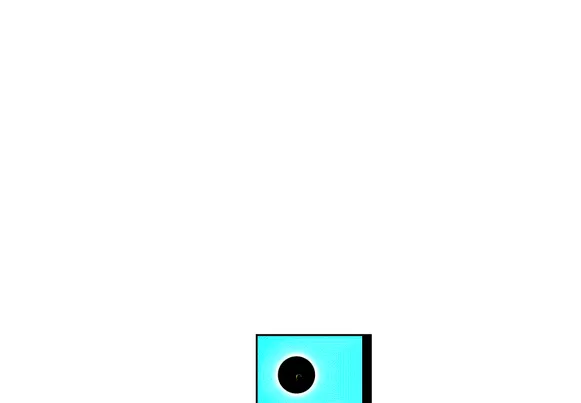
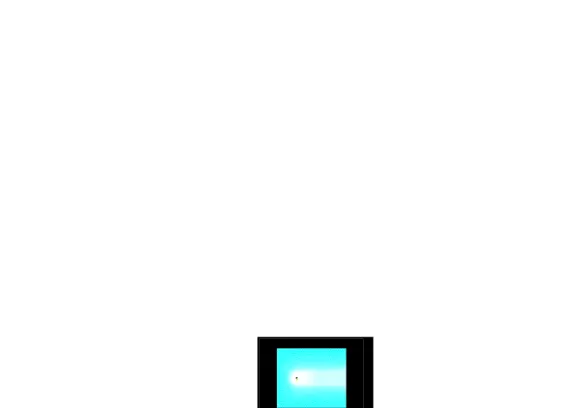
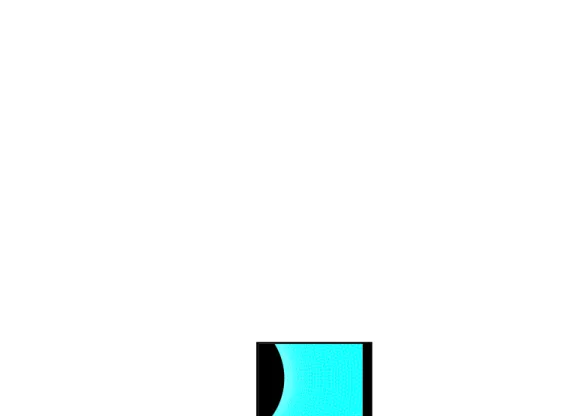
In Figure 4.24 a section (plane x − z, y = 0) of the instantaneous velocity field U is reported for the models Vreman FG with the median cells and Vreman FG with the Barth cells. In the figures only the negative velocity field is shown so that the recirculation zone could be put qualitatively in evidence. We can see that the recirculation length is approximately the same.
In Figure 4.25 and in Figure 4.26 we have reported the turbulent kinetic energy field and in Figure 4.27 and Figure 4.28 the corresponding zooms for the models Smagorinsky PCG, WALE FG, Vreman with median cells and Vreman with the Barth cells. The wake in the coarse grid appears shorter and more energetic than the other ones on the fine grid.
(a)
(b)
Figure 4.17. 2D WALE FG model vorticity ωz in the plane z = 0 without (a) and with (b) grid plotted together. Range [−1 1]
(a)
(b)
Figure 4.18. 2D WALE FG model zoom vorticity ωz in the plane z = 0 without (a) and with (b) grid plotted together. Range [−1 1]
(a)
(b)
Figure 4.19. 2D precondition WALE model vorticity zoom coarse grid (a) and fine grid (b). Plane z = 0. Range [−1 1]
(a)
(b)
(a)
(b)
Figure 4.21. U time average isocontours. Vreman model with the median cells (a) [min max]value= [−0.27 1.37]; Vreman model with Barth cells (b) [min max]value= [−0.37 1.37]
(a)
(b)
Figure 4.22. U time average isocontours, Smagorinsky PCG (a) and WALE FG (b), zoom
(a)
(b)
Figure 4.23. U time average isocontours, Vreman FG and Barth cells without (a) and Vreman FG and Barth cells with (b), zoom
(a)
(b)
Figure 4.24. Instantaneous isocontour velocity U, x-y plane on the fine grid; Vreman model (a) with Barth cells and WALE model (b) with the median cells
(a)
(b)
Figure 4.25. Turbulent kinetic energy in the wake compared.
Smagorin-sky PCG (a) [min max]value = [0 0.713]; WALE FG (b)
(a)
(b)
Figure 4.26. Turbulent kinetic energy in the wake compared. Vreman FG with the median cells (a) [min max]value = [0 0.538]; Vreman FG model with Barth cells [min max]value= [0 0.518]
(a)
(b)
Figure 4.27. Turbulent kinetic energy in the wake compared, zoom.
(a)
(b)
Figure 4.28. Turbulent kinetic energy in the wake compared, zoom. Vre-man FG with the median cells (a) and VreVre-man FG with Barth cells (b)