AR
TICLE
© 2017 International Mycological Association
You are free to share - to copy, distribute and transmit the work, under the following conditions:
Attribution: You must attribute the work in the manner specified by the author or licensor (but not in any way that suggests that they endorse you or your use of the work). Non-commercial: You may not use this work for commercial purposes.
No derivative works: You may not alter, transform, or build upon this work.
For any reuse or distribution, you must make clear to others the license terms of this work, which can be found at http://creativecommons.org/licenses/by-nc-nd/3.0/legalcode. Any of the above conditions can be waived if you get permission from the copyright holder. Nothing in this license impairs or restricts the author’s moral rights.
INTRODUCTION
The family Fagaceae comprises about 1000 species belonging to eight to ten genera widely distributed across the Northern Hemisphere (Manos & Stanford 2001). In Europe, species from the genera Castanea, Fagus, and Quercus dominate a wide variety of habitats ranging from Mediterranean sclerophyllous evergreen communities to temperate, deciduous lowland and mountainous forests (http://www.euforgen.org). Besides species with wide geographical distributions and ecological amplitudes, such as sweet chestnut (Castanea sativa) and European beech (Fagus sylvatica), some evergreen oaks (e.g. Quercus ilex and Q. suber) are geographically restricted and adapted to particular environmental conditions such as prolonged summer drought and fire (Schirone et al. 2016). Although species in these genera constitute primarily forest resources important for their wide range of uses (biomass, fibre, wood products, cork and food), they are also keystone species in
forest ecosystems and considered main drivers of terrestrial biodiversity (Kremer et al. 2012). In some countries, they are major patrimonial and cultural resources (Logan 2005).
Since the early 1990s, numerous surveys in declining and healthy European Fagaceae forests have revealed a wealth of resident Phytophthora species (Jung 2009, Perez-Sierra et al. 2013, Scanu et al. 2013). Several Phytophthora species, including P. cactorum, P. xcambivora (previously known as P. cambivora), P. cinnamomi, P. plurivora, and P. quercina were strongly associated with the decline and dieback of forests, while other species, such as P. cryptogea, P. europaea, P. gallica, P. gonapodyides, P. megasperma, P. pseudosyringae, P. psychrophila, P. syringae, P. uliginosa, P. sp. forestsoil, and P. sp. riversoil, were more cryptic, and their role in forest ecosystems is still not fully understood.
Between 2010 and 2016, surveys of Phytophthora diversity were independently performed in forests in Austria, Italy, and Portugal during which four new cryptic Phytophthora species were recovered from the rhizosphere of Fagacea species. All
Multiple new cryptic pathogenic Phytophthora species from Fagaceae
forests in Austria, Italy and Portugal
Thomas Jung1,2,3, Marília Horta Jung1,2,3, Santa Olga Cacciola4, Thomas Cech5, József Bakonyi6, Diána Seress6, Saveria Mosca7, Leonardo Schena7, Salvatore Seddaiu8, Antonella Pane4, Gaetano Magnano di San Lio7, Cristiana Maia2, Alfredo Cravador2, Antonio Franceschini9, and Bruno Scanu9
1Phytophthora Research Centre, Mendel University, 613 00 Brno, Czech Republic
2Laboratory of Molecular Biotechnology and Phytopathology, Centre for Mediterranean Bioresources and Food, University of Algarve, 8005–130 Faro, Portugal
3Phytophthora Research and Consultancy, 83131 Nußdorf, Germany
4Department of Agriculture, Food and Environment, University of Catania, 95123 Catania, Italy
5Federal Research and Training Centre for Forests, Natural Hazards and Landscape (BFW), Seckendorff-Gudent-Weg 8, A-1131 Vienna, Austria 6Plant Protection Institute, Centre for Agricultural Research, Hungarian Academy of Sciences, Budapest, Hungary
7Dipartimento di Agraria, University Mediterranea of Reggio Calabria, 89122 Reggio Calabria, Italy
8Dipartimento della ricerca per il sughero e la silvicoltura, Agris Sardegna, Via Limbara 9, 07029 Tempio Pausania, Italy
9Dipartimento di Agraria, Sezione di Patologia vegetale ed Entomologia, Università degli Studi di Sassari, Viale Italia 39, 07100 Sassari, Italy; corresponding author e-mail: [email protected]
Abstract:During surveys of Phytophthora diversity in natural and semi-natural Fagaceae forests in Austria, Italy and Portugal, four new cryptic species were isolated from rhizosphere soil samples. Multigene phylogeny based on nuclear ITS, ß-tubulin and HSP90 and mitochondrial cox1 and NADH1 gene sequences demonstrated that two species, P. tyrrhenica and P. vulcanica spp. nov., belong to phylogenetic Clade 7a, while the other two species,
P. castanetorum and P. tubulina spp. nov., clustered together with P. quercina forming a new clade, named here
as Clade 12. All four new species are homothallic and have low optimum and maximum temperatures for growth and very slow growth rates at their respective optimum temperature. They differed from each other and from related species by a unique combination of morphological characters, cardinal temperatures, and growth rates. Pathogenicity of all Phytophthora species to the root system of their respective host species was demonstrated in soil infestation trials.
Article info: Submitted: 11 May 2017; Accepted: 20 September 2017; Published: 28 September 2017.
Key words: Clade 7 cryptic species evolution homothallic phylogeny Phytophthora quercina species radiation
AR
TICLE
four species showed scattered distribution, very slow growth in culture, and were difficult to isolate using traditional soil baiting methods. Preliminary analysis of sequence data from the ITS region of the nrDNA and part of the mitochondrial cox1 gene showed that two taxa were closely related to P. uliginosa from subclade a of phylogenetic Clade 7 (in the following Clade 7a) whereas the other two taxa clustered with P. quercina and the informally designated taxon Phytophthora sp. ohioensis.
In this study, morphological and physiological character-istics are used in combination with DNA sequence data from the ITS, part of the nuclear heat shock protein 90 (HSP90) and β-tubulin (Btub), and the mitochondrial cox1 and NADH1 genes to characterize the four putative new Phytophthora taxa isolated from Fagaceae forests in Austria, Italy, and Portugal, and compare them to their closest relatives. The results of this study are presented and the new taxa described as P. castanetorum, P. tyrrhenica, P. tubulina, and P. vulcanica spp. nov. Pathogenicity of all new Phytophthora species against their respective hosts was also tested in soil infestation trials to confirm Koch’s postulates.
MATERIAL AND METHODS
Phytophthora isolation and culture
maintenance
Isolates were obtained from rhizosphere soil of mature trees (Supplementary Table 1) using the sampling and isolation methods described by Jung et al. (1996), Jung (2009), and Scanu et al. (2015). Additional isolates used in the phylogenetic, morphological, and physiological studies and in the pathogenicity tests were sourced from the culture collections of the authors (Supplementary Table 1). In addition, isolates of P. quercina were obtained between 2010 and 2014 from various Quercus species in Portugal and Poland for comparative studies (Supplementary Table 1). For all isolates, single hyphal tip cultures were produced under the stereomicroscope from the margins of fresh cultures on V8-juice agar (V8A; 16 g agar, 3 g CaCO3, 100 mL Campbell’s V8 juice, 900 mL distilled water). Stock cultures were maintained on carrot agar (CA; 16 g agar, 3 g CaCO3, 200 g carrot, 1000 mL distilled water; Scanu et al. 2014a) at 10 °C in the dark. All isolates of the four new species are preserved in the culture collections maintained at Mendel University (BD numbers, referring to the BioDiversA project RESIPATH), the University of Sassari (P and PH numbers, both referring to Phytophthora) and the University of Catania (Roman numbers). Dried culture holotypes were lodged with the CBS Herbarium, and ex-type and isotype cultures were deposited at the Westerdijk Fungal Biodiversity Institute (CBS; Utrecht, The Netherlands) (Supplementary Table 1).
DNA isolation, amplification and sequencing
Extraction of mycelial DNA was performed according to Jung et al. (2017b) using the DNeasy Plant Mini kit (QIAGEN, Hilden) or the E.Z.N.A.® Fungal DNA Mini Kit (OMEGA Bio-tek, Norcross, GA) following the manufacturer’s instructions and checked for quality and quantity by spectrophotometry. DNA was stored at –20 °C until required. For 29 isolates of thefour new Phytophthora species and five isolates of P. quercina, three nuclear and two mitochondrial loci were amplified and sequenced (Supplementary Table 1). The ITS1-5.8S-ITS2 region of the nrDNA was amplified using the primer-pair ITS1/ ITS4 (White et al. 1990) and the PCR reaction mixture and cycling conditions described by Nagy et al. (2003) with an annealing temperature of 57 °C for 30 s. Partial heat shock protein 90 (HSP90) gene was amplified with the primer-pair HSP90F1int/HSP90R1 as described previously (Blair et al. 2008). Segments of the β-tubulin (Btub) and the mitochondrial genes cytochrome c oxidase subunit 1 (cox1) and NADH dehydrogenase subunit 1 (NADH1) were amplified using primer-pairs TUBUF2/TUBUR1, COXF4N/COXR4N and NADHF1/NADHR1, respectively, and the PCR reaction mixture and cycling conditions as described by Kroon et al. (2004). Products of Thermo Fisher Scientific (Waltham, MA) and Bio-Rad C1000™ or Applied Biosystems® 2720 Thermal Cyclers were used for the PCR reactions. Amplicons were purified and sequenced in both directions using the primers of the PCR reactions by Macrogen Inc. (Amsterdam) and BMR Genomics DNA sequencing service (www.bmrgenomics.it).
Electrophoregrams were quality checked and forward and reverse reads were compiled using Pregap4 version 1.5 and Gap v.4.10 of the Staden software package (Staden et al. 2000). Heterozygous sites were labelled according to the IUPAC coding system. All sequences derived in this study were deposited in GenBank and accession numbers are given in Supplementary Table 1.
Phylogenetic analysis
DNA sequences generated were combined with sequences of Phytophthora species obtained from GenBank. Sequences of each locus were aligned using the online MAFFT version 7 (http://mafft.cbrc.jp/alignment/server/) (Katoh & Standley 2013) by the E–INS–I strategy (ITS) or the G-INS-i option (all other loci). The phylogenetic analyses of P. tyrrhenica and P. vulcanica from Clade 7a, and of P. castanetorum and P. tubulina from the P. quercina clade were performed separately.
For the phylogenetic analyses of P. tyrrhenica and P. vulcanica all 16 previously known taxa from Clade 7a were included and P. cinnamomi (CBS 144.22) and P. niederhauserii (CBS 124086), both from Clade 7b, were used as outgroups (Abad et al. 2014, Jung et al. 2017b). The datasets of the five loci were first analysed separately and then combined. The 5-loci dataset comprised 4257 characters (ITS=842, Btub=911, HSP90=840, cox1=867, NADH1=797) and included 43 Phytophthora isolates.
To resolve the phylogenetic positions of P. castanetorum and P. tubulina within the P. quercina clade, and of the latter within the genus Phytophthora, 24 isolates from seven putative taxa of the P. quercina clade, including P. castanetorum, P. tubulina, P. quercina, P. versiformis (Paap et al. 2017), and the undescribed taxa P. sp. ohioensis, P. sp. quercina-like (only ITS sequence available), and P. sp. versiformis-like, and representative species from all phylogenetic Phytophthora clades were included in the analyses. The designated ex-type isolate (CBS 142348) of Nothophytophthora amphigynosa, the type species of a new sister genus of Phytophthora (Jung et al. 2017c) was
AR
TICLE
used as outgroup taxon in all analyses. The datasets of the five loci were first analysed separately and then combined. The cox1 sequences of P. sp. ohioensis, P. versiformis and P. sp. versiformis-like from GenBank were generated using primer pair FM77/FM84 (Martin & Tooley 2003) and, hence, had insufficient overlap with those of P. castanetorum, P. quercina and P. tubulina generated in this study with primer pair COXF4N/COXR4N. Therefore, cox1 was excluded from the two multigene analyses of the P. quercina clade. The combined four locus dataset comprised 3539 characters (ITS=992, Btub=915, HSP90=843, NADH1=789). For 11 of the 24 Phytophthora species from other clades no isolates with sequences for all four loci were available at GenBank or at Phytophthora database, hence sequences from two different isolates per species were combined (Supplementary Table 1). Since for P. lilii no NADH1 sequence was available a separate analysis of a combined nuclear ITS-Btub-HSP90 dataset was performed in order to clarify whether P. lilii constitutes a distinct phylogenetic clade as suggested by Rahman et al. (2015) and whether the inclusion of P. lilii has any effect on the grouping of the P. quercina clade. This three locus dataset comprised 2768 characters (ITS=1010, Btub=915, HSP90=843) and included 49 Phytophthora taxa.
For all individual gene and all multigene alignments, both Maximum Lkelihood (ML) phylogenetic and Bayesian Inference (BI) analyses were performed. ML analyses of the datasets were carried out with RAxML (Stamatakis 2014) in the raxmlGUI version 1.5b1 (Silvestro & Michalak 2012) implemented with the GTRGAMMA model. There were 10 runs of the ML and bootstrap (“thorough boostrap”) analyses with 1000 replicates used to test the support of the branches. Phylogenetic BI analyses were performed with MrBayes 3.1.2 (Huelsenbeck & Ronquist 2001, Ronquist & Huelsenbeck 2003) using the GTR+G model. For multigene BI analyses the individual gene alignments were divided into five (Clade 7a) and four or three (P. quercina clade) partitions, respectively. Four Markov chains were run for 10 million generations with three heated chains (temperature = 0.2) and one cold chain. Trees were sampled every 1000 steps after removing the first 6000 generations as burn in. For the multigene BI analysis of Clade 7a 20 million, generations with a burn in of the first 8000 generations were used. Phylogenetic trees were visualized in MEGA6 (Tamura et al. 2013) and edited in figure editor programs. All alignments and trees deriving from BI and ML analyses were deposited in TreeBASE (20982; http://purl.org/phylo/treebase/phylows/study/TB2:S20982).
Morphology of asexual and sexual structures
Morphological features and morphometric data of sporangia, oogonia, oospores, antheridia, chlamydospores, hyphal swellings, and aggregations of the four new species were compared with each other and with those of related species from published studies.Formation of sporangia was induced by submerging two 12–15 mm square discs cut from the growing edge of a 3-7-d-old V8A colony in a 90 mm diam Petri dish in non-sterile soil extract (50 g of filtered oak forest soil in 1000 mL of distilled water, filtered after 24 h; Jung et al. 1996). The Petri dishes were incubated at 20 ºC in natural daylight and the soil extract changed after ca 6 h (Jung et al. 2017b). Shape,
type of apex, caducity and special features of sporangia and the formation of hyphal swellings and aggregations were recorded after 24–48 h. For each isolate 50 sporangia were measured at x400 using a compound microscope (Zeiss Imager.Z2), a digital camera (Zeiss Axiocam ICc3) and a biometric software (Zeiss AxioVision).
The formation of gametangia (oogonia and antheridia) and their characteristic features were examined on V8A after 21-30 d growth at 20 ºC in the dark. For each isolate each 50 oogonia, oospores and antheridia chosen at random were measured under a compound microscope at x400 as described before. The oospore wall index was calculated according to Dick (1990).
For comparisons, morphometric, morphological and physiological data of P. quercina and Phytophthora species from Clade 7a, respectively, were taken from published descriptions (Jung et al. 1999, 2002, 2017b).
Colony morphology, growth rates and cardinal
temperatures
Colony growth patterns of Phytophthora species were described from 15-d-old (Clade 7a species) and 10-d-old (P. castanetorum, P. quercina, and P. tubulina) cultures grown at 20 °C in the dark on CA, V8A, malt-extract agar (MEA; Oxoid,
Basingstoke, UK) and potato-dextrose agar (PDA; Oxoid) according to Scanu et al. (2014a), Jung et al. (1999, 2017b), and Erwin & Ribeiro (1996).
For temperature-growth relationships, representative isolates of the four new Phytophthora species and P. quercina (Supplementary Table 1) were subcultured onto 90 mm V8A plates and incubated for 24 h at 20 °C to stimulate onset of growth (Jung et al. 1999). Then, three replicate plates per isolate were transferred to 5, 10, 15, 20, 25, 30, and 35 °C. Radial growth was recorded after 6 d, along two lines intersecting the centre of the inoculum at right angles and the mean growth rates (mm/d) were calculated. Plates showing no growth at 30 or 35 °C were returned to 20 °C to determine isolate viability.
Soil infestation trials
In order to fulfil Koch’s postulates, pathogenicity of all four new Phytophthora species was tested using the soil infestation method described by Jung et al. (1996). Phytophthora tubulina and P. vulcanica were tested in trial 1 with 3-year-old saplings of Fagus sylvatica, while P. castanetorum and P. tyrrhenica were tested in trial 2 with 1-year-old seedlings of Castanea sativa, and Quercus ilex and Q. suber, respectively. Saplings and seedlings were sourced from local nurseries and confirmed to be non-infested by Phytophthora using the soil baiting method described before. Two isolates for each new Phytophthora species were used, and isolates of P. xcambivora and P. cinnamomi (both primary pathogens of Fagaceae) were included as positive controls (Supplementary Table 1). Inocula consisted of 4-wk-old cultures of the respective Phytophthora isolate grown at 20 ºC in 500 mL Erlenmeyer flasks on an autoclaved mixture of 250 cm3 of vermiculite and 20 cm3 of millet seeds thoroughly moistened with 175 mL of V8-juice broth (200 mL/L juice, 800 mL/L distilled water amended with 3 g/L CaCO3) (Jung et al. 1996). Before use, the colonized medium was rinsed with
AR
TICLE
distilled water to remove excess nutrients. In trial 1, 12 plants per Phytophthora isolate were planted as pseudo-replicates in 50 x 35 x 27 cm boxes in an autoclaved mixture of peat, vermiculite, and sand (1:1:1 v:v:v). Tubes initially inserted as placeholders in the soil between the individual plants were removed and the holes were filled with the inoculum (ca 40 cm3 of inoculum per plant) (Jung et al. 2017b). Controls received only rinsed non-infested vermiculite/millet seed/V8-juice mixture at the same rate. In trial 2, ten plants of each Phytophthora isolate/ host plant combination were infested in individual pots with the same rate of inoculum as described before. In both trials, plants were incubated for five months in a walk-in growth chamber at 18–20 ºC, 65 % relative humidity, a natural daylight regime, and flooded every 3 wk for 72 h. At the end of the trial, roots were thoroughly washed free from soil. Then, specific symptoms such as root and collar rot lesions and chlorosis and wilting of foliage were recorded.
Two different root damage assessments were used. In trial 1 with Fagus sylvatica saplings, the proportion of root
damage was assessed visually after spreading the roots uniformly on trays etched with 2 x 2 cm squares according to a scale of five root damage classes: 4 = healthy root system with dense fine root system and well developed tap roots; 3 = < 25 % fine root losses and well developed tap roots; 2 = 26–50 % fine root losses, beginning taproot dieback and small necrotic lesions on woody roots and/or the collar; and 1 = 51–75 % fine root losses, advanced taproot dieback and large necrotic lesions on tap roots and/or the collar; 0 = 76–100 % fine root losses, extensive taproot dieback and girdling necrotic lesions on tap roots and/or the collar. Then roots were dried for 72h at 65 ºC and the dry weights of small woody roots (diam 2–10 mm) and fine roots (diam <2 mm) were recorded for each plant. Data were analysed using one-way ANOVA followed by Dunnett’s multiple comparisons test using the programme package Prism 6 (Graphpad, San Diego, CA). In trial 2, Castanea sativa, Quercus ilex, and Q. suber seedlings were removed from the pots and the root system gently washed under tap water (Scanu et al.
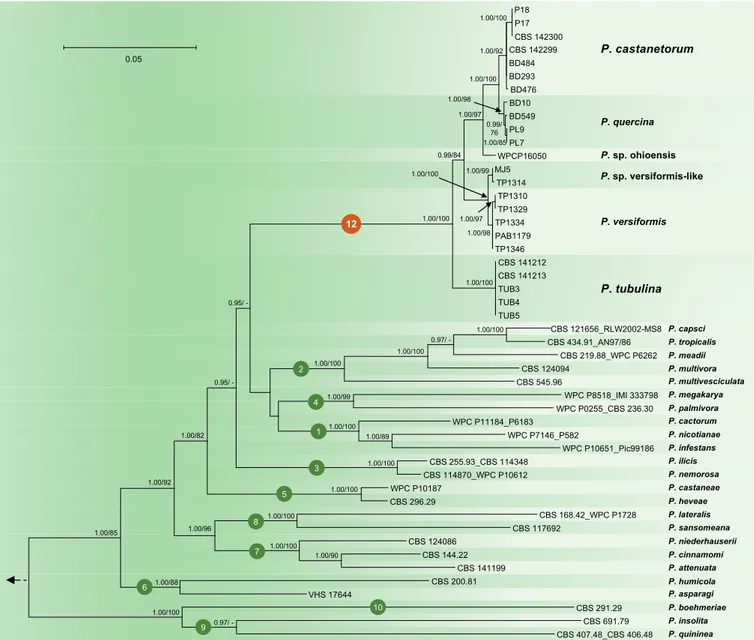
P18 P17 CBS 142300 CBS 142299 BD484 BD293 BD476 BD10 BD549 PL9 PL7 WPCP16050 MJ5 TP1314 TP1310 TP1329 TP1334 PAB1179 TP1346 CBS 141212 CBS 141213 TUB3 TUB4 TUB5 CBS 121656_RLW2002-MS8 CBS 434.91_AN97/86 CBS 219.88_WPC P6262 CBS 124094 CBS 545.96 WPC P8518_IMI 333798 WPC P0255_CBS 236.30 WPC P11184_P6183 WPC P7146_P582 WPC P10651_Pic99186 CBS 255.93_CBS 114348 CBS 114870_WPC P10612 WPC P10187 CBS 296.29 CBS 168.42_WPC P1728 CBS 117692 CBS 124086 CBS 144.22 CBS 141199 CBS 200.81 VHS 17644 CBS 291.29 CBS 691.79 CBS 407.48_CBS 406.48 0.05 1.00/100 1.00/92 1.00/100 1.00/97 1.00/98 0.99/ 76 1.00/85 0.99/84 1.00/99 1.00/100 1.00/97 1.00/98 1.00/100 1.00/100 0.95/ -1.00/100 0.97/ -1.00/100 1.00/100 1.00/99 1.00/100 1.00/89 1.00/100 0.95/ -1.00/82 1.00/92 1.00/85 1.00/100 1.00/100 1.00/96 1.00/100 1.00/90 1.00/88 1.00/100 0.97/ -P. castanetorum P. quercina P. sp. ohioensis P. versiformis P. tubulina P. cactorum P. infestans P. nicotianae P. multivesciculata P. meadii P. multivora P. capsci P. tropicalis P. ilicis P. nemorosa P. megakarya P. palmivora P. castaneae P. heveae P. lateralis P. sansomeana P. niederhauserii P. attenuata P. cinnamomi P. asparagi P. humicola P. boehmeriae P. insolita P. quininea 12 4 1 2 3 5 8 7 6 10 9 P. sp. versiformis-like
Fig. 1. Fifty percent majority rule consensus phylogram derived from Bayesian inference analysis of four–locus (ITS, Btub, HSP90, NADH1) dataset of the Phytophthora Clade 12 and representative species from phylogenetic Clades 1–10. Bayesian posterior probabilities and Maximum Likelihood bootstrap values (in %) are indicated, but not shown below 0.90 and 70 %, respectively. Nothophytophthora amphigynosa was used as outgroup taxon (not shown). Bar = 0.05 expected changes per site per branch.
AR
TICLE
2014a). Single roots were then cut off at the collar, scanned and total root length for each plant was calculated using the APS Assess 2.0 software (The American Phytopathological Society, St Paul, MN).
In all cases, re-isolations of Phytophthora from necrotic tissues were made using selective PARPNH agar (Jung 2009). During each flooding cycle, soils were baited using young leaves of Ceratonia siliqua, F. sylvatica and Q. suber as baits in order to test whether the respective Phytophthora species was still active. After each flooding cycle, the water was collected and autoclaved. At the end of the trial boxes were sterilised with bleach and infested substrates and the plants were autoclaved.
RESULTS
Phylogenetic analysis
Sequence datasets of Clade 7a species and species related to Phytophthora quercina were analysed separately. All
phylogenetic analyses of individual nuclear (ITS, Btub, and HSP90) and mitochondrial (cox1 and NADH1) DNA sequences resulted in similar overall tree topologies (data not shown), thus indicating that the individual loci could be combined.
To resolve the phylogenetic positions of P. castanetorum and P. tubulina within the P. quercina clade, and of the latter within the genus Phytophthora, a 4-loci dataset (ITS–Btub– HSP90–NADH1) and a nuclear 3-loci dataset (ITS–Btub– HSP90) were analysed separately. Compared to the ML analyses, the BI analyses provided higher support for both terminal clades and the deeper branches. Since the topologies of the BI and ML trees were congruent, the Bayesian trees are presented here (Figs 1–2) with both BI Posterior Probability values and ML bootstrap values shown at the nodes. The resulting phylogenies of the genus Phytophthora were rooted to Nothophytophthora amphigynosa and were in accordance with several published studies (Blair et al. 2008, Martin et al. 2014, Rahman et al. 2015) with the exception that the inclusion of the two new species P. castanetorum
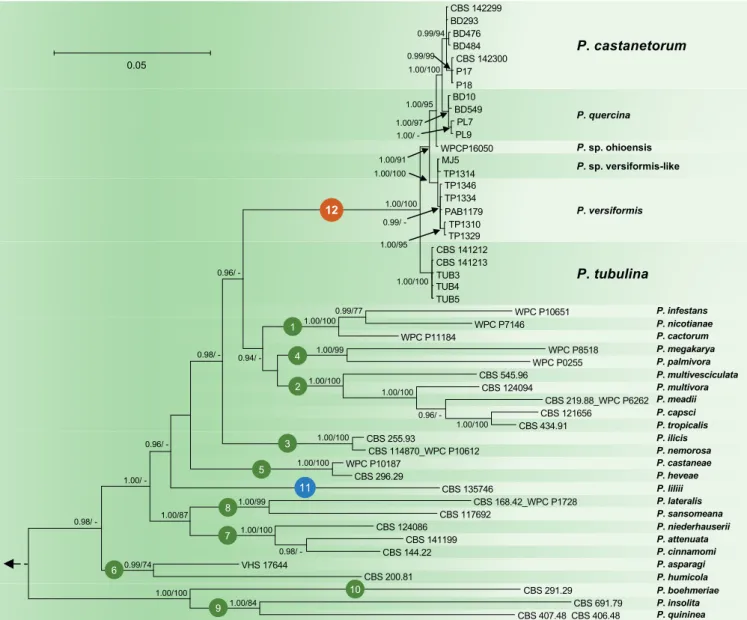
CBS 142299 BD293 BD476 BD484 CBS 142300 P17 P18 BD10 BD549 PL7 PL9 WPCP16050 MJ5 TP1314 TP1346 TP1334 PAB1179 TP1310 TP1329 CBS 141212 CBS 141213 TUB3 TUB4 TUB5 WPC P10651 WPC P7146 WPC P11184 WPC P8518 WPC P0255 CBS 545.96 CBS 124094 CBS 219.88_WPC P6262 CBS 121656 CBS 434.91 CBS 255.93 CBS 114870_WPC P10612 WPC P10187 CBS 296.29 CBS 135746 CBS 168.42_WPC P1728 CBS 117692 CBS 124086 CBS 141199 CBS 144.22 VHS 17644 CBS 200.81 CBS 291.29 CBS 691.79 CBS 407.48_CBS 406.48 0.05 0.99/94 1.00/97 0.99/99 1.00/100 1.00/95 1.00/ -1.00/91 1.00/100 1.00/100 0.99/ -1.00/95 1.00/100 0.96/ 0.98/ 0.96/ 1.00/ 0.98/ -0.99/77 1.00/100 1.00/99 0.94/ -1.00/100 1.00/100 0.96/ -1.00/100 1.00/100 1.00/100 1.00/99 1.00/87 1.00/100 0.98/ -0.99/74 1.00/100 1.00/84 12 4 11 1 2 3 5 8 7 6 10 9 P. cactorum P. infestans P. nicotianae P. multivesciculata P. meadii P. multivora P. capsci P. tropicalis P. ilicis P. nemorosa P. megakarya P. palmivora P. castaneae P. heveae P. castanetorum P. quercina P. sp. ohioensis P. sp. versiformis-like P. versiformis P. tubulina P. liliii P. lateralis P. sansomeana P. niederhauserii P. attenuata P. cinnamomi P. asparagi P. humicola P. boehmeriae P. insolita P. quininea
Fig. 2. Fifty percent majority rule consensus phylogram derived from Bayesian inference analysis of nuclear three–locus (ITS, Btub, HSP90) dataset of Phytophthora Clade 12 and representative species from phylogenetic Clades 1–11. Bayesian posterior probabilities and Maximum Likelihood bootstrap values (in %) are indicated, but not shown below 0.90 and 70 %, respectively. Nothophytophthora amphigynosa was used as outgroup taxon (not shown). Bar = 0.05 expected changes per site per branch.
AR
TICLE
and P. tubulina and the three taxa P. sp. ohioensis, P. versiformis, and P. sp. versiformis-like, allowed to resolve the phylogenetic position of the P. quercina clade within Phytophthora. Together with P. quercina, P. sp. ohioensis, P. versiformis, and P. sp. versiformis-like, P. castanetorum and P. tubulina formed a fully supported monophyletic group (BI posterior probability = 1.00, ML bootstrap = 100 %; Figs 1–2). Since in the analysis of the nuclear 3-loci dataset P. lilii formed a distinct clade (Fig. 2), confirming Rahman et al. (2015), the names Clade 11 and Clade 12 are proposed here for P. lilii and the new P. quercina clade, respectively. In the analyses of both datasets, Clade 12 formed a fully supported group together with Clades 1, 2 and 4, while Clade 3 was basal to this group (Figs 1–2). Within Clade 12, isolates of P. castanetorum grouped in a well-supported cluster together with P. quercina (posterior probability = 1.00, ML bootstrap = 100 %). Phytophthora sp. ohioensis from North America appeared in a basal position of this cluster, while P. versiformis and P. sp. versiformis-like formed an Australian cluster which grouped in a sister position to the P. quercina–P. castanetorum–P. sp. ohioensis cluster (Figs 1–2). Phytophthora tubulina appeared in a basal position of Clade 12 (Figs 1–2). In the separate BI and ML analyses of an ITS sequence alignment, P. sp. quercina-like, for which only an ITS sequence was available, grouped within Clade 12 (data not shown, but available from TreeBASE: S20982). Phytophthora castanetorum differed from the closest taxon P. quercina and from P. sp. ohioensis in three nuclear (ITS– Btub–HSP90) and the mitochondrial NADH1 gene regions by 9–20 and 23–28 characters, respectively, and from the more distantly related P. versiformis, P. sp. versiformis-like, and P. tubulina by 45–52, 45–51 and 97–102 characters, respectively (Table 1). In addition, in cox1 P. castanetorum showed differences to P. quercina at 5–14 positions (Table 1). Isolates of P. castanetorum showed intraspecific variability, with the Sardinian isolates forming a distinct cluster (Figs 1–2). DNA sequences of Sardinian isolates differed from those of P. castanetorum from Portugal in Btub and NADH1 by 3 bp and 2 bp, respectively (Table 1). In contrast, P. tubulina isolates were identical across all five loci examined. Phytophthora versiformis and P. sp. versiformis-like showed differences to each other at 6–9 positions, and to P. castanetorum and P. quercina at 45–52 and 46–53 positions, respectively (Table 1). The basal species P. tubulina differed from P. castanetorum, P. quercina, P. sp. ohioensis, P. versiformis and P. sp. versiformis-like by 97–102, 92–106, 57, 51–53 and 52–53 characters, respectively (Table 1). In addition, P. tubulina was separated from P. castanetorum and P. quercina in cox1 by 37 and 33–42 characters, respectively (Table 1).
Bayesian and ML analyses of the combined five locus dataset for Clade 7a generated trees with essentially the same topology. The Bayesian analysis provided more support for deeper branches, while support for terminal clades and their clustering was equivalent in both analyses. The Bayesian tree is shown in Fig. 3 with both BI posterior probability and ML bootstrap values provided at the nodes (Fig. 3). The resolution was good at terminal clades and allowed for the differentiation of 17 distinct lineages within Clade 7a corresponding to 14 described species, P. attenuata, P. europaea, P. flexuosa, P. formosa, P. intricata, P. fragariae, P. rubi, P. uliginosa, P.
Table 1.
Pairwise numbers of dif
ferent positions along alignments of ITS (842 bp), Btub (91
1 bp), HSP90 (840 bp),
cox
1 (867 bp) and NADH1 (797 bp) among the taxa from
Phytophthora Clade 12. Phytophthora P. castanetorum P. quercina P. sp. ohioensis P. sp. versiformis P. sp. versiformis-like P. tubulina
Total no. of unique
species polymorphisms ITS Btub HHSP90 Cox1 NADH1 ITS Btub HHSP90 Cox1 NADH1 ITS Btub HHSP90 Cox1 NADH1 ITS Btub HHSP90 Cox1 NADH1 ITS Btub HHSP90 Cox1 NADH1 ITS Btub HHSP90 Cox1 NADH1 ITS Btub HHSP90 Cox1 NADH1 P. castanetorum 0 0-3 0 0 0-2 3 0-5 2-3 5-14 4-9 1 2-5 2 n.a. 18- 20 2-4 7-10 6 n.a. 30- 32 2-3 6-9 6 n.a. 31-33 9 4-7 8 37 39- 41 1 0-3 1 5 3-5 P. quercina 3 0-5 2-3 5-14 4-9 0 0-2 0-1 0-9 0-3 2 2-4 2-3 n.a. 15- 18 3-5 7-9 6-7 n.a. 30- 32 3-4 6-8 6-7 n.a. 32-34 10 4-6 8-9 33- 42 37- 39 2 0-2 1-2 0-9 1-4 P. sp. ohioensis 1 2-5 2 n.a. 18-20 2 2-4 2-3 n.a. 15-18 0 0 0 n.a. 0 1-3 5 4 n.a. 29 1-2 4 4 n.a. 29 8 3 6 n.a. 40 0 0 0 n.a. 4 P. sp. versiformis 2-4 7-10 6 n.a. 30-32 3-5 7-9 6-7 n.a. 30-32 1-3 5 4 n.a. 28 0-2 0 0 n.a. 0 0-3 1 0 n.a. 5 9-1 1 4 4 n.a. 34 0-2 1 0 n.a. 2 P. sp. versiformis -like 2-3 6-9 6 n.a. 31-33 3-4 6-8 6-7 n.a. 32-34 1-2 4 4 n.a. 29 0-3 1 0 n.a. 5 0-1 0 0 n.a. 0 9-10 5 4 n.a. 34 0-1 0 0 n.a. 3 P. tubulina 9 4-7 8 37 39-41 10 4-6 8-9 33- 42 37-39 8 3 6 n.a. 40 9-1 1 4 4 n.a. 34 9-10 5 4 n.a. 34 0 0 0 0 0 8 1 3 33 23
n.a. = not available due to insufficient overlap between
cox 1 sequences of P. sp. ohioensis, P. versiformis and P.
sp. versiformis-like from GenBank and of
P. castanetorum
, P
. quercina
and
P. tubulina
generated in this study
.
AR
TICLE
uniformis, P. xcambivora, P. xheterohybrida, P. xincrassata, P. xalni / P. xmultiformis, the two informally designated taxa P. sp. xcambivora-like and P. sp. xmultiformis-like, and the two new species P. tyrrhenica and P. vulcanica described in this study (Fig. 3). Isolates of P. tyrrhenica grouped together with
P. uliginosa in a well-supported clade (posterior probability = 1.00, ML bootstrap = 100 %), both species being separated by 2, 4 and 1–2 characters in ITS, Btub and HSP90, respectively, and by 22–24 and 8–10 characters in cox1 and NADH1, respectively. The relative phylogenetic position
P. vulcanica
CBS 109054 CBS 142303 TYR1 TYR3 TYR4 TYR5 CBS 142301 PH155 CBS 141200 CBS 141199 BBA1194 BBAL1 CH106 CBS 967.95 P876 ALN58 CBS 111329 4044.1 CBS 141218 4971496 REIS2 IMI 392314 PAM396 IMI 392316 TW32 CBS 141207 CBS 141208 CBS 141209 CBS 141204 CBS 141203 CBS 141210 CBS 141211 CBS 109051 CBS 109049 CBS 141202 CBS 141201 CBS 141216 CBS 141217 X3c X3d X3eP. tyrrhenica
P. uliginosa
P. attenuata
P. fragariae
P. rubi
P. uniformis
P. sp. xcambivora-likeP. xcambivora
P. sp. xmultiformis-likeP. xalni + P. xmultiformis
P. xheterohybrida
P. xincrassata
P. formosa
P. intricata
P. europaea
P. flexuosa
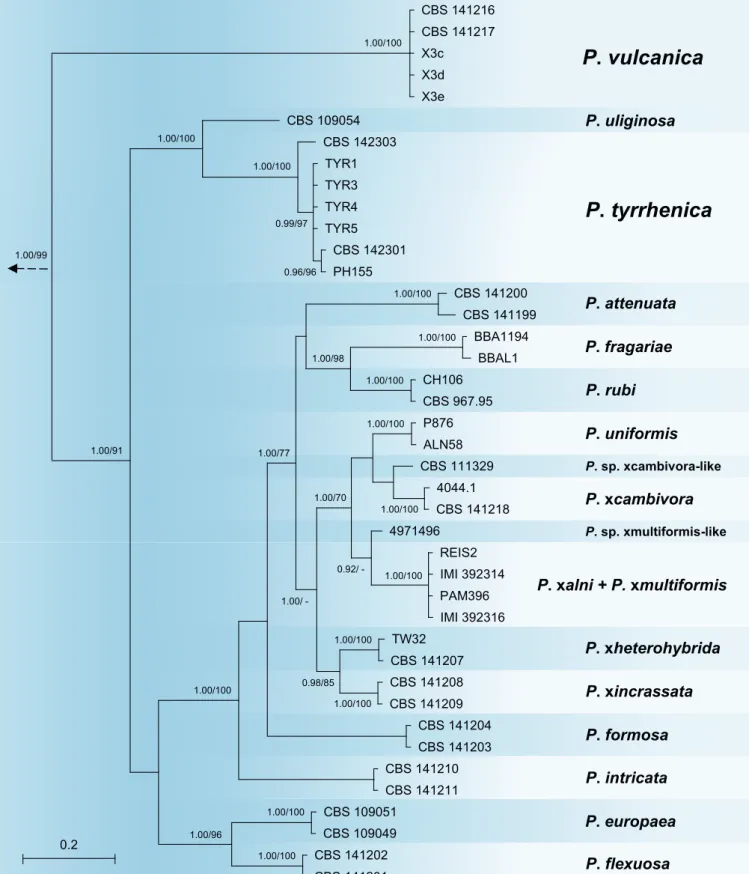
0.2 1.00/100 1.00/100 0.99/97 0.96/96 1.00/98 1.00/100 1.00/100 1.00/100 1.00/100 1.00/100 0.92/ - 1.00/100 1.00/70 1.00/100 1.00/100 0.98/85 1.00/ -1.00/100 1.00/77 1.00/96 1.00/100 1.00/100 1.00/91 1.00/99 1.00/100Fig. 3. Fifty percent majority rule consensus phylogram derived from Bayesian phylogenetic analysis of five–locus (ITS, Btub, HSP90, cox1, NADH1) dataset of Clade7a. Bayesian posterior probabilities and Maximum Likelihood bootstrap values (in %) are indicated, but not shown below 0.90 and 70 %, respectively. Phytophthora cinnamomi and P. niederhauserii from Clade 7b were used as outgroup taxa (not shown). Bar = 0.05 expected changes per site per branch.
AR
TICLE
of P. tyrrhenica and P. uliginosa was also well-supported (Fig. 3). The P. tyrrhenica–P. uliginosa clade grouped in a sister position to the remaining in-group taxa representing 15 taxa from Clade 7a (Fig. 3). Small intraspecific variation of up to seven characters across the five gene regions was found amongst P. tyrrhenica isolates, which was related to different oak species and geographic origin. Isolate PH103 (from Quercus suber in Sardinia) represented a distinct basal lineage (Fig. 3). In contrast, P. vulcanica was monomorphic across all five loci examined, suggesting that the tested isolates could belong to the same clone of the species. Across the five DNA regions, P. vulcanica showed differences to its closest relatives P. uliginosa and P. tyrrhenica at 109 and 109–114 positions, respectively, and resided in a well-supported basal position of the whole Clade 7a (Fig. 3).
Hosts and geographic distribution
Phytophthora castanetorum was exclusively isolated from
Castanea sativa forests in Portugal, at Monchique (N 37o
18.851', W 8o 32.455'; 496 m above sea level, asl) and in the
Parque Natural Serra da Estrela (N 40o 25.489, W 7o 22.523';
901 m asl), and in Sardinia at Gennargentu montain (N 39o
56.946', E 9o 11.387'; 858 m asl). It usually co-occurred with
P. xcambivora and P. cinnamomi, associated with severe ink disease symptoms. Phytophthora tubulina was isolated alongside P. xcambivora and P. plurivora from mildly declining Fagus sylvatica trees in the Dunkelsteiner Forest in Austria (N 48o 14.561', E 15o 28.276'; 497 m asl), while P. vulcanica
was recovered from relatively healthy F. sylvatica trees at Timpa Rossa on Mount Etna in Sicily (N 37o 48.849', E 15o
1.407'; 1862 m asl). Phytophthora tyrrhenica was associated with declining Quercus ilex and Q. suber trees in different forest stands on the Italian islands Sardinia (N 40o 52.492', E
9o 2.720'; 183 m asl) and Sicily (N 37o 54.341', E 14o 4.490';
1110 m asl).
Soil infestation trials
Pathogenicity on Fagus sylvatica seedlings (trial 1)
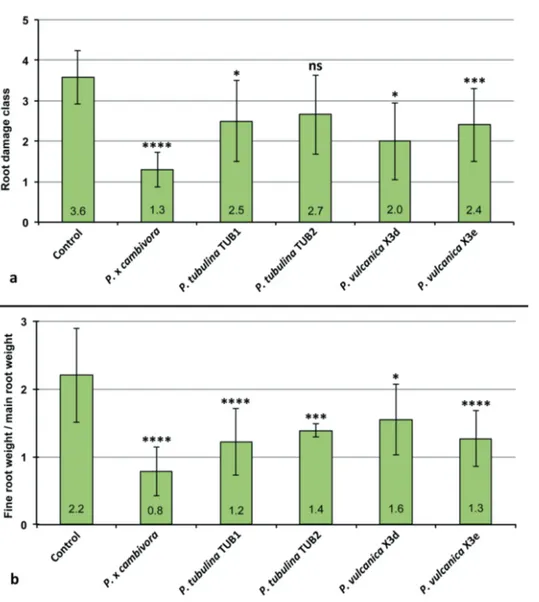
At the end of the trial shoots and root systems of control plants of F. sylvatica were generally healthy and well developed with a fine root/main root weight (frw/mrw) ratio of 2.2 and a root damage class of 3.6 ± 0.67 (Fig. 4). Phytophthora xcambivora was the most aggressive species causing after 5 months 50 % mortality, a frw/mrw ratio of 0.78 ± 0.36 (64.5 % reduction compared to the control), 54.4 % reduction of fineFig. 4. Mean root damage class and mean fine root weight / main root weight ratio of 3–year–old Fagus sylvatica plants after 5 months growth in uninfested soil (control) and in soil infested by
Phytophthora xcambivora (CBS
141218), P. tubulina (CBS 141212, CBS 141213) and P. vulcanica (X3d, X3e), respectively. Bars show standard deviations; asterisks represent statistical significances (* = P < 0.05, ** = P < 0.01, *** = P < 0.001, **** = P < 0.0001), ns = not significant.
AR
TICLE
root weight compared to control plants and a root damage class of 1.3 ± 0.14 (i.e. 67.5 % fine root losses and advanced dieback and necrotic lesions of tap roots and root collars) (Fig. 4). Phytophthora tubulina isolates (TUB1= CBS 141212 and TUB2= CBS 141213) caused 8.3 and 16.6 % mortality, a frw/mrw ratio of 1.22 ± 0.49 and 1.39 ± 0.1 (44.5 and 36.8 % reduction compared to the control), and a root damage class of 2.5 ± 1.0 and 2.7 ± 1.0, respectively (Fig. 4). Beech plants in soil infested by isolates X3d and X3e of P. vulcanica had a frw/mrw ratio of 1.55 ± 0.52 and 1.27 ± 0.41 (29.8 and 42.3 % reduction compared to the control), and a root damage class of 2.0 ± 0.95 and 2.4 ± 0.9, respectively (Fig. 4). Both isolates caused 8.3 % mortality and, chlorosis and wilting in 58.3 % (X3d) and 75 % (X3e) of the plants. Differences of root damage class and frw/mrw ratio to the control were statistically significant for P. xcambivora, both isolates of P. vulcanica and isolate TUB1 of P. tubulina (Fig. 4). For P. tubulina isolate TUB 2, the difference to the control was only significant for the frw/mrw ratio but not for the root damage class (Fig. 4).
Pathogenicity on Castanea sativa seedlings (trial 2)
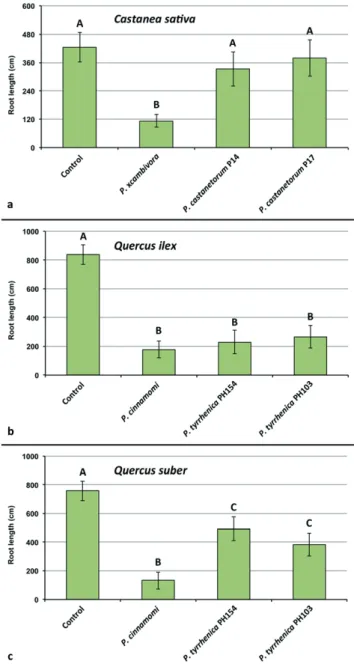
At the end of the experiment seedlings inoculated with P. xcambivora were mostly dead (mortality rate above 80 %) or showed severe wilting associated with collar and root necrosis. In contrast, all seedlings inoculated with P. castanetorum were alive and showed only weak symptoms of wilting and chlorosis of leaves. Control plants did not show any aboveground symptoms and exhibited overall faster growth. Phytophthora xcambivora was extremely aggressive to the root systems causing more than 60 % reduction of total root length (P < 0.0001). In contrast, seedlings inoculated with P. castanetorum showed only mild fine root infections but no symptoms of woody root and collar infections, and total root length did not differ statistically from the control plants (Fig. 5).Pathogenicity on Quercus ilex and Quercus suber
seedlings (trial 2)
Oak seedlings inoculated with P. tyrrhenica started to show symptoms of leaf chlorosis and shoot dieback 45 d post-inoculation. Mortality of seedlings occurred between the third and fourth month after inoculation. Based on mortality rates after five months, P. cinnamomi was more aggressive than P. tyrrhenica on both Q. ilex and Q. suber, killing 80 % and 63.5 % of seedlings, respectively, whereas P. tyrrhenica caused an average mortality on Q. ilex and Q. suber of 48.5 % and 25 %, respectively. On Q. ilex, both Phytophthora species caused fine root losses and necrosis of mother roots, and a significant reduction in root length compared to control seedlings (P < 0.0001) (Fig. 5). Phytophthora cinnamomi caused significantly higher root reduction than P. tyrrhenica for which Dunnett’s test revealed no significant differences in total root length of inoculated seedlings. Also on Q. suber, both P. cinnamomi and P. tyrrhenica caused significant total root length reduction, but the reduction by P. cinnamomi was significantly higher from that caused by both isolates of P. tyrrhenica (P < 0.0001) (Fig. 5).
At the end of all pathogenicity trials, each Phytophthora species could be re-isolated from both infested soils using
young leaves of C. siliqua, F. sylvatica and Q. suber as baits and necrotic fine roots or necrotic root lesions by direct plating onto PARPNH agar. No Phytophthora species could be isolated from soil and roots of control plants.
TAXONOMY
Morphological and physiological characters and measurements of the four new Phytophthora taxa and related species are given in the comprehensive Table 2.
Fig. 5. Mean root length of 1–year–old plants of Castanea sativa, Quercus ilex and Q. suber after 5 months growth in uninfested soil
(control) and in soil infested by Phytophthora xcambivora (CBS 141218), P. castanetorum (CBS 142300, P17), P. cinnamomi (PH069) and P. tyrrhenica (CBS 142301, CBS 142303), respectively. Bars show standard deviations; asterisks represent statistical significances (* = P < 0.05, ** = P < 0.01, *** = P < 0.001, **** = P < 0.0001), ns = not significant.
AR
TICLE
Table 2. Morpholo gical characters and dimensions (µm), cardinal temperatures (°C) and temperature-growth relations (mm/d) on V8A of Phytophthora castanetorum , P . tyrrhenica , P . tubulina , P . vulcanicaand their closest relatives in
phylogenetic Clades 7a and 12, respectively
. Most discriminating characters are highlighted in bold.
P. castanetorum P. tubulina P. quercina P. tyrrhenica P. vulcanica P. uliginosa P. europaea P. flexuosa No. of isolates 9 5 10 b 7 5 3 a 7 a 3 a Sporangia
ovoid, subglobose, obpyriform, globose, (ellipsoid, distorted) ovoid, obpyriform, distorted, (globose, subglobose, ellipsoid, limoniform) subglobose, ovoid, obpyriform, peanu
t,
ampulliform, distorted
elongated ellipsoid
,
elongated ovoid, elongated limoniform ovoid, ellipsoid, (obpyriform, pyriform)
ellipsoid
, ovoid,
peanut-shaped, (obpyriform, limoniform) ovoid, obpyriform, ellipsoid, (subglobose), ovoid, ellipsoid, (obpyriform, limoniform)
apex 77.4 % papillate, 14.9 % semipapillate; 7.7 % nonpapillate , 4.9 % curved
78 % mono-, bi- or tripapillate; 13.3 % semi- papillate;
8.7 %
non-papillate
, 4.9 % curved
all papillate
, some
bi- and tripapillate; often curved
nonpapillate
nonpapillate
nonpapillate
nonpapillate, often pointed
lxb mean 47.0±5.7 x 36.6±3.7 51.6±9.8 x 37.3±7.0 42.4±1 1.5 x 29.3±13.8 68.4±1.7 x 28.9±1.9 57.3±8.7 x 34.5±4.2 67.0±8.5 x 42.4±6.4 63.7±16.9 x 44.6±8.3 56.1±7.4 x 36.7±5.2
range of isolate means 44.2–48.1 x 35.4– 38.3 43.3–57.8 x 31.2–45.0 36.0–49.2 x 23.3– 33.7 66.1–70.0 x 27.5–31.9 53.6 – 61.0 x 31.8 – 36.4 65.7–70.3 x 30.9– 44.4 50.0–78.9 x 36.7–51.2 53.3–58.6 x 33.9–39.4 total range 27.1–74.5 x 18.1– 47.9 29.5–98.5 x 19.2–59.2 18.8–1 12.5 x 13.8–47.5 45.3–1 10.2 x 16.2– 39.4 35.5 – 80.7 x 22.5 – 42.9 41.1–85.0 x 24.8– 56.9 23.6–124.3 x 21.9–67.3 34.9–74.8 x 22.8–49.7 l/b ratio 1.29 ± 0.15 1.40 ± 0.18 1.45 ± 0.37 2.40 ± 0.18 1.67 ± 0.22 1.60 ± 0.19 1.42 ± 0.19 1.54 ± 0.18 caducity – rare – – – – – – lateral insertion 37.7 % 22.4 % frequent exit pores 7.0 ± 1.1 6.4 ± 1.2 6.5 ± 1.2 12.1 ± 2.4 17.0 ± 3.0 15.4 ± 3.4 19.3 ± 4.7 19.7 ± 3.4 zoospore cysts 9.2 ± 1.0 11.7 ± 1.8 9.5 (7.1–12.9) 14.6 ± 2.3 10.0 ± 1.2 11.9 ± 1.8 15.3 ± 2.0 13.3 ± 1.3 Breeding system homothallic homothallic homothallic homothallic homothallic homothallic homothallic homothallic
Oogonia mean diam
32.9 ± 3.0 29.2 ± 4.4 29.4 ± 4.1 37.2 ± 3.3 35.8 ± 3.6 46.2 ± 7.5 37.3 ± 5.4 36.8 ± 3.3
range of isolate means
30.5–34.4 25.4-30.1 25.8–32.0 36.8–40.9 33.6 – 36.5 41.6–53.3 34.4–39.9 36.0-38.3 total range 24.3–41.7 16.5–42.5 19.0–45.0 25.0–39.3 23.0–46.0 17.9–65.5 19.2–48.4 25.7–42.8 tapering base 61.3 % (40–86 %) 48.7 % (30–78 %) n.a. – 37.3 % (8–60 %) – 60.0 % (52–81 %) 47.9 % (32–58 %) elongated 65.4 % (50–82 %) 59.5 % (36–86 %) 45 % (10–86 %) – 44.8 % (8–80 %) – 21.3 % (12–34 %) 19.7 % (4–36 %) tubular – 24.5 % (21–28 %) – – – – – – excentric 6.7 % (2–20 %) 5.0 % (2–8 %) n.a. – 20.9 % ( 9–46 %) – 4.0 % (0–8 %) 5.3 % (2–10 %) smooth-walled 100 % 100 % 100 % 100 % 100 % 100 % 100 % 34.4 % (19–48 %)
Oospores plerotic oospores
64.3 % (50–83 %) 44 % (24–76 %) mostly aplerotic >99 % (99–100 %) 27.3 % (10–45 %) 30.0 % (12-46 %) 46.3 % (38–53 %) >99 % (99–100 %)
AR
TICLE
Table 2. (Continued). P. castanetorum P. tubulina P. quercina P. tyrrhenica P. vulcanica P. uliginosa P. europaea P. flexuosa mean diam 28.7 ± 2.6 26.1 ± 3.7 24.7 ± 2.6 33.7 ±1.3 30.5 ± 3.2 41.3 ±6.1 33.2 ± 5.3 32.2 ± 2.7 Total range 21.9–38.8 15.7–36.3 18.0–30.0 24.6–39.9 19.7-38.2 12.5-55.0 16.3–45.1 22.7–37.7 wall diam 3.1 ± 0.49 2.0 ± 0.6 2.4 ± 0.56 2.9 ± 1.5 2.4 ± 0.4 4.2 ± 0.7 2.5 ± 0.7 3.1 ± 0.5oospore wall index
0.51 ± 0.05 0.38 ± 0.08 0.44 ± 0.1 0.41 ± 0.03 0.40 ± 0.06 0.49 ± 0.07 0.38 ± 0.06 0.47 ± 0.06 Abortion rate 21.5 % (18–29 %) 72.3 % (40–91 %) <10 % 5 % (3–7 %) 52.8 % (0–80 %) 6.2 % (3-10 %) 24.9 % (18–31 %) 1.7 % (1–2 %) Antheridia 99 % paragynous 100 % paragynous 100 % paragynous 100 % paragynous 4.7 % amphigynous 100 % paragynous 100 % paragynous 100 % paragynous size 14.0±2.3 x 10.2±1.6 14.9±3.1 x 10.9±1.7 16.6±6.3 x 12.7±2.5 16.9±4.6 x 12.8±0.13 16.3±3.1 x 12.6±2.3 16.9±3.1 x 13.3±2.5 13.6±2.6 x 10.8±2.1 13.4±2.1 x 10.0±1.7 Chlamydospores globose –
rare, in some isolates
– – – – – mean diam 29.5 ± 4.9 (17.7–4 7.0) 17–35 Hyphae
Sympodial branching with protruding tip of mother hypha Sympodial branching with protruding tip of mother hypha Sympodial branching with protruding tip of mother hypha Often inflated tubular or club- shabed
Coralloid Hyphal aggregations – – – – + (+) – – Hyphal swellings
in water; globose, subglobose, limoniform; some catenulate in water; subglobose, triangular; some catenulate
–
in water; subglobose, irregular
, catenulate
in water; subglobose, irregular
,
catenulate
in water; subglobose, irregular
, catenulate – – Maximum temperature 25–<30 25–<30 27.5 25–<30 25–<30 25 30–<35 35 Optimum temperature 20 20 25 25 15 20 25 25
Growth rate at optimum
2.9 ± 0.91 1.7 ± 1.0 3.7 1.1 ± 0.4 1.0 ± 0.1 1.2 ± 0.2 4.9 ± 0.53 4.7 ± 0.61 Growth rate at 20°C 2.7 ± 0.75 1.7 ± 1.0 3.3 1.5 ± 0.3 0.9 ± 0.04 1.2 ± 0.2 4.4 ± 0.59 4.4 ± 0.56
– = character not observed; + = character observed; n.a. = not available. a Data from Jung
et al
. (2017b).
b Morphological and morphometric data from Jung
et al
. (1999); standard
deviations of all morphometric data, oospore wall diam
AR
TICLE
Phytophthora castanetorum T. Jung, M. Horta Jung,
Bakonyi & Scanu,
sp. nov.
MycoBank MB819699
(Fig. 6)
Etymology: Referring to the association of this species with forests of Castanea sativa (Castanetum is the phytosociological term for a chestnut forest).
Diagnosis: Phytophthora castanetorum differs from all other Phytophthora species from Clade 12 by regularly producing chlamydospores, and from P. quercina also by producing a low proportion of semipapillate and nonpapillate sporangia.
Type: Portugal: Algarve: Monchique, isolated from
rhizosphere soil of a mature Castanea sativa tree, March 2015, T. Jung (CBS H-22983–holotype, dried culture on V8A; CBS 142299 = BD 292–ex-type culture). ITS and cox1 sequences GenBank MF036182 and MF036266, respectively.
Description: Sporangia, hyphal swellings and chlamydospores (Fig. 6A–G): Sporangia commonly observed in solid agar of older cultures (Fig. 6A) and produced abundantly in non-sterile soil extract; typically borne terminally on unbranched sporangiophores or in irregular lax or regular dense sympodia, and some formed on short lateral hyphae (Fig. 6H) or intercalary (Fig. 6I); non-caducous, monopapillate (77.4 %; Fig. 6A–G), very rarely bipapillate (over all isolates <1 %), semipapillate (14.9 %; Fig. 6H) or non-papillate (7.7 %; Fig. 6I), and often forming a conspicuous basal plug that protrudes into the empty sporangium (Fig. 6J); in solid agar with conspicuously protruding papillae (Fig. 6A); sporangial shapes very variable, ovoid (over all isolates 77.4 %; Fig. 6B–D, I–J) or subglobose to globose (11.7 %; Fig. 6G) to obpyriform (4.6 %; Fig. 6E), ellipsoid (2.0 %), limoniform (1.0 %; Fig. 6A, F), or distorted (3.3 %); unusual features such as lateral attachment of the sporangiophore (over all isolates 37.7 %; Fig. 6D, G), hyphal extensions (9.1 %; Fig. 6B, D), markedly curved apices (4.9 %) or the presence of a vacuole (8.0 %; Fig. 6B–G) common in all isolates. Small subglobose to limoniform hyphal swellings sometimes formed close to the sporangial base (Fig. 6C). Zoospores discharged through an exit pore 4.0–9.5 µm wide (av. 7.0 ± 1.1 µm) (Fig. 6J), limoniform to reniform whilst motile, becoming spherical (av. diam = 9.2 ± 1.0 µm) on encystment, direct germination
common in older water cultures (Fig. 6L). Sporangia of seven isolates averaged 47.0 ± 5.7 × 36.6 ± 3.7 µm (overall range 27.0–74.5 × 18.0–48.0 µm) with a range of isolate means of 44.2–48.1 × 35.4–38.3 µm and a length/breadth ratio of 1.29 ± 0.15 (range of isolate means 1.25–1.36). Swellings commonly observed in liquid culture; 27.1 ± 9.9 µm diameter (total range 10.0–47.0 µm), subglobose to globose, liminiform, pyriform or distorted; sometimes catenulate and often with individual or radiating hyphal extensions, (Fig. 6P–Q). Chlamydospores globose, produced on both CA and V8A, 29.5 ± 4.9 µm diam (total range 18.0–47.0 µm) (Fig. 6R).
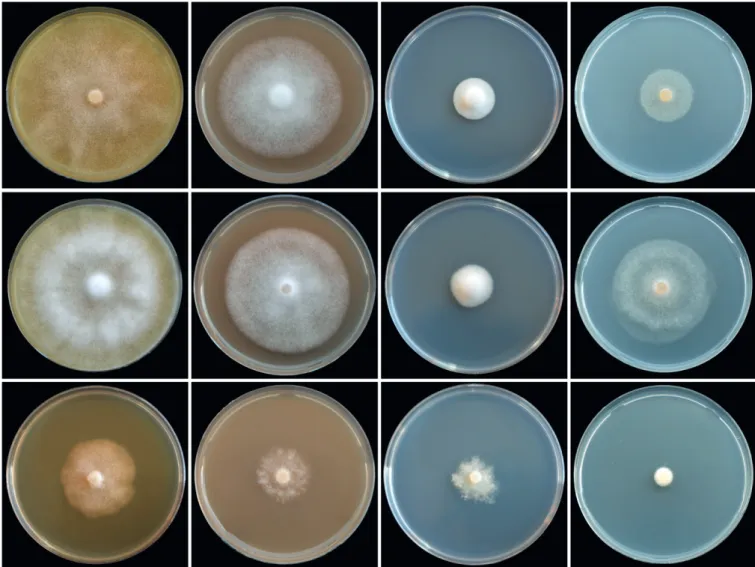
Oogonia, oospores, antheridia and hyphae (Fig. 6H–O): Gametangia readily produced in single culture by all isolates on V8A within 7-10 d. Oogonia terminal, smooth-walled, and elongated pyriform to ellipsoid (on av. 65.4 %; Fig. 6N–O) or globose to slightly subglobose (34.6 %; Fig. 6K–M); bases often tapering (61.3 %; Fig. 6K, N–O) and sometimes slightly curved (4.9 %; Fig. 6O); mean 32.9 ± 3.0 µm diam (overall range 24.5–41.5 µm and range of isolate means 30.5–34.5 µm) and an average length of 40.5 ± 4.6 µm; almost plerotic (53.1 %) or aplerotic (46.9 %). Oospores usually globose (98.3 %; Fig. 6K–N) but could be slightly elongated in elongated oogonia (1.7 %; Fig. 6O); thick-walled, wall thickness 3.1 ± 0.5 µm (range 1.8–4.5 µm), and oospore wall index 0.51 ± 0.05.; abortion 19-24 % after 4 wk increasing to 58-91 % after 12 months. Antheridia almost exclusively paragynous and club-shaped to subglobose (Fig. 6K–L, N), sometimes with one or more finger-like projections (4.3 %), but a few amphigynous antheridia observed in all isolates (Fig. 6M). Primary hyphae often branched in a mono- or dichasium with the mother hypha ending in a short protruding tip (Fig. 6S–T). Cultures (Figs 11, 13): Colonies on CA stellate with limited aerial mycelium and on V8A uniform and woolly; on PDA and MEA isolates formed uniform colonies, dense felty on PDA and mostly submerged on MEA. All isolates with very slow growth on PDA and MEA (Fig. 11). Temperature-growth relations are shown in Fig. 13. All six isolates included in the growth test had similar growth rates. The maximum growth temperature was 25–30 °C, with no grow when plates incubated for 5 d at 30 °C were transferred to 20 °C. Average radial growth rate at the optimum temperature of 25 °C 3.7 mm/d.
Additional material examined: Portugal: Beira Alta: Parque Natural da Serra da Estrela, isolated from rhizosphere soil of a mature
Fig. 6. Phytophthora castanetorum. A. papillate limoniform sporangium formed in solid V8 agar (V8A) (CBS 142299 — ex-type). B–J. Sporangia
formed on V8A flooded with soil extract. B–G. With vacuole. B. Ovoid, papillate with external proliferation close to sporangial base and hyphal
extension (arrow) (BD 484). C. Ovoid, papillate with limoniform swelling before sporangial base (CBS 142299). D. Ovoid, papillate with laterally
attached sporangiophore (BD 484). E. Obpyriform, papillate with short hyphal extension (arrow) (CBS 142299). F. Limoniform, papillate with
elongated base and conspicuous basal plug (BD 486). G. Globose, papillate with laterally attached sporangiophore (BD 484). H. Ovoid,
semipapillate on short lateral hypha (BD 476). I. ovoid, nonpapillate intercalary (BD 336). J. Ovoid sporangium with conspicuous basal plug,
releasing zoospores (CBS 142299). K–O. Mature oogonia containing thick-walled oospores with large ooplast, formed in single culture in V8A. K–L. Globose to subglobose with aplerotic oospore and paragynous antheridium (CBS 142299). M. Globose to subglobose with aplerotic
oospore and amphigynous antheridium (BD 484). N. Elongated excentric with aplerotic oospore and paragynous antheridium (BD 484). O.
Elongated pyriform with paragynous antheridium, curved base and plerotic elongated oospore with two ooplasts (CBS 142299). P–R. Hyphal
swellings formed on V8A flooded with soil extract (CBS 142299). P. Peanut-shaped intercalary. Q. Pyriform, terminal with radiating hyphal
extensions. R. Globose, terminal with short hyphal extension. S–T. Sympodially branching primary hyphae in solid V8A with the mother hypha
AR
AR
TICLE
Castanea sativa tree, June 2015, T. Jung (BD 476,484, 485, 486); Algarve: Serra de Monchique, isolated from rhizosphere soil of a
mature C. sativa tree, March 2015, T. Jung (BD 293).–Italy: Sardinia; Gennargentu mountain, isolated from rhizosphere soil of a coppiced
C. sativa tree, May 2014, B. Scanu & S. Seddaiu (CBS 142300 =
P14, P17, P18).
Phytophthora tubulina T. Jung, T. Cech, Scanu, Horta
Jung & Bakonyi,
sp. nov.
MycoBank MB819701
(Figs 7–8)
Etymology: Name refers to the tubular shape of many oogonia (tubulina Lat., tubular).
Diagnosis: Phytophthora tubulina differs from all other known Phytophthora species by having partially extremely elongated, often tubular oogonia with high oospore abortion rates, and from P. quercina by producing a low proportion of semipapillate and nonpapillate sporangia.
Type: Austria: Lower Austria; Dunkelsteiner Forst, isolated
from rhizosphere soil of a mature Fagus sylvatica tree, Sept. 2010, T. Jung (CBS H-22557–holotype, dried culture on V8A; CBS 141212 = TUB1–ex-type culture). ITS and cox1 sequences GenBank MF036196 and MF036277, respectively.
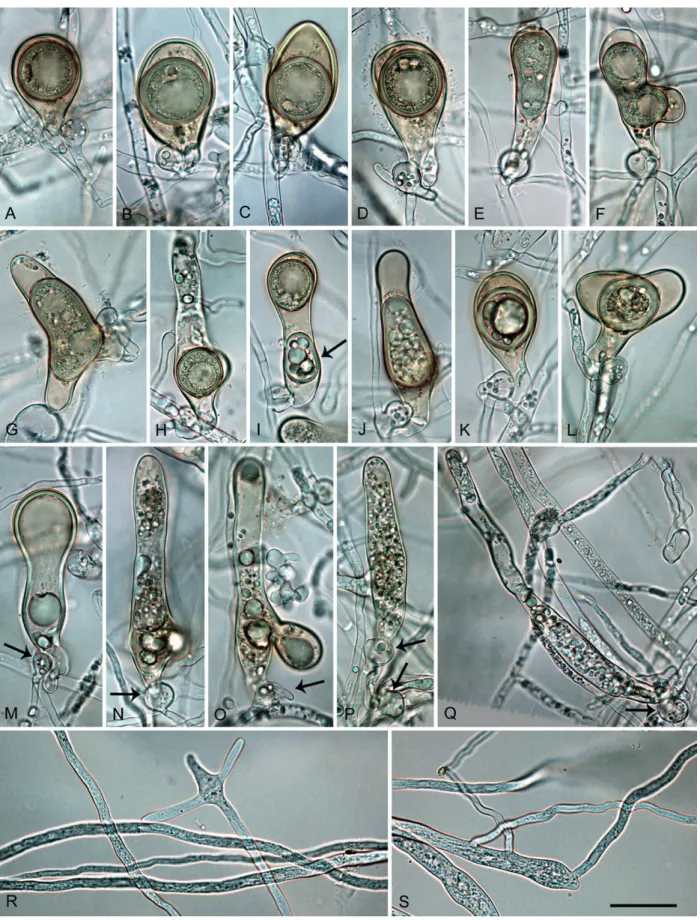
Description: Sporangia, hyphal swellings and chlamydospores (Fig. 7A–U): Sporangia infrequently observed in solid agar, abundantly produced in non-sterile soil extract; borne terminally on unbranched sporangiophores, in lax sympodia, on short lateral sporangiophores (Fig. 7B, O) or intercalary (3.4 %; Fig. 7L); sometimes formed on short hyphal appendices growing from mature sporangia (Fig. 7N); usually non-caducous (Fig. 7A–L, N, R–S) but a low proportion (<1 %) of caducous sporangia without preformed pedicels (Fig. 7O-Q) present in most isolates; apices highly variable ranging from monopapillate (56.6 %; Fig. 7A–G, N, P), bi- or tripapillate (21.4 %; Fig. 7H–I, Q), semipapillate (13.3 %; Fig. 7J) to nonpapillate (8.9 %; Fig. 7K–L, O); sometimes curved (4.9 %; Fig. 7C, G); sporangial shapes ranging from ovoid or elongated ovoid (69.4 %; Fig. 7A–B, E), obpyriform (15.3 %; Fig. 7C), limoniform (3.0 %; Fig. 7D), subglobose (3.7 %) or less frequently ellipsoid and globose (2.3 %) to distorted shapes (6.3 %; Fig. 7H–I, Q); hyphal appendices (6.7 %; Fig. 7K, O) and laterally attached sporangiophores (22.4 %; Fig. 7B, E, N–O) commonly observed. dimensions of six isolates of P. tubulina averaging 51.6 ± 9.8 x 37.3 ± 7.0 µm (overall
range 29.5–98.5 x 19.0–59.0 µm) with a range of isolate means of 43.5–58.0 x 31.0–45.0 µm; length/breadth ratio 1.4 ± 0.18 with a range of isolate means of 1.27–1.49; sporangial germination directly (Fig. 7R) or more often indirectly with zoospores discharged through an exit pore 4.0–9.0 µm wide (av. 6.4 ± 1.2 µm) (Fig. 7S). Zoospores limoniform to reniform whilst motile, becoming spherical (av. diam = 11.7 ± 1.8 µm) on encystment. Swellings subglobose to liminoform, often catenulate and with radiating hyphae, infrequently produced on sporangiophores (Fig. 7M, T–U). Chlamydospores not observed.
Oogonia, oospores, antheridia and hyphae (Fig. 8A–S): Gametangia readily produced in single culture by all isolates of P. tubulina on V8A within 10 d. Oogonia borne terminally or laterally, with smooth walls and tapering, often long bases (on av. 53.2 %; Fig. 8A–E, G, K); globose to subglobose (35.8 %; Fig. 8A), elongated to tubular (59.2 %; Fig. 8B-K) or excentric (5 %; Fig. 8L); diameters averaging 29.2 ± 4.4 µm (overall range 16.5–42.5 µm and range of isolate means 25.4–30.1 µm). Oogonial length 44.8 ± 11.6 µm; tubular viable oogonia (Fig. 8A–J) up to 109.0 µm long, aborted tubular oogonia (Fig. 8M–Q) reaching lengths of 300.0 µm. Oospores with a mean diameter of 26.1 ± 3.7 µm (total range 16.0–36.5 µm), plerotic or aplerotic, usually globose (89 %) or less frequently elongated (11 %) assuming the shape of the elongated or excentric oogonium (Fig. 8E–H). Some oogonia with two oospores of which one was usually aborted (Fig. 8J). Oospores with medium-thick walls (2.0 ± 0.6 µm) and a mean oospore wall index of 0.38 ± 0.08; containing either one large ooplast (Fig. 8A–D) or several smaller lipid vacuoles (Fig. 8E–H); abortion high (on. av. 72.3 %; 40–91 %) occurring either before (Fig. 8M–Q) or after the formation of the oospore (Fig. 8F, J–L). Antheridia exclusively paragynous (Fig. 8A–Q) averaging 14.9 ± 3.1 x 10.9 ± 1.7 µm, with shapes ranging from subglobose to club-shaped. Primary hyphae often branching in a mono- or dichasium with the mother hypha ending in a short protruding tip (Fig. 8R–S). Cultures (Figs 11, 13): Colonies of all five P. tubulina isolates similar on the four different types of media (Fig. 11); largely submerged with limited felty aerial mycelium around the inoculum plug on all four agar media, uniform on CA and V8A, and irregular to dendroid on PDA; almost no growth on MEA. Temperature–growth relations on V8A are shown in Fig. 13. All isolates with identical cardinal temperatures and similar growth rates at all temperatures. The maximum growth temperature was between 25 and 30 °C. All isolates with slow growth, unable to grow at 30 °C and not resuming growth when plates incubated for 5 d at 30 °C were transferred to Fig. 7. Phytophthora tubulina (CBS 141212 — ex-type), structures formed on V8 agar flooded with soil extract. A–L, N–S. Sporangia. A.
Papillate ovoid. B. Papillate obpyriform with laterally attached sporangiophore, on a short lateral hypha. C. Papillate mouse-shaped with curved
apex. D. Papillate subglobose. E. Papillate distorted with laterally attached sporangiophore. F–G. Papillate obpyriform with beak-like, curved (G)
apex. H. Bipapillate. I. Tripapillate. J. Semipapillate, elongated ovoid. K. Nonpapillate ovoid with hyphal extension. L. Nonpapillate intercalary. M. Subglobose catenulate hyphal swellings. N. Papillate, ovoid intercalary sporangium and papillate subglobose sporangium. O. Nonpapillate
ovoid sporangium with short hyphal extension (arrow head), shedding (arrow) from short lateral hypha. P. Subglobose to ovoid, papillate
sporangium with constriction of sporangiophore. Q. Bipapillate detached sporangium. R. Direct germination of papillate ovoid sporangium. S.
Empty obpyriform sporangium after release of zoospores, with beak-like apex, narrow exitpore and conspicuous basal plug. T. Branching of
AR
AR
TICLE
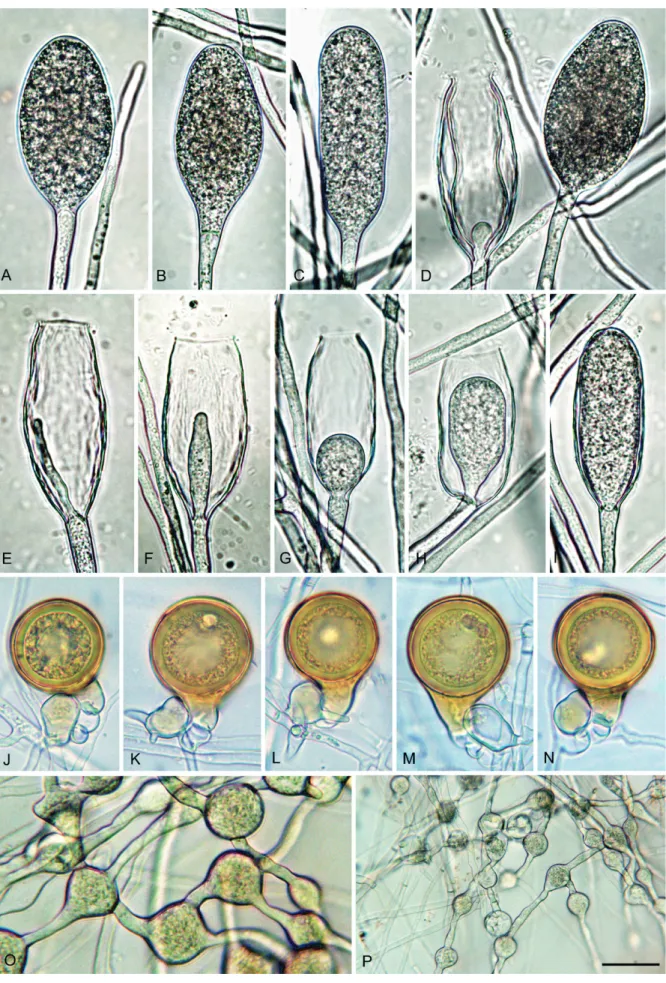
Fig. 8. Phytophthora tubulina (CBS 141212 — ex-type), structures formed in solid V8 agar. A–H. Mature oogonia with paragynous antheridia,
formed in single culture. A. Subglobose with tapering base and aplerotic, globose thick-walled oospore. B–C. Elongated ellipsoid with tapering
bases and aplerotic, globose thick-walled oospores. D. Elongated pyriform with tapering base and aplerotic, globose thick-walled oospore. E. Elongated tubular with tapering base and plerotic, elongated tubular, thick-walled oospore. F–G. Elongated excentric with almost plerotic
elongated oospores containing two ooplasts. H. Elongated tubular containing a globose, viable thin-walled oospore. I. Elongated tubular
containing a subglobose, viable thin-walled oospore and a second, ellipsoid aborted oospore (arrow). J–L. Oogonia aborted after oospore
formation. J. Elongated tubular. K. Elongated pyriform. L. Excentric. M–Q. Extremely elongated, tubular oogonia, aborted before oospore
formation, with paragynous antheridia (arrows). R–S. Primary hyphae branching in a dichasium (R) or monochasium (S) with the mother hypha
AR
TICLE
20 °C. Phytophthora tubulina had a broad growth optimum between 15 and 25 °C with an average radial growth rate of 2.8 ± 1.1 mm/d at 20 °C.
Additional material examined: Austria: Lower Austria: Dunkelsteiner Forest, isolated from rhizosphere soil of a mature Fagus sylvatica tree, Sept. 2010, T. Jung (CBS 141213 = TUB2, TUB3, TUB4, TUB5).
Phytophthora tyrrhenica B. Scanu, S.O. Cacciola,
Seddaiu, Bakonyi & Jung,
sp. nov.
MycoBank MB819700
(Fig. 9)
Etymology: Name refers to the origin of all known isolates in the Tyrrhenian islands Sardinia and Sicily (tyrrhenica Lat., Tyrrhenian).
Diagnosis: Phytophthora tyrrhenica is distinguished from its closest relatives P. uliginosa and P. vulcanica by the exclusive production of elongated and mostly ellipsoid sporangia, and from P. vulcanica also by the absence of amphigynous antheridia.
Type: Italy: Sardinia; Tergu, isolated from rhizosphere soil
of a mature Quercus ilex tree, May 2012, B. Scanu (CBS H-22984–holotype, dried culture on V8A; CBS 142301 = PH154–ex-type culture). ITS and cox1 sequences GenBank KU899188 and KU899343, respectively.
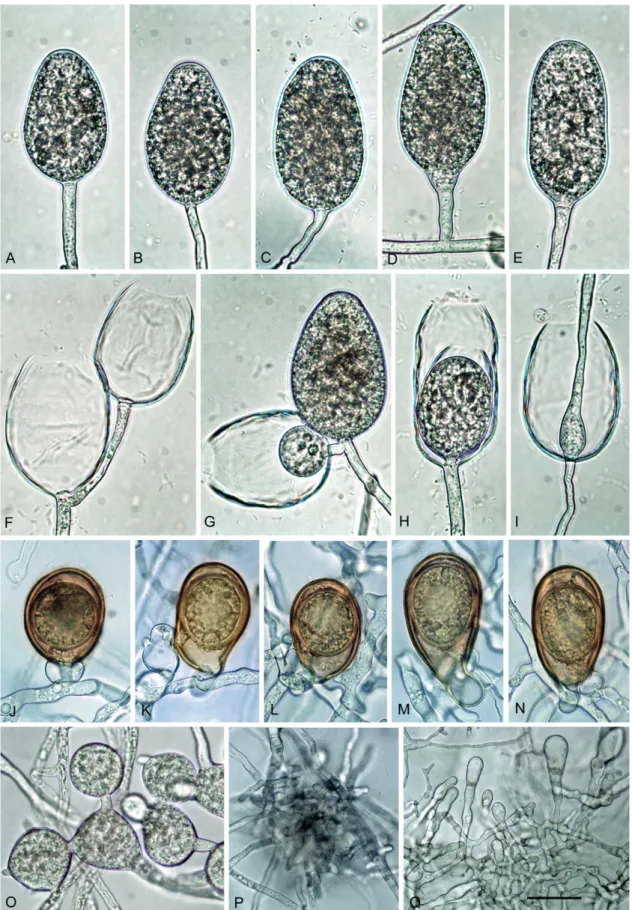
Description: Sporangia, hyphal swellings and chlamydospores (Fig. 9A–I): Sporangia not observed on solid agar but produced abundantly after 24 h in non-sterile soil extract; borne terminally on unbranched sporangiophores, non-caducous, and non-papillate (Fig. 9A–I); ellipsoid to elongated ellipsoid (55.6 %; Fig. 9A, C, I), limoniform to elongated limoniform (18 %; Fig. 9B), ovoid to elongated ovoid (18.8 %; Fig. 9D) and elongated obpyriform (7.6 %); sporangial proliferation usually internal, mainly in a nested (Fig. 9D, F-J) but also extended way (Fig. 9E); dimensions of five isolates 68.4 ± 1.7 x 28.9 ± 1.9 µm (overall range 45.5–110.0 x 16.0–39.5 µm and range of isolate means 66.1–70.0 x 27.5–31.9), with a length/breadth ratio of 2.4–0.18 and a range of isolate means of 2.1–2.57. Zoospores discharged through an exit pore 9.0– 22.0 µm wide (av. 12.1 ± 2.4 µm) (Fig. 9E–H), limoniform to reniform whilst motile, becoming spherical (av. diam = 14.6 ± 2.3 µm) on encystment; cysts usually germinating directly by forming a hypha but diplanetism also observed in all isolates. Catenulate, intercalary, globose to subglobose or irregular hyphal swellings (Fig 9O, P) with an average diameter of 18.6 ± 6.5 µm abundantly produced by most isolates in liquid culture. Chlamydospores not observed.
Oogonia, oospores and antheridia (Fig. 9J–N): Oogonia produced by all five isolates of P. tyrrhenica in single culture on V8A; borne terminally or laterally with globose to subglobose (93.3 %; Fig. 9I–N; P) or slightly excentric (6.7 %; Fig. 9O) shapes, often with a tapering base (52.3 %; Fig. 9I–L, N–P). Oogonial diameters 37.2 ± 3.3 µm (overall range 25.0–39.5 µm and range of isolate means 26.6–44.1 µm). Oospores plerotic, globose and usually containing a large ooplast (Fig. 9J–N); mean diameter 33.7 ± 1.3 µm (total range 24.5–
40.0 µm), thick walls (av. 2.9 ± 1.5 µm, total range 1.5–4.5 µm), with a mean oospore wall index of 0.41 ± 0.03. Mean oogonial abortion rate low (5 %). Antheridia formed terminally or laterally (Fig. 9M), exclusively paragynous, averaging 16.9 ± 4.6 x 12.8 ± 0.13 µm, with shapes ranging from clavate, globose to subglobose.
Cultures (Figs 12–13): Colonies uniform with dense-felty to woolly aerial mycelium and regular margin on CA and V8A, and uniform appressed on PDA. All isolates with very limited and irregular growth on MEA (Fig. 12). Temperature-growth relations are shown in Fig. 13. All five isolates included in the growth test with similar growth rates and cardinal temperatures. Maximum growth temperature was 25–30 °C; all isolates resuming growth when plates incubated for 5 d at 30 °C were transferred to 20 °C. Average radial growth rate at the optimum temperature of 20 °C 1.5 ± 0.3 mm/d.
Additional material examined: Italy: Sicily; Madonie mountains, isolated from rhizosphere soil of mature Quercus ilex trees, May 2015, T. Jung (TYR1, TYR2, TYR3, TYR4, TYR5, TYR6); Sardinia; Tergu, isolated from rhizosphere soil of a mature Q. ilex tree, May 2012, B. Scanu (PH155); Sardinia; Alà dei Sardi, isolated from rhizosphere soil of a mature Quercus suber tree, June 2012, B.
Scanu and S. Seddaiu (CBS 142303 = PH103).
Phytophthora vulcanica T. Jung, M. Horta Jung,
Scanu, Bakonyi & Cacciola,
sp. nov.
MycoBank MB819702
(Fig. 10)
Etymology: Name refers to the origin of all known isolates from volcanic soil (vulcanica Lat., volcanic).
Diagnosis: Phytophthora vulcanica differs from its closest relatives P. uliginosa and P. tyrrhenica by the production of both paragynous and amphigynous antheridia, by its low optimum temperature of 15 °C and by slower growth rates at 15 and 20 °C.
Type: Italy: Sicily; Mount Etna, isolated from rhizosphere soil
of a mature Fagus sylvatica tree, May 2013, T. Jung (CBS H-22556–holotype, dried culture on V8A; CBS 141216 = X3a–ex-type culture). ITS and cox1 sequences GenBank MF036209 and MF036287, respectively.
Description: Sporangia, hyphal swellings and chlamydospores (Fig. 10A–I): Sporangia not formed on solid agar but produced in sterile soil extract; caducous and non-papillate with a flat apex (Fig. 10A–E, G); borne terminally, on unbranched sporangiophores or in lax sympodia, or less frequently laterally (Fig. 10D), proliferating internally in both a nested (Fig. 10G, H) and extended way (Fig. 10I). Sporangiophores often branching close to the sporangial base forming lax sympodia (Fig. 10F–G). Sporangial shapes ovoid (52.5 %; Fig. 10A–B, F–G, I), elongated ovoid (14.0 %; Fig. 10C), ellipsoid to elongated ellipsoid (32.5 %; Fig. 10E–F, H) or less frequently limoniform (Fig. 10D), pyriform and obpyriform (1.0 %); dimensions of six isolates 57.3 ± 8.7 x 34.5 ± 4.2 µm (overall range 35.5–81.0 x 22.5–43.0 µm)
AR
TICLE
Fig. 9. Phytophthora tyrrhenica (CBS 142301 — ex-type). A–I. Sporangia formed on V8 agar (V8A) flooded with soil extract. A–D. Nonpapillate
with flat apex. A. Ellipsoid. B. Limoniform with tapering base. C. Elongated ellipsoid. D. Mature ovoid (right) and empty with wide exit pore and
internal nested proliferation (left). E–I. Empty with wide exit pores and internal extended (E) or internal nested proliferation (F–I). J–N. Mature,
golden-brown, smooth-walled, globose oogonia formed in single culture in V8A, containing thick-walled plerotic oospores with big ooplasts, with paragynous antheridia. K–L. Antheridia with finger-like hyphal extensions. O–P. Globose, limoniform and angular catenulate hyphal swellings