Cite as: J. Chem. Phys. 150, 144903 (2019); https://doi.org/10.1063/1.5090104
Submitted: 24 January 2019 . Accepted: 11 March 2019 . Published Online: 09 April 2019 Lorenzo Caprini, Fabio Cecconi , and Umberto Marini Bettolo Marconi
ARTICLES YOU MAY BE INTERESTED IN
Response of active Brownian particles to shear flow
The Journal of Chemical Physics 150, 144111 (2019);
https://doi.org/10.1063/1.5086495
Chemical Physics of Active Matter
The Journal of Chemical Physics 151, 114901 (2019);
https://doi.org/10.1063/1.5125902
Fluctuation-dissipation in active matter
Transport of active particles
in an open-wedge channel
Cite as: J. Chem. Phys. 150, 144903 (2019);doi: 10.1063/1.5090104Submitted: 24 January 2019 • Accepted: 11 March 2019 • Published Online: 9 April 2019
Lorenzo Caprini,1 Fabio Cecconi,2 and Umberto Marini Bettolo Marconi3
AFFILIATIONS
1Gran Sasso Science Institute (GSSI), Via F.Crispi 7, I-67100 L’Aquila, Italy 2Istituto dei Sistemi Complessi (CNR), Via Taurini 19, I-00185 Roma, Italy
3Scuola di Scienze e Tecnologie, Università di Camerino, Via Madonna delle Carceri, I-62032 Camerino, Italy
ABSTRACT
The transport of independent active Brownian particles within a two-dimensional narrow channel, modeled as an open-wedge, is studied both numerically and theoretically. We show that the active force tends to localize the particles near the walls, thus reducing the effect of the entropic force which, instead, is prevailing in the case of passive particles. As a consequence, the exit of active particles from the smaller side of the channel is facilitated with respect to their passive counterpart. By continuously re-injecting particles in the middle of the wedge, we obtain a steady regime whose properties are investigated in the presence and absence of an external constant driving field. We characterize the statistics and properties of the exit process from the two opposite sides of the channel, also by making a comparison between the active case and passive case. Our study reveals the existence of an optimal value of the persistence time of the active force which is able to guarantee the maximal efficiency in the transport process.
Published under license by AIP Publishing.https://doi.org/10.1063/1.5090104
I. INTRODUCTION
In the last years, the theoretical study of self-propelled microswimmers has become an important research area at the cross-roads between biology, mathematics, and physics. These systems are ubiquitous in nature, typical examples being bacteria,1 protozoa,2 spermatozoa,3 living tissues,4and actin filaments,5to mention just a few. On the other hand, bioengineers and physicists are develop-ing techniques to create artificial self-propelled objects, as in the case of the so-called Janus particles.6,7
The common feature of active particles is the existence of a self-propelling mechanism converting the environmental energy into motion.8–11 The nature of such propulsion varies from one microswimmer to another but in general determines a ballistic motion at short spatial and temporal scales and a diffusive motion at larger scales.
In order to describe the behavior of such systems, different the-oretical models have been developed; among them, we recall (a) the Run&Tumble (R&T) model,12–14where the microswimmers alter-natively perform at a given rate ballistic displacements and tumbles, i.e., random changes in the orientation of their velocity. (b) A con-tinuous model with a Langevin-like dynamics, the so-called active
Brownian particle (ABP) model9,15 described in detail in Sec. II. (c) The active Ornstein-Uhlenbeck particle (AOUP) model.16–18All these models show an intriguing phenomenology ranging from par-ticle accumulation near the walls of a container19–25 to the exis-tence of non-Boltzmann probability distributions26–28 also in the presence of acoustic traps,29,30the appearance of negative mobility in the presence of non convex potentials,31 and motility induced phase separation (MIPS),32–38in the case of interacting active par-ticles. The influence of geometrical constraints on the motion of active particles is a less explored and only partly understood issue, in spite of its importance in elucidating how some systems of bio-logical interest behave. For instance, living bodies harbor colonies of bacteria normally localized in the skin, external mucosae, gas-trointestinal tracts, etc. These bacteria, by crossing narrow constric-tions, are able to invade/infect the hosts’ internal tissues that instead need to remain sterile.39How this passage occurs is a problem of great relevance for evident reasons, especially in cases of pathogen infections.
In the framework of R&T modeling, first-passage properties have been studied both with40and without41,42thermal noise for a one-dimensional channel, whereas the same problem was numeri-cally studied for a one-dimensional version of the ABP-model43and
in two-dimensional corrugated channels in Refs. 44and45. In a similar context, a Fick-Jacobs transport equation46accounting for the channel geometry via an entropic effective force47–49has been proposed for weakly active particles.50
In the present paper, we idealize the motion of bacteria by means of ABP and model the pore as a narrow wedge-shaped capil-lary. At variance with previous studies, we investigate how the first-passage process of an ABP through a narrow constriction depends on the activity parameters as well as the geometry. The distribution of the escape events has been addressed by several authors;31,51–53 in this work, we focus on the general features of escape process, in particular, comparing the efficiency of “active” transport with the Brownian transport.
The paper is organized as follows: in Sec.II, we introduce the model, while in Sec.III, the steady-state properties of active particles in the channel are discussed, including the density along the trans-port direction and the density along a section of the pore. In Sec.IV, we study the escape-time statistics showing how the efficiency of the active transport depends on the active force. Finally, we summarize the main results in the Conclusions section.
II. MODEL OF ACTIVE PARTICLES IN OPEN WEDGE-GEOMETRY
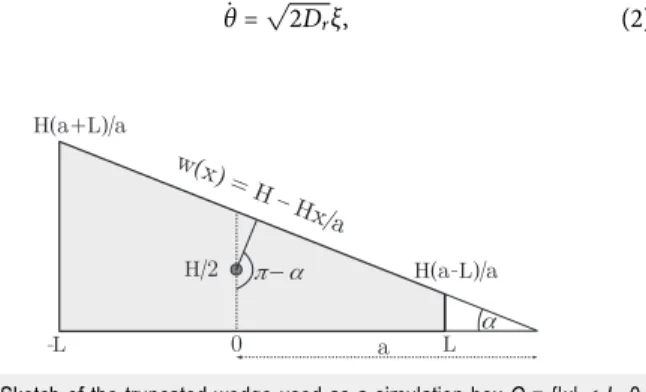
We consider an assembly of independent active particles immersed in a viscous solvent and constrained to move in the two dimensional truncated-wedge channel shown inFig. 1. We neglect the inertial effect and consider the over-damped dynamics of the particles, where the position of each particle, r, moves according to the following stochastic differential equation:
γ˙r = F(r) + 𝜖ˆx + γU0ˆe(t), (1)
where F is an external force and 𝜖ˆx is a drift along the channel axis representing a systematic bias associated with a drag or a biologi-cal bias toward positive x. The constant γ is the friction coefficient. The last term of Eq.(1)represents the ABP self-propulsion mecha-nism, namely, a force of fixed strength, γU0, and varying orientation,
ˆe(t) = (cos θ(t), sin θ(t)), whose angle θ(t) evolves according to the following Wiener process:
˙θ =√2Drξ, (2)
FIG. 1. Sketch of the truncated wedge used as a simulation box Q = {|x|≤ L, 0
≤ y ≤ w(x)}, bounded by the lines y = H − Hx/a and y = 0. Absorbing conditions are placed at x =±L, for which the particles crossing x = ±L are removed from the system. The black circle, centered in (0, H/2), marks the narrow region where particles are either initially emitted or re-injected after their absorption.
where the constant Dr is the rotational diffusion coefficient and ξ
is a white noise with zero average and unitary variance. As sev-eral experimental studies indicate,54 the influence of the thermal agitation of the solvent surrounding the microswimmers can be neglected.55
The particles are confined to the domain Q = {(x, y) : |x| ≤ L, 0 ≤ y < w(x)} bounded by the bottom of the open-wedge channel at y = 0 and by its upper boundary
w(x) =H
a(a − x). (3)
The left and right vertical boundaries, at x = ±L, are absorbing, while both boundaries are soft reflecting walls (no-flux boundaries). More-over, we are interested in the narrow channel condition: H ≪ L. The top wall exerts on the particles a force directed along its nor-mal direction n = (w′(x), −1)/√1 + w′(x)2, whereas the repulsion
of the bottom wall is directed along ˆy = (0, 1). To represent this force, we introduce a wall-potential V (u) = V0/m(σ/u)m, where V0
defines its energy scale and σ its length-scale assumed to be small with respect to H, L and write
F = −V′(w(x) − y) n − V′(y) ˆy, (4) where the prime represents the derivative with respect to the argu-ment u. The form of the force (4)determines specular reflection when particles “collide” with the walls. To prevent excessive pene-tration, the functional form of V must guarantee strong repulsion when evaluated at y = w(x) and y = 0 and thus we assume σ to be at least ∼10−2H and V0= 1, m = 4.
In the numerical simulations, the particles are initially placed in a small neighborhood of the point P = (0, H/2) (seeFig. 1), mimick-ing the injection by means of a “micro-pipette,” and eventually leave the pore at the L and −L boundaries. A stationary process is achieved by reinserting these particles at the point P. Correspondingly, the direction of the active force acting on the re-injected particles is obtained from a uniform distribution of angles θ in the interval [0, 2π]. The evolution of N = 104particles is obtained by integrat-ing Eq.(1)with a Euler-Maruyama algorithm,56at least up to time T ∼ 103/D
r. Throughout the paper, the geometry will be fixed such
that H = 10, L = 80, and a = 100, which guarantees the condition H ≪ L.
We begin our analysis by first discussing how the particle dis-tribution over the domain Q influences the escape properties when Dris varied.
A. Case 𝝐 = 0
InFig. 2, we display three snapshots of particle configuration at increasing values of DrL/U0, in the absence of an external force.
Panels (a) and (b) clearly show thin denser stripes near both the upper and lower wall, indicating the tendency of strongly active par-ticles to “climb on” confining edges. With the growth of DrL/U0, the
accumulation at walls decreases from (a) to (b) till almost vanishing in (c).
The particle distribution is inhomogeneous and characterized by peaks at the walls57–59whose height is controlled by the persis-tence time of the force orientation, ta= 1/Dr.20Indeed, the larger ta,
the greater is the time spent by a particle in the proximity of the wall and the larger the accumulation.60In the limit of small persistence
FIG. 2. Snapshots of particle configurations, upon re-injection at the site(0, H/2), for different values of the parameter DrL/U0in the absence of field 𝜖= 0. Panels (a), (b),
and (c), showing a different degree of particle accumulation to the walls, are obtained with DrL/U0= 2.6× 10⁻², 1.3× 10, 2.7 × 10², respectively. Other system parameters
are L = 80, a = 100, H = 10, and U0= 3.
time (Dr≫γ), the accumulation becomes negligible and the parti-cles’ behavior is quite similar to the Brownian one, with an effective temperature T = γU20/2Dr.15,32,61,62
To characterize the accumulation degree, we report inFig. 3
the conditional probability distribution function (pdf), p(y|x), at two selected vertical sections centered at x = ±L/2. The conditional pdf ofFig. 3(a), corresponding to the snapshot (b) inFig. 2, displays a bimodal behavior with well pronounced peaks due to a marked accu-mulation of particles at the walls. The bulk distribution, between the peaks, is not uniform, indicating that the activity not only promotes the accumulation at the boundaries but also influences the bulk. It is also apparent that the bulk-density is smaller than the density of
FIG. 3. Conditional probability distribution functions, p(y|x), evaluated at x = L/2
(blue line) and x =−L/2 (red line). Panels (a) and (b) are obtained for DrL/U0
= 1.3× 10, 2.7 × 10², respectively. System parameters are L = 80, a = 100, H = 10,
𝜖= 0, and U0= 3.
the Brownian system counterpart [Fig. 3(b)]. This picture is in a qualitative agreement with the prediction of Malgaretti and Stark.44 When Drbecomes larger enough to determine the approach to the
Brownian-like regime, seeFig. 3(a)referring to the snapshots (c) in
Fig. 2, the peaks become strongly depleted, and p(y|x) turns to be flat in the bulk, as a consequence of a fast transversal homogenization.
The accumulation also depends on the persistence length, λa= U0/Dr, roughly the typical length-scale after which particles
change the direction. Indeed, the comparison between λaand the
geometrical sizes H and L of the channel,Fig. 1, unveils the interplay between surface and bulk properties and allows three main regimes to be identified:
(i) The regime H ≪ L ≪ λa, where particles move ballistically in
all directions [Fig. 2(a)] and the majority of them lay in the proximity of the two walls, eventually sliding along them. (ii) In the regime H ≪ λa ≪ L, a diffusive effective motion
emerges along the axis channel, while the transversal motion is characterized by rebounds between the walls. The snap-shot (b) of Fig. 2 shows that under this condition, the accumulation reduces and is no longer dominant.
(iii) The regime λa≪H, where the persistence length is smaller than any geometrical scale. As shown inFig. 2(c), the phe-nomenology is similar to the one of a Brownian system at an effective temperature, T = γU02/2Dr.
FIG. 4. Ratio Nw/(N− Nw) between the number of particles accumulating at the
walls and the remaining ones in the bulk, as a function of Dr. The inset is a blow-up
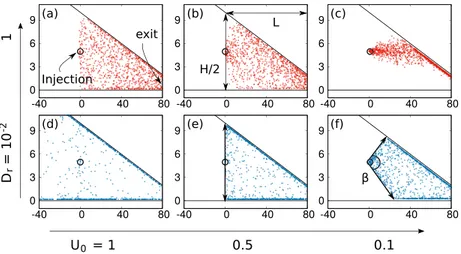
FIG. 5. Snapshots of particle positions in
the presence of a field 𝜖 = 0.5 at dif-ferent U0and Dr. Panels (a), (b), and
(c) refer to values U0= 1.0, 0.5, 0.1 and
the same Dr= 1.0, while panels (d), (e),
and (f) are obtained with the same set of U0but a value Dr= 0.01. Black lines
represent the walls, and the gray circle centered at (0, 5) is the area where parti-cles are re-injected when they cross the right exit at x = L = 80. The remaining parameters are a = 100 and H = 10.
As a quantitative measure of accumulation, we plot inFig. 4
the fraction Nw/(N − Nw) vs Dr, by counting the particles contained
in the stripes, parallel and adjacent to each boundary, of transversal size σ. This ratio exhibits a monotonic decreasing behavior with Dr
toward the Brownian limit, further indicating that the increase in Dr
depresses the accumulation at the wall. B. Case 𝝐 > 0
We now discuss the case where an external force of strength 𝜖pushes the particles toward the right. At variance with the case without drift, U0plays a fundamental role as it combines with the
drift 𝜖/γ. We vary U0, keeping 𝜖 = 0.5, and explore the two regimes
γU0≥𝜖and γU0<𝜖, at different values of Dr.
InFig. 5, we show six snapshots of particle configurations at different values of Dr and U0. Panels (a)–(c) referring to Dr = 1.0
and U0= 1, 0.5, and 0.1 show a Brownian-like behavior with the
effective temperature, T = γU02/2Dr. In this regime, the Brownian
fluctuations are not able to counteract the effect of the bias so that no particle can escape on the left.
As shown inFigs. 5(a)and5(b)when 𝜖 ≲ γU0, the particles may
fill vertically the whole sector x > 0 of the channel, whereas in the opposite regime (𝜖 ≳ γU0), the drift prevails over diffusion creating
a sort of “plume” toward the right exit, as illustrated inFig. 5(c). The persistent case Dr = 0.01 is shown in panels (d)–(f). In
panel (d), the particles can explore the whole channel despite the bias; on the contrary, when the ratio γU0/𝜖 decreases, the bias
pre-vails, and particles injected at the point P can only explore angles β such that
∣β∣ ≤ tan−1( 𝜖 U0
);
see panels (e) and (f). Such a condition is obtained by assuming a less favorable case where the active force has only the y-component; thus, ˙x = 𝜖, ˙y = ±U0.
III. DISTRIBUTION ALONG CHANNEL AXIS
A successful approximation often employed in the study of the transport of passive particles in narrow channels with non-uniform section is represented by the so-called Fick-Jacobs approach.46,47,49 It amounts to reducing the multidimensional process to a
one-dimensional diffusion in the effective potential encoding the channel geometry. Such an approximation is valid whenever the sys-tem reaches a steady distribution in the transversal section on a time scale much shorter than the typical time of the process along the channel axis.48,63,64To what extent this homogenization approach is valid for active particles is not clear. Our results show that transver-sal homogenization is not fulfilled when Dr <γ because persistent values of the active force favor the accumulation at the walls. In this respect, we numerically study the stationary marginal probability distribution, pst(x), along the channel axis,
pst(x) = 1
w(x)∫
w(x)
0 dyPst(x, y), (5)
obtained from the two-dimensional distribution Pst(x, y). Notice
that the existence of a stationary state is a consequence of the re-injection that replaces the particles exiting from the boundaries x = ±L. The numerical pst(x) are reported inFig. 6(a)in the absence
of bias and inFig. 6(b)in the presence of bias, 𝜖, for different values of Dr.
For 𝜖 = 0, panel (a), we observe an asymmetry with respect to the center of the channel (x = 0) reflecting the narrowing of the sec-tion w(x). Indeed, the slant of the upper wall generates an “entropic” drift favoring a larger occupation of the side x < 0. This entropic effect is more evident for large Dr and maximal in the Brownian
limit characterized, up to a normalization constant, by a distribution (dashed black line)
pst(x) = ⎧ ⎪ ⎪ ⎪ ⎪ ⎪ ⎪ ⎨ ⎪ ⎪ ⎪ ⎪ ⎪ ⎪ ⎩ A(a − x) ln (a + L a − x) x ∈ [−L, 0] B(a − x) ln (a − x a − L) x ∈ [0, L] , (6)
predicted by a Fick-Jacobs approach46,48,49that is discussed in detail in theAppendix. A, B are two coefficients depending on the geome-try parameters, a, L, H.
It is interesting to remark that formula (6)remains reason-ably applicable to active particles up to values around Dr = 1. At
FIG. 6. Stationary marginal space probability distribution, pst(x), at different values
of Dr. Panel (a) refers to𝜖= 0, panel (b) refers to𝜖> 0; dashed lines represent the
Brownian predictions: Eq.(6)for𝜖= 0 and Eq.(7)for𝜖> 0. System parameters
are L = 80, a = 100, H = 10, and U0= 3.0.
trajectories and consequently, the distribution becomes more sym-metric; it also develops a narrow peak near x = 0, more and more pronounced as Dris reduced. This over-crowding of the region near
x = 0, absent in the Brownian case, is a combined effect of re-injection and persistence that determines the accumulation of the particles pointing toward the walls.
As shown inFig. 6(b), a constant field 𝜖 = 0.5 overwhelms the “entropic” drift and determines a larger density in the region x > 0. Even in this case, the shape of pst(x) is strongly influenced by the
activity, and again the large Dr range recovers the Brownian-like
profile pst(x) ∝ eεx(a − x) ⎧ ⎪ ⎪ ⎪ ⎪ ⎪ ⎪ ⎪ ⎨ ⎪ ⎪ ⎪ ⎪ ⎪ ⎪ ⎪ ⎩ A(Ei[ε(a + L)] − Ei[ε(a − x)]) x ∈ [−L, 0] B(Ei[ε(a − x)] − Ei[ε(a − L)]) x ∈ [0, L] , (7)
which is also derived in theAppendix. In expression(7), we set ε = γ𝜖/T (with T = γU20/2Drmeant as an effective temperature) and
Ei[. . .] denotes the exponential integral function (cf. pp. 661–662 of Ref.65).
We conclude by remarking that in the strong activity regime [blue and green curves inFigs. 6(a)and6(b)], the active force is able to shadow both the entropic and the bias effects, thus leading to a symmetrization of the profiles.
In Sec. IV, we see how the accumulation mechanism of the particles to the walls strongly affects the escape process.
IV. ESCAPE PROCESS OF ACTIVE PARTICLES FROM THE WEDGE
We study numerically the escape statistics from the wedge, Q, for the ensemble of particles initially injected in the neighborhood of (0, H/2). We define the left and right first passage times, τL,R, as
the first time at which a given particle leaves Q either from the left or from the right boundary,
τL=min
t {0 < t ≤ Tw∣x(t) < −L}, (8)
τR=min
t {0 < t ≤ Tw∣x(t) > L}, (9)
within a given simulation time window [0, Tw]. A convenient choice
is Tw∼104/Drto allow all the particles to exit in a reasonable
sim-ulation time. We investigate the three different dynamical regimes discussed in Sec.IIand obtain numerically the exit-time distribu-tions, ΨL,R(τ), by the histogram method. We start discussing the
results in the case of no drift, 𝜖 = 0, and then we consider the driven system, 𝜖 > 0, using the Brownian case as a reference.
A. Active escaping time at 𝝐 = 0
Figure 7reports the distributions of first exit times, Ψ(τ), at different values of Dr.
When λa ≪ H ≪ L, the majority of the particles spread in the bulk and their behavior is hardly distinguishable from the one of a swarm of Brownian particles with temperature γ U02/2Dr.
FIG. 7. Escape time distribution, Ψ(τ), for 𝜖 = 0, computed at selected values of Drin the range [2× 10⁻³, 5], see the legend. Plots have been split in two panels for
readability reasons: panel (a) refers to the range [2× 10⁻³, 5× 10⁻²] while panel
(b) to the range [0.1, 5.0]. Other used parameters are L = 80, a = 100, H = 10, and
Accordingly, Ψ(τ) is very similar to the escape time distribution of Brownian particles from the wedge.
When the persistence length is H ≪ λa≪ 2L, the situation changes because (i) a large fraction of particles spend much time stuck to the up and bottom boundary and (ii) the vertical component of the particle velocity behaves quite “deterministically” producing a bouncing ball effect between the upper and lower boundaries that lasts for a period of the order of the persistence time,60ta∼1/Dr. As
a result of the “stickiness” of the walls, we observe a sort of dimen-sional reduction which confers to Ψ(τ), a shape strongly deviating from the corresponding Brownian distribution. At first, as seen in bothFigs. 7(a)and7(b), a pronounced asymmetry of Ψ(τ) occurs, characterized by the emergence of a fat tail at larger times and a rather steep shoulder at shorter times.
In the regime H ≪ L ≪ λa, particles strongly accumulate along
the walls which act as trails guiding the particles to the left or right exit, in a time roughly given by td∼L/U0. As a consequence, the
escape problem reduces to the combination of two one-dimensional escape processes, each occurring along one of the walls. Accordingly, the exit-time distribution becomes extremely peaked near td. The
possibility of escaping within tdclearly depends on the initial
ran-dom orientation of the active force at the injection point. In this respect, we can classify the particles into two groups: group A is formed by particles with an initial direction allowing them to leave the channel in a time, t ∼ td, either to the left or to the right, without
changing the direction. Instead, group B contains particles chang-ing the direction at least one time before they reach one of the exits at a larger time. The particles belonging to A, arriving quite at the same time td, contribute to the peak in Ψ(τ), while the arrivals of
the particles of group B contribute to the long tails. In this regime, the decrease in Dr produces higher and thinner spikes and longer
tails.
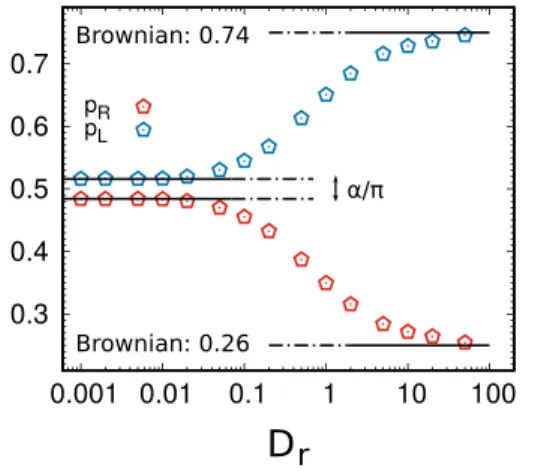
We plot in Fig. 8the right and left escaping probability, pR,
pL= 1 − pR, respectively, obtained by measuring the fraction of exit
events from the right and from the left in a long simulation. We see that pRand pL show a clean monotonic behavior as a function of
Dr, converging to two different plateaus for Dr →0 and Dr → ∞,
respectively. The plateau for Dr≫γ (Brownian regime) is given by
FIG. 8. Dependence of the left/right escape probabilities, pLand pR, on Dr. Black
lines indicate the two limiting plateaus: the Brownian prediction from Eq.(10)and the infinite-τ prediction given by Eq.(11).
the expression pR= ln(a + L) − ln a ln(a + L) − ln(a − L)= ln(1 + µ tan α) ln(1 − µ tan α 1 + µ tan α) , (10)
where µ = L/H and α is the wedge angle; seeFig. 1. The derivation of the above expression can be found in theAppendix; specifically see Eq.(A10).
Notice that in the Brownian case, there is no temperature dependence. For H = 100 and L = 80, Eq.(10)provides the value pR≃0.2675 which agrees with the simulation value. In this case, pL
is much less than pR, due to the obvious action of the entropic “drift”
produced by the wedge geometry which favors the exit to the larger left side. This scenario remains valid up to values of Dr∼10.
If Drfurther decreases, pLdevelops a strong dependence on Dr,
indicating that the activity counteracts the entropic drift and facili-tates the passage through the narrow side of the channel. In practice, the particle accumulation to the walls has the effect of reducing the entropic barrier. A similar “rectifying” phenomenology has been observed for active Janus particles in periodic channels alternating two wedge compartments.66
At some value of Dr, pR(L)saturates to a value, p∗R,L
p∗L,R=π ± α
2π . (11)
Indeed, if the motion of the particles is so persistent to be considered “ballistic,” pLand pRstrongly depend on the initial re-injection
con-dition. With reference toFig. 1, we can identify two complementary intervals AR= [−π/2, π/2 − α] and AL= [π/2 − α, 3π/2], for which those active particles emitted with an initial angle either θi ∈ AR
or θi ∈ ALare bound to exit almost surely either to the left or to
the right, respectively. Equation(11)is the analog of Eq.(10)in the regime of strong persistence. Of course, a very small fraction of parti-cles always exists whose orientation prevents the exit in a time ta, but
this fraction is very small and does not affect the exit time statistics except for the short tail.
It is interesting to study the average exit time from the wedge ¯τ =∫
∞
0 dτΨ(τ)τ
as a function of the control parameters. This observable is able to quantify the transport efficiency, and it is relevant to understand if the activity favors or not the emptying of the channel.
We can define the transport efficiency as the ratio,
η = L
U0¯τ
, (12)
between the time, L/U0, at which a deterministic motion of velocity
U0gains the exit and the mean exit time ¯τ.
InFig. 9, we plot η for U0= 3 vs the dimensionless
param-eter DrL/U0. It exhibits a non-monotonous behavior reaching its
maximal value at DrL/U0≈0.3. This reveals the existence of an opti-mal Dr such that the escaping process becomes more efficient, in
the specific parameter choice Dr≃0.01. The increase in the “trans-port efficiency” can be explained by invoking a sort of “dimensional reduction.” Specifically, those particles accumulating at the walls are favored in the exit process because they use the boundaries like
FIG. 9. Efficiency, defined by Eq.(12), as a function of the dimensionless parame-ter DrL/U0, in the case of zero drift𝜖= 0. The peak is attained at Dr≈ 10−2. The
inset shows¯τ (black data) vs DrL/U0for a comparison with the Brownian result
[Eq.(13)]. Parameters: L = 80, a = 100, H = 10, and U0= 3.
trails, thus performing basically a one-dimensional motion along them. This greatly enhances the possibility to find the exit with respect to the case where particles explore the full wedge in order to escape. Reference44shows that the accumulation near the walls also depends on the hydrodynamics interactions. As a consequence, the efficiency peak inFig. 9shifts toward larger or smaller values of DrL/U0in the case of pullers or pushers, respectively.
At very small DrL/U0, however, 1/¯τ decreases as a finite fraction
of particles, in particular, those hitting normally the walls, almost remain stuck for a time 1/Dr(diverging for Dr →0), thus slowing down their escape process. Again for Dr≳γ, the system approaches a Brownian regime and ¯τ linearly increases with DrL/U0, as shown
in the inset ofFig. 9. Indeed, the effective temperature T = γU02/2Dr,
which in this case controls the Brownian-like behavior, increases with DrL/U0. The inset ofFig. 9shows also a comparison between
the numerical ¯τ and the prediction derived in theAppendixfor a Brownian particle at temperature T = γU02/2Dr,
¯τ = DrL 2 2γU2 0 (1 + a 2L ln[a2/(a2−L2)] ln[(a + L)/(a − L)]). (13)
The first term corresponds to the average exit time of a one-dimensional system of length 2L, whereas the second one is asso-ciated with the entropic barrier and reflects the asymmetry of the channel. As expected, the linear behavior of ¯τ with Drin the effective
equilibrium regime is in very good agreement with the prediction. B. Active escaping time at 𝝐 > 0
In this section, we analyze how an external driving 𝜖 modifies the previous scenario. Consistently with the concept of effective tem-perature, when Dris large enough, we expect a Brownian-like regime
and thus an exit time distribution, Ψ(τ), resembling the correspond-ing Brownian distribution at temperature γ U20/2Dr, as shown in
FIG. 10. Panels (a) and (b): escape time
distributions at different values of Drand
two different values of U0= 0.1, 1 in the
presence of an external bias𝜖= 0.5. Panel (c): dependence of1/¯τ, namely, the transport efficiency, on Dr at values U0= 0.1, 0.5, 3, and𝜖= 0.5.
Geome-try parameters are L = 80, a = 100, and
Fig. 10. In this case, Ψ(τ) is peaked around, tm∼γL/𝜖, represent-ing the time taken by particles of velocity 𝜖/γ to travel a distance L. In this regime, the reduction in U0or Dr increases the variance of
Ψ(τ). In the Brownian-like regime, the decrease in Drproduces the
enhancement of the skewness of Ψ(τ) and the emergence of long right tails.
A further decrease in Drshifts the peak of Ψ(τ) to the left and
simultaneously the right tail becomes higher, until the mean peak position pins at tm∼γL/(γU0+ 𝜖). In this regime, the reduction in
Drleads only to more pronounced peaks of Ψ(τ). Indeed, even the
particles which move ballistically toward the exit without changing their orientation (group A) cannot reach the exit within the minimal time ∼ γL/(γU0+ 𝜖). Depending on the ratio γU0/𝜖, a different
phe-nomenology occurs: (i) γU0<𝜖: a secondary peak of Ψ(τ) occurs at a value γL/(𝜖 − γU0) and finally the distribution abruptly drops down.
This secondary peak is due to the slow particles whose orientation is opposed to the x-direction where the constant force is directed. (ii) γU0>𝜖: the first peak simply becomes higher but the second vanishes.
The efficiency η of the transport for 𝜖 > 0 is defined by replac-ing U0→U0+ 𝜖 in Eq.(12), but as a matter of fact, the inverse
of the mean exit time is already an estimate of η. For this reason,
Fig. 10(c)reports directly 1/¯τ vs Dr to quantify the channel
emp-tying at three values of U0. In the case 𝜖 > γU0, the increase in Dr,
i.e., the decrease in the effective temperature, leads to a monotonic growth of 1/¯τ, until saturation is reached and the system behaves as a Brownian one. In this regime, the activity reduces the efficiency of the transport process. Indeed, although some particles travel toward the exit with more facility, also several particles move in the opposite direction, employing a long time before leaving the wedge. Clearly, the reduction effect becomes relevant only when U0is comparable
with 𝜖 (blue diamond data); otherwise, (when γU0≪𝜖) the parti-cles leave the wedge only because of the driving 𝜖 (green triangle data).
The situation is more interesting in the opposite regime, where 𝜖 < γU0. In this case, 1/¯τ reveals a non-monotonic behavior in
terms of Dr. Starting from the Brownian saturation value, a first
decrease in Drproduces a reduction in 1/¯τ, until a minimum value,
a situation resembling the previous one for 𝜖 > γU0.
Neverthe-less, a further decrease in Dr produces the increase in 1/¯τ, up to
a maximum value which reveals an increase in the transport effi-ciency for some value of Dr. This persistence maximizes the
effi-ciency of the transport process since for smaller Dr, a decrease in
1/¯τ occurs, due to the same mechanism already discussed in the case 𝜖= 0.
As a consequence, the activity can be seen as an optimization mechanism, which reduces the time employed by microswimmers to reach the exit of the channel, also in the presence of a constant driving force. A condition for this scenario implies that the activ-ity strength has to be stronger than the amplitude of the external driving.
V. CONCLUSIONS
In this work, we studied the escape process of a system of ABP particles from an open-wedge channel in the absence and in the presence of an external driving force. The comparison with the Brownian system counterpart shows that the activity facilitates the
escaping from the narrow exit and competes against the entropic force. We also found the existence of an optimum value of the persistence time which maximizes the channel emptying. The phys-ical mechanism which improves the efficiency is the effective attrac-tion exerted by the bottom and upper walls on the active particles which leads to a depletion of the inner region. The majority of the particles accumulate in a narrow region near each wall, and as a con-sequence, the section-dependent entropic force is strongly reduced. The resulting motion of the particles is effectively one-dimensional and controlled by the competition between the active force and the external field. Somehow, the activity is able to operate a sort of dimensional reduction, since it makes surface effects prevailing over the bulk properties.
The present treatment shows that the extension of the Fick-Jacobs approximation to the active case is possible only for small values of the persistent time and activity strength.50When it hap-pens, the far-equilibrium feature of active particles does not emerge and the Brownian theory with an effective temperature agrees with numerical data. On the contrary, when the active force is very per-sistent and large, our study of particle distributions shows that the main hypothesis underlying the Fick-Jacobs approximation breaks down since the density is not homogeneous in each channel section, as an effect of the accumulation near the walls. Quantifying how the effective entropic barrier is reduced by this mechanism could repre-sent an intriguing next point in understanding biological transport processes.
This work suggests that the active transport can be facilitated or even optimized by a proper design of the channel surface. This can be interpreted as further manifestation of “ratcheting mechanism” that can be observed as soon as active particles experience confining forces breaking the left-right symmetry.66
We point out that the presence of inter-particle interactions could drastically affect the transport properties in the channel. Indeed, as mentioned in the introduction, interactions could pro-mote clustering until MIPS takes place in the regime of strong active forces. Assessing the effects of MIPS on the mean exit time from the channel will certainly constitute an interesting subject for future investigations.
APPENDIX: BROWNIAN CASE
In this appendix, we describe the spreading of Brownian par-ticles distribution, P(x, t), along the axis of the channel Q in terms of the Fick-Jacobs approach.46The Fick-Jacobs theory is applicable to channels with variable sections, w(x), provided that the particle distribution attains its steady form along the y-direction on a time scale much shorter than the time scale associated with the longitudi-nal motion (transversal homogenization). However, this condition, which can be fulfilled by Brownian particles, is violated by the active particles in those regimes where accumulation to the boundaries is not negligible.
In the Brownian regimes, the strong confinement in the lateral direction allows the diffusion of the particles along the channel to be described in a quasi-one-dimensional equation
∂P ∂t +
∂J
∂x =k δ(x), (A1)
where the last two equations mathematically implement the absorb-ing boundary conditions at x = ±L. The Dirac-delta source with amplitude k accounts for the instantaneous re-injection, at x = 0, of those particles leaving the channel from the boundaries x = ±L.
The current J(x, t) = −T γe γ𝜖x/T w(x)∂ ∂x[e −γ𝜖x/TP(x, t) w(x)] (A3)
describes to a good approximation the longitudinal transport along a channel of variable section w(x) = H − Hx/a, in the presence of a constant field (bias) of strength 𝜖 acting along the channel axis. In the following, we set
D0=T γ, ε =
γ𝜖 T.
The balance between absorption and re-injection preserves the num-ber of particles and gives rise to a steady-state characterized by the equality
J(L) − J(−L) = k,
stating that the re-injection rate balances the loss fluxes at the boundaries.
The stationary distribution satisfies the equation
−D0 ∂ ∂x[w(x)e εx ∂ ∂xe −εx P w(x)] =k δ(x). (A4)
The presence of the Dirac δ(x) requires the splitting of the solution over the two domains [−L, 0] and [0, L] such that
P(x) = {A Y1(x) −L ≤ x < 0 B Y2(x) 0 ≤ x ≤ L , (A5) where Y1(x) = eεxw(x)∫ x −Ldu e−εu w(u) and Y2(x) = eεxw(x)∫ L x du e−εu w(u)
are the fundamental solutions of the homogeneous equation (k = 0) satisfying the boundary conditions Y1(−L) = Y2(L) = 0. The
coef-ficients A, B are determined by imposing the continuity condition, P(0+) = P(0−), and from integrating both members of Eq.(A4)over the interval [−∆, ∆], then taking ∆ → 0.
The solution of these constraints provides A =∫ L 0 dx e−εx w(x), B =∫ 0 −Ldx e−εx w(x). A little algebraic manipulation yields the explicit result
A = Ei[εa] − Ei[ε(a − L)], (A6)
B = Ei[ε(a + L)] − Ei[εa], (A7)
where Ei[u] is the exponential integral of argument u.65The final expression reads P(x) ∝ eεx(a − x) ⎧ ⎪ ⎪ ⎪ ⎪ ⎪ ⎪ ⎪ ⎨ ⎪ ⎪ ⎪ ⎪ ⎪ ⎪ ⎪ ⎩ A(Ei[ε(a + L)] − Ei[ε(a − x)]) when x ∈ [−L, 0] B(Ei[ε(a − x)] − Ei[ε(a − L)]) when x ∈ [0, L] , (A8)
up to a normalization constant such that the integral of P(x) over [−L, L] is set to 1.
These expressions drastically simplify in the zero-field limit, 𝜖= 0, P(x) = C(a − x) ⎧ ⎪ ⎪ ⎪ ⎪ ⎪ ⎨ ⎪ ⎪ ⎪ ⎪ ⎪ ⎩ A ln[a + L a − x] x ∈ [−L, 0] B ln[a − x a − L] x ∈ [0, L] , (A9)
with A = ln[(a + L)/a], B = ln[a/(a − L)], and a normalization constant C−1=L 4[2a ln( a2 a2−L2)+ L ln( a + L a − L)].
Now, we are in the position to derive formula(10)for the ratio pR,
which determines the Brownian limit inFig. 8. The value of pRcan
be estimated in terms of the fluxes at the boundaries, which due to the fact that P(±L) = 0 are only proportional to the derivatives of P at x = ±L, i.e., J(±L) = −D0P′(±L). Then pRis obtained as the fraction
of the flux to the right over the total flux
pR= J(L)
J(L) + J(−L)=
ln(a + L) − ln(a)
ln(a + L) − ln(a − L). (A10) The average first-arrival time at the boundaries ±L, for a parti-cle released at x, is related to the survival probability, S(x, t), by the integral67
¯τ(x) =∫
∞
0 dt S(x, t).
By definition, S(x, t) is the probability that the particle has not yet left the interval [−L, L] at the time t and it is known to satisfy the backward Fokker-Planck equation67
∂S ∂t = D0 w(x) ∂ ∂x[w(x) ∂S ∂x], (A11)
with the boundary conditions S(±L, t) = 0. To obtain a differential equation for ¯τ(x), it is sufficient to integrate Eq.(A11)in the interval 0 ≤ t < ∞, and taking into account that S(x, ∞) = 0 and S(x, 0) = 1, thus d dx[w(x) d¯τ dx] = − w(x) D0 , (A12)
which has to be solved with the obvious boundary values ¯τ(±L) = 0, stating that particles emitted at the boundary are instan-taneously absorbed. We are interested in the average arrival time from x = 0; then, the searched solution is
¯τ(x = 0) = L 2 4D0+ aL 2D0 ln[a2/(a2−L2)] ln[(a + L)/(a − L)], which is exactly Eq.(13).
REFERENCES 1
H. Berg, E. Coli in Motion (Springer Science & Business Media, 2008). 2
J. R. Blake and M. A. Sleigh,Biol. Rev.49, 85–125 (1974). 3D. Woolley,Reproduction
126, 259–270 (2003). 4
M. Poujade, E. Grasland-Mongrain, A. Hertzog, J. Jouanneau, P. Chavrier, B. Ladoux, A. Buguin, and P. Silberzan,Proc. Natl. Acad. Sci. U. S. A.104, 15988–15993 (2007).
5S. Köhler, V. Schaller, and A. R. Bausch,Nat. Mater.10, 462 (2011). 6
A. Walther and A. H. Müller,Chem. Rev.113, 5194–5261 (2013). 7
M. Lattuada and T. Hatton,Nano Today6, 286–308 (2011). 8
C. Bechinger, R. Di Leonardo, H. Lowen, C. Reichhardt, and G. Volpe,Rev. Mod. Phys.88, 045006 (2016).
9
P. Romanczuk, M. Bär, W. Ebeling, B. Lindner, and L. Schimansky-Geier,Eur. Phys. J.: Spec. Top.202, 1–162 (2012).
10M. Marchetti, J. Joanny, S. Ramaswamy, T. Liverpool, J. Prost, M. Rao, and R. A. Simha,Rev. Mod. Phys.85, 1143–1189 (2013).
11S. Ramaswamy,Annu. Rev. Condens. Matter Phys.
1, 323–345 (2010). 12
R. Nash, R. Adhikari, J. Tailleur, and M. Cates,Phys. Rev. Lett.104, 258101 (2010).
13
J. Tailleur and M. Cates,Phys. Rev. Lett.100, 218103 (2008). 14F. J. Sevilla and L. A. G. Nava,Phys. Rev. E90, 022130 (2014). 15
B. ten Hagen, S. van Teeffelen, and H. Löwen,J. Phys.: Condens. Matter23, 194119 (2011).
16
G. Szamel,Phys. Rev. E90, 012111 (2014). 17
S. Das, G. Gompper, and R. Winkler,New J. Phys.20, 015001 (2018). 18
U. Marconi Marini Bettolo and C. Maggi, Soft Matter 11, 8768–8781 (2015).
19
G. Miño, M. Baabour, R. Chertcoff, G. Gutkind, E. Clément, H. Auradou, and I. Ippolito,Adv. Microbiol.8, 451–464 (2018).
20
L. Caprini and U. Marconi Marini Bettolo,Soft Matter14, 9044–9054 (2018). 21
H. Wensink and H. Löwen,Phys. Rev. E78, 031409 (2008). 22
A. Kaiser, H. Wensink, and H. Löwen,Phys. Rev. Lett.108, 268307 (2012). 23
Y. Fily, A. Baskaran, and M. Hagan,Soft Matter10, 5609–5617 (2014). 24J. Elgeti and G. Gompper,Europhys. Lett.
109, 58003 (2015). 25J. Elgeti and G. Gompper,Europhys. Lett.
101, 48003 (2013).
26E. Fodor, C. Nardini, M. Cates, J. Tailleur, P. Visco, and F. van Wijland,Phys.
Rev. Lett.117, 038103 (2016). 27
U. Marconi Marini Bettolo, A. Puglisi, and C. Maggi,Sci. Rep.7, 46496 (2017). 28
L. Caprini, U. Marconi Marini Bettolo, and A. Vulpiani,J. Stat. Mech.: Theory Exp.2018, 033203.
29S. C. Takatori, R. De Dier, J. Vermant, and J. F. Brady,Nat. Commun. 7, 10694 (2016).
30
L. Caprini, U. Marconi Marini Bettolo, and A. Puglisi, Sci. Rep.9, 1386 (2019).
31L. Caprini, U. Marini Bettolo Marconi, A. Puglisi, and A. Vulpiani,J. Chem.
Phys.150, 024902 (2019). 32
Y. Fily and M. Marchetti,Phys. Rev. Lett.108, 235702 (2012).
33
I. Buttinoni, J. Bialké, F. Kümmel, H. Löwen, C. Bechinger, and T. Speck,Phys. Rev. Lett.110, 238301 (2013).
34
J. Bialké, T. Speck, and H. Löwen,J. Non-Cryst. Solids407, 367–375 (2015). 35
M. E. Cates and J. Tailleur,Annu. Rev. Condens. Matter Phys.6, 219–244 (2015).
36
T. Speck,Eur. Phys. J.: Spec. Top.225, 2287–2299 (2016). 37
E. Tjhung, C. Nardini, and M. Cates,Phys. Rev. X8, 031080 (2018). 38
P. Digregorio, D. Levis, A. Suma, L. F. Cugliandolo, G. Gonnella, and I. Pago-nabarraga,Phys. Rev. Lett.121, 098003 (2018).
39
D. Ribet and P. Cossart,Microbes Infect.17, 173–183 (2015).
40K. Malakar, V. Jemseena, A. Kundu, K. Kumar, S. Sabhapandit, S. Majumdar, S. Redner, and A. Dhar,J. Stat. Mech.: Theory Exp.2018, 043215.
41
G. H. Weiss,Physica A311, 381–410 (2002). 42
L. Angelani, R. Di Leonardo, and M. Paoluzzi,Eur. Phys. J. E37, 59 (2014). 43A. Scacchi and A. Sharma,Mol. Phys.116, 460–464 (2018).
44P. Malgaretti and H. Stark,J. Chem. Phys.146, 174901 (2017). 45J.-c. Wu, Q. Chen, and B.-q. Ai,Phys. Lett. A379, 3025–3028 (2015). 46M. H. Jacobs, Diffusion Processes (Springer, 1935), pp. 1–145. 47R. Zwanzig,J. Phys. Chem.96, 3926–3930 (1992).
48D. Reguera and J. M. Rubí,Phys. Rev. E64, 061106 (2001).
49P. Burada, P. Hänggi, F. Marchesoni, G. Schmid, and P. Talkner,
ChemPhysChem10, 45–54 (2009). 50
M. Sandoval and L. Dagdug,Phys. Rev. E90, 062711 (2014). 51
F. J. Sevilla, A. V. Arzola, and E. P. Cital,Phys. Rev. E99, 012145 (2019). 52
Y. Fily, preprintarXiv:1812.05698(2018). 53
A. Sharma, R. Wittmann, and J. Brader,Phys. Rev. E95, 012115 (2017). 54
C. Bechinger, F. Sciortino, and P. Ziherl, Physics of Complex Colloids (IOS Press, 2013), Vol. 184.
55
P. Romanczuk and L. Schimansky-Geier,Phys. Rev. Lett.106, 230601 (2011). 56
R. Toral and P. Colet, Stochastic Numerical Methods: An Introduction for Students and Scientists (John Wiley & Sons, 2014).
57
C. Maggi, U. Marini Bettolo Marconi, N. Gnan, and R. Di Leonardo,Sci. Rep.5, 10742 (2015).
58
C. G. Wagner, M. F. Hagan, and A. Baskaran,J. Stat. Mech.: Theory Exp.2017, 043203.
59
L. Angelani,J. Phys. A: Math. Theor.50, 325601 (2017). 60
C. Lee,New J. Phys.15, 055007 (2013). 61
R. G. Winkler, A. Wysocki, and G. Gompper,Soft Matter11, 6680–6691 (2015). 62
C. Kurzthaler, S. Leitmann, and T. Franosch,Sci. Rep.6, 36702 (2016). 63
P. S. Burada, G. Schmid, D. Reguera, J. M. Rubí, and P. Hänggi,Phys. Rev. E 75(8), 051111 (2007).
64
G. Forte, F. Cecconi, and A. Vulpiani,Phys. Rev. E90, 062110 (2014). 65
G. Arfken and H. Weber, Mathematical Methods for Physicists (Academic Press, 2001).
66
P. K. Ghosh, V. R. Misko, F. Marchesoni, and F. Nori,Phys. Rev. Lett.110, 268301 (2013).
67
C. Gardiner, Handbook of Stochastic: For the Natural and Social Sciences (Springer, Berlin, 2009), Vol. 4.