ACTA IMEKO
ISSN: 2221-870XDecember 2016, Volume 5, Number 4, 64-72
On the safety design of radar based railway level crossing
surveillance systems
Tommaso Addabbo, Ada Fort, Cristian Della Giovampaola, Marco Mugnaini, Alberto Toccafondi,
Valerio Vignoli
Department of Information Engineering and Mathematical Science, University of Siena, via Roma 56, Siena, Italy
Section: RESEARCH PAPER
Keywords: availability studies; reliability studies; safety; Radar; railway level crossing
Citation: Tommaso Addabbo, Ada Fort, Cristian Della Giovampaola, Marco Mugnaini, Alberto Toccafondi, Valerio Vignoli, On the safety design of radar based railway level crossing surveillance systems, Acta IMEKO, vol. 5, no. 4, article 10, December 2016, identifier: IMEKO-ACTA-05 (2016)-04-10
Section Editor: Lorenzo Ciani, University of Florence, Italy
Received September 23, 2016; In final form October 28, 2016; Published December 2016
Copyright: © 2016 IMEKO. This is an open-access article distributed under the terms of the Creative Commons Attribution 3.0 License, which permits unrestricted use, distribution, and reproduction in any medium, provided the original author and source are credited
Corresponding author: Marco Mugnaini, e-mail: [email protected]
1. INTRODUCTION
The design of any system interacting with the signalling infrastructure of railways implies the integration of safety requirements. The case of surveillance systems for level crossings (LC) is a clear example of how a system can be deeply affected by such an issue. Different techniques can be exploited for the design of an LC monitoring system, nevertheless the advantages with respect to the drawbacks of each possible technical solution should be weighted towards the safety constraints before actual implementation. In particular highly performing solutions may result in unfeasible designs when considering safety requirements.
Usually the approaches followed for safe system design derive from the standard in [1] and on minor modifications of previous designs for similar applications, as in [2]-[4]. According to these guidelines, software, hardware and
communication issues are taken into consideration in granting the needed safety targets.
What happens in practice is that designers when following the applicable standards often do not include important problems, which cannot specifically be related to these three main categories, but rather to the physical realization of the system and above all to its interactions with the environment. This is due to a lack in the preliminary problem analysis [1]-[4]. Some authors, tried to approach the problem just in terms of system performance as [5], [6] neglecting to design the system in order to meet the minimum safety requirements. Others as [7]-[9] used the standard approach to safety design trying to exploit reliability block diagram methods or fault tree analysis resulting in a partial problem overview. Of course, this kind of approach is important and is a fundamental aspect of a safety design but, in many cases, it is not sufficient: the safety
ABSTRACT
Recent accidents experienced at railway level crossings are pushing researchers to design surveillance systems able to grant safety of passengers and structural integrity of trains at level crossings. The challenge is represented by granting at the same time an appropriate reliability, availability and maintainability degree despite the high safety requirements imposed by the application. The approach proposed in this paper takes into consideration the most common suggested standards used in designing this kind of systems and introduces new general concepts which demystify the use of such standards in actual applications. This paper illustrates the roadmap to be followed in general when designing level crossing monitoring systems, to minimize the risk due to object misdetection occurring on barrier closure when exploiting radar technology.
A specific surveillance system based on FMCW radar technology was used as a case study, but the approach presented in this paper has a general validity
assessment for a complex system needs in addition a deep application scenario analysis.
Speaking of monitoring or surveillance system design, in general, a mixture of different aspects as described in [10]-[20] should be considered, depending heavily on the specific technology used for all the components, with a special attention to the sensor technology which tremendously affects the overall system safety integrity.
In this paper the problem of designing a monitoring system for railway LCs taking into account all the safety requirements is discussed. In particular a roadmap on the needed steps is provided to meet the highest safety degree required by commonly used standards [1-4].
The approach followed in this paper, is to consider the safety allocation and requirements as pre-established values which have to be satisfied according to the selected LC application. Alternatively, in what follows, the allocation phase outcomes are considered as problem given inputs. The allocation analysis and the failure modes analysis are therefore not performed. The requirements in terms of safety integrity level and tolerable hazard rate are taken as given values.
The paper is organized as follows: in Section 2 the general safety theory is presented and a generalized approach to apply it to railway monitoring and interfacing system is provided. A general description of the most used standards is supplied as well. In Section 3 a case study is presented, based on radar technology, by using this specific example it is possible to discuss how all safety aspects, also those not explicitly mentioned in the standards, impact on the system design. Finally, the conclusions are presented.
2. THEORY OF SAFETY DESIGN OF RAILWAY MONITORING SYSTEMS
This section aims at the definition of the approach which should be followed when designing a complex system, such as an LC monitoring system, satisfying a pre-established safety level.
In particular for railway level crossing systems (LCS) SIL4 is the requirement to be met.
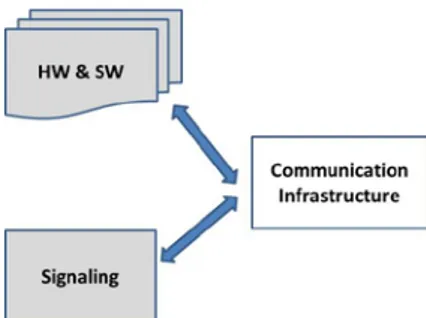
The problem is usually approached through a top-down analysis. Several tools can be used and merged at this level as suggested in [8], [9]. Usually to act effectively on a complex problem, decomposition in hardware, software and communication infrastructures is followed, which implies the division of the system into subsystems interconnected through a diagram representation as proposed in Figure 1, where the proposed blocks identify both hardware and software components interacting through the communication infrastructure to generate a composite fail safe system.
Actually the highest safety degree which can be claimed by these structures considered into continuous operating mode [1]-[4] depends on the maturity of the hardware technology and its specific design, on system software-hardware integration and diagnostic coverage design and on other factors too.
It has to be underlined, however that, in many complex applications such as the one considered in this paper for the detection of obstacles in railway LCs, there are some aspects going far beyond the simple involvement of both hardware and software, as it will be discussed later.
Starting from the system decomposition, to address safety study, the roadmap shown in Figure 2 is followed.
The first step addresses the system conceptual design
through a preliminary hazard analysis (PHA). Then the safety requirements identified for the specific application jointly with the design requirements are used to build the final system specification meant in terms of both functional and RAMS requirements. Once the preliminary design is completed a detailed low level (system and subsystems) hazard analysis (HA) is performed and the countermeasures for the specific application identified and managed as detailed safety requirements for subsequent safety allocation. After the safety analysis is conducted and the safety case is managed, then the final system is designed and verified and retrofitted according to the evaluation phase outcomes. In the validation phase both the Tolerable Hazard Risk (THR) or Probability of Failure on Demand (PFD) in continuous applications are evaluated and compared with the safety levels allocated in the previous steps [1]-[4]. The key point of the proposed scheme (in Figure 2) is that addressing hardware and software and their mutual integration may allow, in principle, to achieve the safety targets and cover the identified safety needs requested by each designed function. Nevertheless, in practice, there are a multitude of cases where the system design is “application dependent” needing to address specific physics or scenario assumptions. The avoidance of such approach may result in critical and poor design where just a partial risk mitigation takes place. In what follows a sample case study of a monitoring system for LCs based on radar technology is treated in order to show how apparently, by considering only the hardware safety the pre-established SIL targets seems to be achieved, but the
Figure 2. Roadmap to be followed during the design phase of a SIL 4 safety related application.
scenario or the physical interaction with the environment may actually influence the safety of the overall system. Hence neglecting these aspects leads to an unsafe system design and to wrong conclusions. Modifications of the initially proposed architecture are also discussed as possible solutions to cope with safety requirements which cannot alternatively be met once issues linked to the specific scenario are introduced. In this paper, in particular, considerations on missed detection probability and on under threshold objects presence in the scenario, may result in jeopardizing exogenous contributions to the achievement of safety target.
3. CASE STUDY: RADAR MONITORING SYSTEM FOR A RAYLWAY LCS
Several technologies can be exploited to implement a monitoring or surveillance system for LC structures. Each one has its own peculiarity in terms of sensitivity and detection capabilities and of course some pitfalls. In this manuscript the authors decided to use, as a case study, a specific short-range radar architecture exploiting frequency modulated continuous wave (FMCW) technology, which has proved to be a promising solution due to its simple working principle. The operating frequency 24 GHz ISM-Band (250 MHz) was chosen for this application.
3.1. Hardware and Software Structures
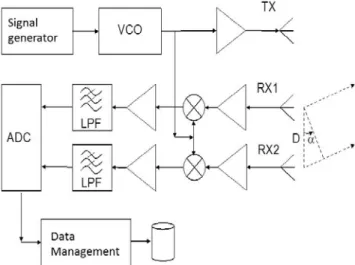
The general hardware architecture is the one depicted in Figure 3.
The radar sensor is a Linear-FMCW system, equipped with a single transmitter and two receivers with the receiving antennas placed at the distance D. Signals received by the receiving antennas are processed (demodulated by I/Q system), filtered, sampled, acquired and post-processed.
The transmitting antenna radiates an electromagnetic wave with frequency sweeping linearly from a low frequency (fmin) up
to a maximum one (fmax) in the time interval (Tc). The wave
reflected by the target is received by the two receiving antennas and the transmitted signal is used to down-convert the received signals to baseband. Each beat signal gives the frequency difference between the transmitted and the reflected waves,
which in turn is proportional to the distance R between each antenna and the detected object.
Figure 4 illustrates the periodic saw-wave function (upper plots) which is the modulating signal of the FM transmitted (blue), the frequency of received signal (red) and the beat frequency (lower plot) vs. time. With reference to Figure 4, R can be determined using equation (1).
f B T c c R s c ∆ = = 2 2 0 0τ (1) where Bs=(fmax-fmin) is the sweep bandwidth and ∆f is the
measured frequency difference.
The relative motion of the object with respect to the radar sensor can be detected since it causes a Doppler frequency shift of the received signal frequency.
Using two receiving channels allows to estimate also the angular position of an object considering it constrained on a plane, exploiting spatial diversity and combining the two measured distances.
Summarizing, with the sensor and monitoring system in Figure 3, range, angle position and, if needed, relative velocity can be estimated through proper (complex) processing algorithms on the demodulated and sampled radar signals [12].
A processing/controller unit has the task of controlling the sensor operations, of processing acquired signals and finally of comparing the estimated received signal power with a proper threshold value in order to detect the presence of an obstacle.
Once the angular position of the target and the distance have been determined the data is transmitted on a physical support (which can be either traditional copper wiring or optical fiber) to another processing unit for the data post-processing and final decision on the occupancy of the level crossing.
Following the guidelines in the standards, the safety performance of the described system depends on the failures of the hardware (antennas, conditioning electronics, acquisition electronics, control and processing unit), of the software components (control of the hardware operations, data processing, data managing) and of the data transmission systems.
3.2. Safe Conceptual Design, Testing and Validation
For shortness, in this section, the discussion is limited to the hardware and the data transmission system proposed for this specific application, whereas the aspects concerning the safety of software components will not be treated.
For the evaluation of the system THR, using the safety analysis performed during the system design, the safety function
Figure 3. FMCW structure with one transmitter and two receivers. The presence of two receivers enables to detect both target distance and
involving the highest complexity in terms of dangerous failure rates, lower diagnostic coverage and highest number of critical components is evaluated.
Usually such approach should not be followed due to the fact that on safety matters 100 % coverage should be followed for safety function evaluation. Nevertheless depending on the designer and assessor experience it is reasonably correct to take into considerations the functions that more than others may be involved in granting the system safety and integrity due to the peculiar system definition and operating conditions. The main function of this system is to change the status of the signaling system from the safe state (red light), which is adopted in all the situations, to the unsafe state (green light) if and only if the system has not detected any object in the LCS specific area once the barriers are closed within a specified scanning time (max. 7s).
The corruption of this function can lead to the most critical outcomes in terms of severity.
Such function is performed by the following items: • Radar sub-system
• Data processing and management • I/O interface board
As mentioned in the previous sections the required system SIL for railway signaling applications is 4. This safety level can be hardly reached by a single item specifically designed for a new application as described also in the IEC61508 standard. The use of multiple items can therefore be exploited to grant the required safety level and to increase the detection capabilities.
The corresponding functional block diagram is the one depicted in Figure 5. In such system the Radar sub-system is represented at least with two radars but it can be set up with any devices number.
The Data processing and management is defined as 2oo2 Main Board [1]-[4] due to the fact that the architecture has to be “composite fail-safe”. The board is equipped with two processors [10] which are devoted to the evaluation of each radar signal content enabling the system to drive the I/O interface, if and only if, there is no reasonable doubt to have correctly scanned the area. The I/O output board has at least two outputs driving the energized sides of an actuator in order to send a signal only in case both the CPU on the main processing board give consensus to the change of the system from safe state (red light for train passage) to actuated state (green light to train passage).
Such architecture allows in case of failure of one unit (CPU
or Radar or I/O output) to interrupt the communication avoiding the inappropriate driving of the signaling system. In Figure 6 the corresponding reliability block diagram (RBD) is derived from the system mission definition referring to the blocks of Figure 5. The overall system is treated as a reliability series due to the fact that the failure of any item contributing to the safety function coverage implies the missing of the safety requirements.
Once the working environment has been defined (for this application is 40 °C and Ground Fixed), the failure rates can be derived exploiting the MIL-HDBK-217F database, while the repair rates have been assessed on the basis of similar applications, referring to the specific system hardware.
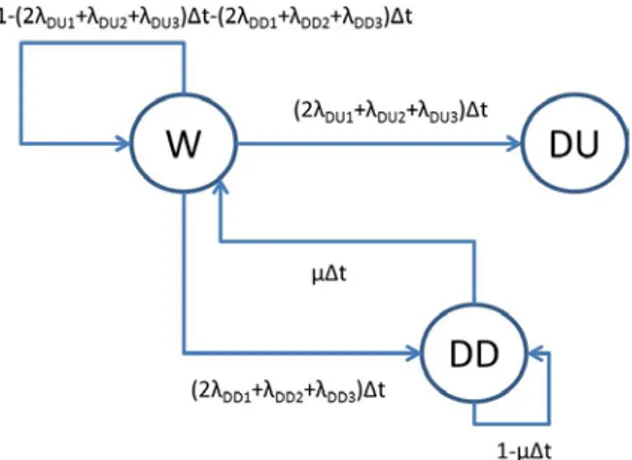
For the SIL evaluation (THR according to the needed standard [1]-[4]) an homogeneous first order memoryless Markovian model has been implemented in the case of two radar systems. The number of states necessary to evaluate the system safety integrity level has been reduced to a minimum of three in this specific scenario. This simplified representation can be successfully exploited for the problem because any Markov model can be reduced if the proper aggregation procedure on failure rates is considered. Moreover this kind of scheme results in a conservative diagram with respect to different and more complex ones.
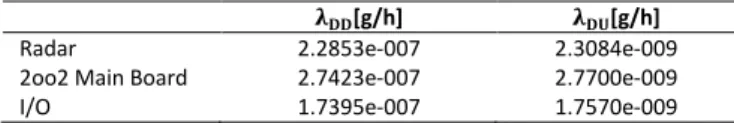
In Figure 7 the obtained Markov model (Figure 6) is represented, in which the state W represents the system working condition, DD corresponds to the state in which the system has experienced a detected dangerous failure, which does not affect the system safety function, finally DU represents a undetected dangerous failure with consequent loss of safety coverage. The diagnostic coverage of the system has been considered to be 99 % due to a set of software self-tests performing hardware checks. The aggregated failure rates and repair rates, obtained from the analysis of the overall system as mentioned above, and needed to describe the transitions among the three states, are summarized in Table 1.
Figure 6. Reliability representation (RBD) of the proposed detection system based on radar sensing technology (case of two radar systems).
Figure 5. Functional representation of the proposed detection system based
Starting from the failure rates (λXX, XX=DU, DD) and repair rate (µ), the transition matrix T can be evaluated substituting the proper detected and undetected dangerous failure and repair rates into the corresponding diagram symbols of Figure 7 obtaining (2): 𝑇 = �1 − (𝑎 + 𝑏)∆𝑡𝜇∆𝑡 1 − 𝜇∆𝑡𝑎∆𝑡 𝑏∆𝑡0 0 0 1 � , (2) where: 𝑎 = 2𝜆𝐷𝐷1+ 𝜆𝐷𝐷2+ 𝜆𝐷𝐷3 𝑏 = 2𝜆𝐷𝐷1+ 𝜆𝐷𝐷2+ 𝜆𝐷𝐷3
The matrix defined in (2) relates the state probabilities at time t with the state probabilities after a certain discrete time increment ∆t as per (3) �𝑃𝑃𝐷𝐷𝑊(𝑡 + ∆𝑡)(𝑡 + ∆𝑡) 𝑃𝐷𝐷(𝑡 + ∆𝑡) � = [𝑇]′ �𝑃𝑃𝐷𝐷𝑊(𝑡)(𝑡) 𝑃𝐷𝐷(𝑡) � . (3)
The differential equations describing the system dynamics can be derived from (3) as shown in (4).
lim∆𝑡→0 ⎩ ⎪ ⎨ ⎪ ⎧𝑃𝑊(𝑡+∆𝑡)−𝑃∆𝑡 𝑊(𝑡)= −(𝑎 + 𝑏)𝑃𝑊(𝑡) + 𝜇𝑃𝐷𝐷(𝑡) 𝑃𝐷𝐷(𝑡+∆𝑡)−𝑃𝐷𝐷(𝑡) ∆𝑡 = 𝑎𝑃𝑊(𝑡) − 𝜇𝑃𝐷𝐷(𝑡) 𝑃𝐷𝐷(𝑡+∆𝑡)−𝑃𝐷𝐷(𝑡) ∆𝑡 = 𝑏𝑃𝑊(𝑡) ⎭⎪ ⎬ ⎪ ⎫ (4) Using the values of Table 1, it is possible to evaluate the probability of being in the state of DU within one hour. Such probability for continuous operating system claiming a SIL 4 should be lower than 10-8 (THR <10-8 1/hr). The case study exploiting two FMCW radars hardware implementation satisfies the requirements needed for signaling railway systems as can be seen in Figure 8. Anyway the configuration selected for the two radars is a functional 1oo2 from a safety standpoint, to take into account that the two radars are observing the same scene from different viewpoints. Nevertheless the resulting model corresponding to the Markov diagram of Figure 7 is a
conservative representation of the proposed configuration and can be therefore considered as representative of a worst case condition.
The behavior of PDU confirms that such probability within
the first hour is never larger than what is required by the standards [1]-[4]. Looking the plots in Figure 8 it is evident that, within the considered time interval, the probability reaches a value close to the limit set by the standard. This can appear as a dangerous situation since apparently there is a little safety margin. Nevertheless it should be reminded that the threshold values suggested by the standards include a sufficient safety margin, and, according to [1]-[4] remain sufficient to accept the proposed design. In any case the results shown in Figure 8 are obtained considering a specific sensor redundancy and scenario, but the approach used is generally valid. It is possible to add other sensors increasing the margin with respect to the standard probability threshold.
3.3. Safety issues related to the sensing system and application scenario
After having evaluated the impact on safety design of the hardware implementation it is important to analyze and take into account the influence of the sensing system devoted to the obstacle detection with reference to the case study. In a radar sensor, the detection of an object in a monitored area is based on the measurement of the power reflected back to the receiving antenna by the object, when illuminated by an electromagnetic wave from the transmitting antenna. The radar detection process involves making decisions based on a set of “return power” measurements. Obviously, due to the presence of noise in the received signals, an error-free decision is not always possible, so on analogy to what happens when studying the hardware or software implementation, to evaluate the sensing system safety level, the problem is treated in a statistic framework.
Let’s define the following quantities:
1. Pfa (false alarm probability): it is intended as the
probability to declare an object present when it is not actually present.
2. Pd (detection probability): it is the probability to
declare an object present when it is actually present on the scene.
The probability of declaring an object absent when it is actually present on the scene of interest is defined as the probability of missed detection Pmd and can be derived from the
previous definition as Pmd=1-Pd.
Radar systems, even if providing excellent performances, cannot grant 100 % object detection probability as well as a false alarm rate equal to zero.
In the present work authors tried to combine the probability of missed detection (PMD) with the standard SIL evaluation in order to assume that the composed SIL (SILC) level is matched, if both the PMD and the hardware SIL are within the required probability window of a specific safety allocated target (for this example SIL4 of PMD=PFD<10-4 for on demand mode operating systems).
In the studied case, it is possible to derive the probability of missed detection of the proposed radar on the basis of some simple and generic assumptions.
Table 1. Dangerous detectable and undetectable failure rates of the subsystem components.
𝛌𝐃𝐃[g/h] 𝛌𝐃𝐃[g/h]
Radar 2.2853e-007 2.3084e-009
2oo2 Main Board 2.7423e-007 2.7700e-009
I/O 1.7395e-007 1.7570e-009
Figure 8. Probability dynamic behavior of the proposed homogenous Markovian system. 0 0.1 0.2 0.3 0.4 0.5 0.6 0.7 0.8 0.9 1 0 0.5 1x 10 -8 Time [h] PD U (S ta te ) 0 0.1 0.2 0.3 0.4 0.5 0.6 0.7 0.8 0.9 1 10-2e-007 100 Time [h] PW (S ta te ) 0 0.1 0.2 0.3 0.4 0.5 0.6 0.7 0.8 0.9 1 0 0.5 1x 10 -6 Time [h] PD D (S ta te )
Usually when radars are involved the Neyman-Pearson criteria is used for such determination. To minimize the Pfa and
maximize Pd at the same time can result in some cases in an
unfeasible problem. The two above defined probabilities for the threshold based decision algorithm can be related by means of the so called ROC (Receiving Operating Characteristic) curves. Each curve is the plot of Pd(T) versus Pfa(T), when varying T
(threshold level) at a given signal to noise ratio at the output of the radar system, SNRout.
If we assume that the noise is Gaussian distributed such ROC curves [22], [23] for a coherent receiver and for a single pulse can be expressed by (5):
[
2 2]
2
1erfcerfc 1( P ) SNR /
Pd = − fa − out
(5) where erfc() is the complement of the error function
Moreover, in case of free space propagation, the receiver input power, Prin, can be written as:
(
)
( )
3 4 2 4 R G G P Prin t t r π σ λ = (6) where Pt is the transmitted power, Gt and Gr are the gain of thetransmitting and receiving antennas, λ is the wavelength of the transmitted wave and σ is the target radar cross-section. It can be seen that the power received from the target depends linearly on the radar cross section, which results in a measure of the detectability of the target; this parameter depends on the object size, orientation, shape and surface characteristics.
Note that the detection system is aimed at detecting only dangerous objects, named hereafter targets to be detected (TTD), i.e. static targets large enough to cause an accident when the train passes (such as vehicles) correspondingly there will be a minimum radar cross section to be taken into account in the design. Objects with a smaller radar cross section (e.g. small animals), have not to be detected, in order to avoid useless stops of the train traffic reducing the overall railway network availability.
An estimation of the noise due to the receiver architecture can be obtained using the characterization data in Table 2 obtained, for the used radar, by measurements in an anechoic environment.
Using Data of Table 2, such power is given by the following equation: 56 . 77 ) ( [mW] 10 753 . 1 8 − = ⋅ = − dBm P P in r in r (7)
If the receiver is characterized by a noise figure Fr, the receiver output SNRout ratio can be evaluated exploiting (8)
n r in r out P F P SNR1 = (8)
where Pn is the input noise power. The noise due to the
receiver can be therefore estimated according to eq.(8).
Again exploiting data of Table II it is possible to compute the noise introduced by the receiver as (9):
56 . 117 ) ( 10 75 . 1 15 − = ⋅ = − m n r n r dB P F P F . (9)
Once found this value from the characterization measurements, (8) can be used to find a theoretical estimate of the receiver SNRout when varying the distance radar-target or the radar cross section.
In particular if the maximum distance from the radar to an object in the LC area is considered as the distance R, and if the cross-area of the smallest dangerous obstacle is considered, the minimum output signal to noise ratio, SNRout,min(dB) related to
the presence of a TTD in the scene can be found. This minimum signal to noise ratio value allows for selecting the threshold for the detection of an object in the scene.
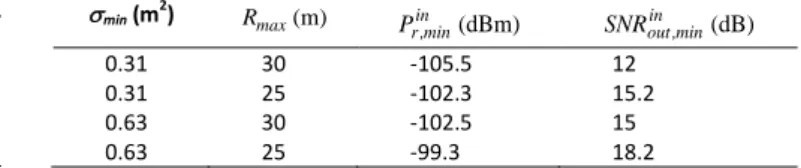
In Table 3 data concerning the four limit situations to be considered in the case study are reported: two possible maximum distances (for two possible areas of LCs) and two minimum radar cross sections (selected as the cross-area of the smallest TTD).
The false alarm probability, which has no direct impact on the safety level, can be a priori established by the system end user. In this case the authors assumed that the system should declare only once per year that an object is on the scene when actually it is not present. Supposing a working time of 5000 hours per year this corresponds to a Pfa= 2x10⁻⁴ (fixing the
threshold of 12 dB).
The plot in Figure 9 shows the detection probability, Pd, for
the considered radar, obtained from the ROC curves (at different SNRout) that relate Pfa and Pd, keeping Pfa= 2x10⁻⁴.
As far as safety level is concerned, instead, due to the fact that the desired SIL level is 4, the Pd should fulfill the SIL 4
requirements (Pd =0.9999). Exploiting the curve of Figure 9 it is
possible to determine that such value is reasonable if the receiver has a SNR=17dB which corresponds to a detectable object with a minimum radar cross section of 0.63 m2 within 25 m distance, in ideal conditions.However in a real scenario, the detection system capability depends also on the presence of clutter (non-Gaussian noise), which degrades the SNR. This problem is usually mitigated by clutter cancellation techniques, such as integration over multiple scans [23]. In the present case two radars are used to monitor the same scene from different positions so the overall probability of missed detection is the product of the two probability, counterbalancing the effect of clutter. Numerical evaluation shows that the target limits are respected.
Even if the probability of missed detection fulfills the requirements for a SIL4 system, there is another issue that has
Table 3 Data corresponding to different conditions: two minimum σ and two maximum distances for the target.
σmin (m2) Rmax(m) Prin,min(dBm) (dB)
in min , out SNR 0.31 30 -105.5 12 0.31 25 -102.3 15.2 0.63 30 -102.5 15 0.63 25 -99.3 18.2
Table 2 Characterization Data for the Radar sensor.
Parameter Value
Measured signal to noise ratio (SNR) 40 dB
Measurement Distance, R 8 m
Target radar cross section, σ 1 m2
Transmission Power EIRP (PtGt) 20 dBm
to be considered to grant the desired safety level.
In fact the detection system is designed to detect only dangerous objects, TTDs, on the other hand objects with a smaller σ (e.g. small animals), have not to be detected. Nevertheless a non-detectable object placed on the scene may cause safety problems when in the optical path between the sensor and a TTD. In this case, in fact, the under threshold target (UTT) can mask the TTD due to signal attenuation. Therefore even if this kind of scenario is not described in the applied standard it can represent an hazard whose effect has to be modeled and quantified in order to be included in the final calculation of the missed detection probability.
In the following, the authors assessed the probability of a missed detection due to the presence of an UTT masking the TTD in a worst case framework, based on the spatial resolution characteristics of the case study radar detection system.
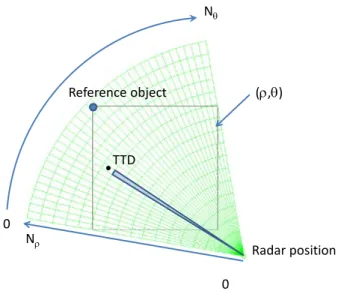
In analyzing the problem we consider the LC area split by a mesh defined considering the range and angular resolutions of the radar system, ∆θ and ∆ρ, (see Figure 10), so that the scene is covered by a grid of resolution cells that can be referenced by an angular index, θ, and range one, ρ, being impossible to distinguish two targets which are located inside the same cell.
Assuming that the UTT occupies a single radar resolution cell, to perform the calculation in the worst case it was assumed that also the TTD occupies a single cell irrespective of its distance from the radar sensor. This is clearly a pessimistic scenario because a vehicle radar cross section will occupy more than a single cell. Note that fixing the cell number occupied by an object irrespective of the object position in the scene, is indeed a simplification, because the resolution cell has a variable area. In any case considering the furthest cells area when fixing the number of cells occupied by the targets gives a worst case scenario.
In the LC monitoring system a dedicated reference object is placed in front of each radar sensor on the opposite side of the monitored area, which has always to be detected and allows also for taking into account environmental parameter variations (temperature compensation, rain etc…).
It is assumed that the unwanted object can never lay on the optical path connecting the radar to its reference object because in this case the absence of the detection will bring the system in a safe state.
Considering the grid made up of Nθ angular division, and Nρ
range division, we assume a uniform probability for an object (both TTD and UTT) to be in a certain cell (ρ, θ) given by Pρ,𝜃=N1
θ𝑁𝜌. (7)
For one radar the probability of missing the detection of a TTD can be evaluated as follows:
𝑃𝑀𝐷= 𝑃𝑁𝐷𝑃{𝑇𝑇𝑇 𝑖𝑖 𝑡ℎ𝑒 𝑠𝑠𝑒𝑖𝑒}, (8)
where PND is the probability the object is in the scene (in the
LCS area) but it is not detected due to the presence of an UTT. To find PND we consider the following equation:
𝑃𝑁𝐷= ∑ 𝑃′𝜌,𝜃 𝜌,𝜃𝑃{𝑇𝑇𝑇 𝑖𝑖 𝑠𝑒𝑐𝑐 𝜌, 𝜃 }, (9)
𝑃′𝜌,𝜃= 𝑃{𝑈𝑇𝑇 𝑖𝑖 𝑡ℎ𝑒 𝑜𝑜𝑡𝑖𝑠𝑎𝑐 𝑜𝑎𝑡ℎ|𝑇𝑇𝑇 𝑖𝑖 𝑠𝑒𝑐𝑐 𝜌, 𝜃}.
The conditional probability 𝑃𝜌,𝜃′ can be easily evaluated
considering that it corresponds to:
𝑃′𝜌,𝜃= 𝑃 {𝑈𝑇𝑇 𝑖𝑖 𝜃, 𝑅 < 𝜌} = ∑𝑅<𝜌𝑜𝜃,𝑅 (10)
where R represents the distance of the UTT.
In Figure 11 the value of 𝑃′𝜌,𝜃 is color coded, obviously it
increases with the distance of the TTD from the radar, in this figure the optical path to the reference object is assigned a 𝑃′𝜌,𝜃
equal to zero. Note that 𝑃′𝜌,𝜃 is always smaller than 1/Nθ.
So with this very simple approach we can write: 𝑃𝑁𝐷= ∑ ∑ 𝑃𝜌 𝜃 ′𝜌,𝜃𝑁𝜌1𝑁𝜃= ∑ ∑𝜌 𝑅<𝜌𝑜𝜃,𝑅𝑁1𝜌= 1 𝑁𝜃𝑁𝜌2( 𝑁𝜌�𝑁𝜌−1� 2 − 1 ) < 1 𝑁𝜃 (11)
where we considered all the events ‘the DDT is not detected but in the scene mutually' exclusive events.
These very simple results give a rule of thumb, which is obvious: by increasing the angular resolution the missed detection probability decreases. Actually this remains true only if the radar cross section of the UTT allows it to remain in a
Figure 9. Probability of detection of a target under the assumption Pfa=
2x10⁻⁴.
Figure 10. Cell distribution of a single radar sensor on a 6x6 m2 area (LCS
area) considering 2° of angular resolution and 60 cm range resolution for the selected bandwidth of 250 MHz.
Radar position (ρ,θ) 0 Nθ 0 Nρ Reference object TTD
resolution cell, otherwise the probability PND depends on the
angular aperture determined by the cross section.
The designer can evaluate how the sensor redundancy mitigates this type of missed detection. In fact by using more than one sensor the missed detection due to a single UTT is avoided since the lines of sight from the TTD to the radar systems are different. In case of N radar systems the missed detection can be caused only by the simultaneous presence of N UTTs obscuring the three lines of sight.
Such a situation can be described by the joint probability of N independent conditioned events, each described by the same 𝑃′𝜌,𝜃. In the analyzed case PND is close to 10-4 for the scenario
with two radars whereas three radars PND give a value close to
10-6 which is a satisfactory result according to PFD
requirements.
In the last case, the overall probability of failure on demand (PFD), which corresponds to the probability of missed detection due to the presence of three UTTs in the scene (PMD)
is given by the product of the estimated PND and P{TTD in the
scene}. This latter quantity is an a priory value obtained from the analysis of the historical data for train. To grant the performance of a SIL 4 system it has to be smaller than 1/10.
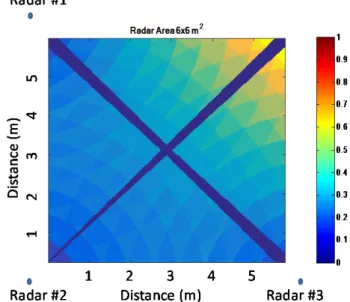
The conditional probability obtained with three different radars placed at the three corners of the LCS area is shown in Figure 12.
In the more realistic case a TTD occupies more than a resolution cell, while the UTT occupies 1 cell, therefore a modified approach can be followed. Assuming that the TTD occupies KxK cells, if the value of 𝑃′𝜌,𝜃 is evaluated using (10)
again, but considering an angular resolution ∆θ’=K∆θ and a range resolution ∆ρ’=K∆ρ. Therefore the following inequality holds:
𝑃𝜌,𝜃′ = ∑𝑅<𝜌𝑜𝜃,𝑅<𝑁1
𝜃′ =
𝐾
𝑁𝜃 (12)
Note that this probability is not anymore the probability of having the DDT in the position (ρ,θ) masked, but the probability that if the DDT is in (ρ,θ) than a UDT (occupying
only 1/K2 of the cell) is in the cells on the line from the DDT to the radar. So the conditional probability of having the DDT in (ρ,θ) masked is the probability of having at the same time at least K UDTs in the same cell (ρ,θ) aligned so to mask the object. Hence we have:
𝑃𝜌,𝜃𝐾 =𝑃{𝑇𝑇𝑇 𝑚𝑎𝑠𝑚𝑒𝑚| 𝑇𝑇𝑇 𝑖𝑖 (𝜌, 𝜃)}= = (𝑃𝜌,𝜃′ 𝐾)(𝐾−1)!𝑘𝑘−1 < � 𝐾 𝑁𝜃� 𝐾 . (13)
So if K < Nθwe have a reduced conditional probability, as
expected. The probability PND is obtained in the same way as
before (considering ∆θ’ and ∆ρ’). In the case taken into account, by choosing a value K = 2 (and three radar) the value of PND is far smaller than 10-8, so in this case irrespective of the
actual value of the a priori probability of having K×N UDTs on the scene the SIL 4 requirements are fulfilled. Note that K=2 is a really cautious value for the radar cross section of any dangerous object (vehicle).
4. CONCLUSIONS
In this paper the authors presented a case study to analyze the problem of designing a safe monitoring system for level crossing using radar technology. In the present manuscript a strategy to manage the problem was proposed and an extensive evaluation of a possible configuration satisfying SIL 4 requirement was illustrated.
In the paper, analyzing a case study concerning a railway crossing monitoring system based on FMCW radar technology, a specific configuration has been suggested in order to satisfy the safety constraints provided by the standard. The analysis of this special case allowed for highlighting how a safety study based on the analysis of component failure only, is not sufficient, and can be in a certain way misleading if the overall scenario is not taken into consideration. In particular it has been shown that it is important to analyze and take into account the influence of the sensing system and its interaction with the environment. In the studied case, for instance, it has been shown how the probability of missed detection of a
Figure 11. 𝑃′𝜌,𝜃 represented as a function of the position in grid. The value
of the probability is color coded. The dark line represents the forbidden area where the UTT is masking the reference object with a consequent safe state determination.
dangerous obstacle due both to the radar performance and to the presence on the scene of small undetectable obstacles have to be modeled and evaluated in order to obtain a SIL4 monitoring system.
Moreover it has been shown that a safety design has to find a good tradeoff among functional requirements, overall system complexity, and safety parameters.
REFERENCES
[1] IEC 61508 Functional Safety of Electrical/Electronic/Programmable Electronic Safety-related Systems (E/E/PE, or E/E/PES).
[2] EN 50126 Railway Applications - The Specification and Demonstration of Reliability, Availability, maintainability and Safety (RAMS).
[3] EN 50129 Railway Applications - Communications, signaling and processing systems – Safety related electronic systems for signaling.
[4] EN 50128 Railway Applications -Communications, signaling and processing systems.
[5] M. Mugnaini, M .Catelani, G.Ceschini, A. Masi, F. Nocentini “Pseudo Time-Variant parameters in centrifugal compressor availability studies by means of Markov models” in Microelectronics Reliability, vol. 42, 2002, p. 1373-1376, ISSN: 0026-2714
[6] G. Ceschini, M. Mugnaini, A. Masi “A reliability study for a submarine compression application” Microelectronics Reliability, vol. 42, 2002, p. 1377-1380, issn: 0026-2714
[7] M. Catelani, M. Mugnaini, R. Singuaroli. “Effects of test sequences on the degradation analysis in high speed connectors” Microelectronics Reliability, vol. 40, p. 1461-1465, ISSN:0026-2714.
[8] S.S. Rao “Reliability engineering Design” McGraw Hill
[9] A. Birolini “” Reliability Engineering: Theory and Practice Springer 6th Edition 2010
[10] Lohmeier, S.P. Rajaraman, R. ; Ramasami, V.C. “Development of an ultra-wideband radar system for vehicle detection at railway crossings” Ultra Wideband Systems and Technologies, 2002. Digest of Papers. 2002 IEEE Conference on pp. 207 - 21110.1109/UWBST.2002.1006349
[11] T. Nakagawa “Advanced Reliability Models and Maintenance Policies” DOI 10.1007/978-1-84800-294-4
[12] A. Fort, F. Bertocci, M. Mugnaini, V. Vignoli V. Gaggii, A. Galasso, M. Pieralli “Availability Modeling of A Safe Communication System for Rolling Stock Applications” IEEE I2MTC2013 Conference Proceedings, pp. 427-430, 2013.
[13] M. Catelani, L. Ciani, M. Mugnaini, V. Scarano, R. Singuaroli “Definition of safety levels and performances of safety: Applications for an electronic equipment used on rolling stock” IEEE Instrumentation and Measurement Technology Conference, 2007, Article number 4258348.
[14] Kim, Y.-J., Baek, J.-H., Choi, K.-H. Algorithm development of level crossing obstacle detection using laser radar sensor 2013 Transactions of the Korean Institute of Electrical Engineers 62 (12), pp. 1813-1819
[15] Fort, A., Mugnaini, M., Vignoli, V. Hidden Markov Models approach used for life parameters estimations 2015 Reliability Engineering and System Safety 136, pp. 85-91
[16] Addabbo, T., Fort, A., Mugnaini, M., Vignoli, V., Simoni, E., Mancini, M. “Availability and reliability modeling of multicore controlled UPS for datacenter applications” (2016) Reliability Engineering and System Safety, 149, pp. 56-62.
[17] Bertocci, F., Fort, A., Mugnaini, M., Vignoli, V. “Availability comparison between distributed and concentrated UPS control systems” (2016) 14th IMEKO TC10 Workshop on Technical Diagnostics 2016: New Perspectives in Measurements, Tools and Techniques for Systems Reliability, Maintainability and Safety, pp. 124-128.
[18] Bertocci, F., Mugnaini, M., Fort, A., Vignoli, V., Spicciarelli, L. “Reliability and availability of industrial bakery plant: Modeling and analysis. A case study” (2016) 14th IMEKO TC10 Workshop on Technical Diagnostics 2016: New Perspectives in Measurements, Tools and Techniques for Systems Reliability, Maintainability and Safety, pp. 135-140.
[19] Fort, A., Mugnaini, M., Vignoli, V., Gaggii, V., Pieralli, M. “Fault tolerant design of a field data modular readout architecture for railway applications” (2015) Reliability Engineering and System Safety, 142, pp. 456-462.
[20] Addabbo, T., Fort, A., Mugnaini, M., Vignoli, V. “Gas turbine sensor loop availability driven fall back strategies design” (2015) Conference Record - IEEE Instrumentation and Measurement Technology Conference, 2015-July, art. no. 7151343, pp. 641-645.
[21] Stove, A.G.; Linear FMCW radar techniques (Radar and Signal Processing, IEE Proceedings F, Volume 139,Issue 5, Oct. 1992, pp.343-350).
[22] Richards, M.A. Fundamental of Radar Signal Processing, 2nd ed.; McGraw-Hill: New York, NY, USA, 2014.
[23] M. I. Skolnik, “Introduction to radar systems,” In Electrical Engineering Series, McGraw-Hill International Editions, 1980.