Genome of
Bactrocera minax
(Diptera: Tephritidae)
Bin Zhang1, Francesco Nardi4, Helen Hull-Sanders5, Xuanwu Wan3, Yinghong Liu2*
1 Key Lab of Integrated Pest Management of Shandong Province, College of Agronomy and Plant Protection, Qingdao Agricultural University, Qingdao, China, 2 Chongqing Key Laboratory of Entomology and Pest Control Engineering, College of Plant Protection, Southwest University, Chongqing, China, 3 Sichuan Plant
Protection Station, Chengdu, China,4 Department of Evolutionary Biology, University of Siena, Siena, Italy, 5 Department of Entomology, Pennsylvania State University,
University Park, Pennsylvania, United States of America
Abstract
The complete 16,043 bp mitochondrial genome (mitogenome) of Bactrocera minax (Diptera: Tephritidae) has been sequenced. The genome encodes 37 genes usually found in insect mitogenomes. The mitogenome information for B. minax was compared to the homologous sequences of Bactrocera oleae, Bactrocera tryoni, Bactrocera philippinensis, Bactrocera carambolae, Bactrocera papayae, Bactrocera dorsalis, Bactrocera correcta, Bactrocera cucurbitae and Ceratitis capitata. The analysis indicated the structure and organization are typical of, and similar to, the nine closely related species mentioned above, although it contains the lowest genome-wide A+T content (67.3%). Four short intergenic spacers with a high degree of conservation among the nine tephritid species mentioned above and B. minax were observed, which also have clear counterparts in the control regions (CRs). Correlation analysis among these ten tephritid species revealed close positive correlation between the A+T content of zero-fold degenerate sites (P0FD), the ratio of nucleotide substitution frequency at P0FDsites to all degenerate sites (zero-fold degenerate sites, two-fold degenerate sites and four-fold degenerate sites) and amino acid sequence distance (ASD) were found. Further, significant positive correlation was observed between the A+T content of four-fold degenerate sites (P4FD) and the ratio of nucleotide substitution frequency at P4FDsites to all degenerate sites; however, we found significant negative correlation between ASD and the A+T content of P4FD, and the ratio of nucleotide substitution frequency at P4FDsites to all degenerate sites. A higher nucleotide substitution frequency at non-synonymous sites compared to non-synonymous sites was observed in nad4, the first time that has been observed in an insect mitogenome. A poly(T) stretch at the 59 end of the CR followed by a [TA(A)]n-like stretch was also found. In addition, a highly conserved G+A-rich sequence block was observed in front of the poly(T) stretch among the ten tephritid species and two tandem repeats were present in the CR.
Citation: Zhang B, Nardi F, Hull-Sanders H, Wan X, Liu Y (2014) The Complete Nucleotide Sequence of the Mitochondrial Genome of Bactrocera minax (Diptera: Tephritidae). PLOS ONE 9(6): e100558. doi:10.1371/journal.pone.0100558
Editor: Kostas Bourtzis, International Atomic Energy Agency, Austria
Received November 16, 2013; Accepted May 29, 2014; Published June 25, 2014
Copyright: ß 2014 Zhang et al. This is an open-access article distributed under the terms of the Creative Commons Attribution License, which permits unrestricted use, distribution, and reproduction in any medium, provided the original author and source are credited.
Funding: This work was supported in part by the Taishan Mountain Scholar Constructive Engineering Foundation of Shandong, China and the Startup Fund for Distinguished Scholars (No. 631316) supported by Qingdao Agricultural University, China. The funders had no role in study design, data collection and analysis, decision to publish, or preparation of the manuscript.
Competing Interests: The authors have declared that no competing interests exist. * Email: [email protected]
Introduction
The family Tephritidae, generally known as ‘‘true’’ fruit flies, includes 471 genera and 4257 species distributed throughout the temperate and tropical areas of the world. Many species are of critical importance to man either as pests of fruit and vegetable crops or as beneficial species for the control of weeds [1]. The fruit fly Bactrocera minax Enderlein (Diptera: Tephritidae), generally known as the Chinese citrus fruit fly, has been a serious pest of commercial citrus crops in China for more than half a century [2]. This species has been recorded in southern China, India (West Bengal and Sikkim) and Bhutan [2,3] wild and cultivated citrus species [4]. Some hosts are endemic to southern China and the eastern Himalayan region [5] but B. minax has been reported on the kumquat Fortunella crassifolia [6] and the boxthorn Lycium chinense [2].
B. minax was first collected from India and Sikkim and designated B. minax Enderlein [1]. Drew [3] provided a detailed
description and illustration of the B. minax type specimens collected in 1920 and assigned the species to the genus Bactrocera (Polistomimetes). White and Wang [7] designated a lectotype of B. minax and assigned the species to the Bactrocera (Tetradacus); in addition, they indicated that Bactrocera citri Chen, collected from China in 1940, should be placed in synonymy with B. minax.
A wide variety of questions about the biology and phylogeny of B. minax have been addressed with the aid of molecular tools. These studies could have used two main sources of genetic data; namely, nuclear sequence data and, most frequently, mitochon-drial sequence data. Insect mitochonmitochon-drial DNA (mtDNA) usually occurs as a double-stranded closed circular molecule, ranging in size from 14–20 kb and generally encoding 13 protein-coding genes (PCGs), two ribosomal RNAs (rRNAs) and 22 transfer RNA (tRNAs), which is conserved across bilaterian metazoans with only a few exceptions (e.g. loss of a small number of genes in some derived groups) [8]. The molecule contains at least one sequence of variable length known as the A+T-rich region or control region
Table 1. Summary of primers used for complete mtgenome of B. minax amplification. Fragment Upper primer Sequence Location Down primer Sequence L ocation F ragment Length F1 F1-Ur GCTAATTAAGCTACTGGGTTC AT 155–177 F1-Dr T GTTCCTACTATTCC GGCTCA 1539–1560 1 406 F2 F2-Ur T ACAATCTATCGCCTAAA CTTCAGCC 1442–1468 F2-Ds T AGGCACGAGTATC T ACATCTAT 2357–2379 9 38 F3 F3-Us GATTCTTTGGACACCCAGAA 2175–2194 F3-Ds ATTCATAACTTCAAT ATCATTG 3383–3406 1 232 F4 F4-Ur A TGGCAGATTAGTGCAAT GG 3016–3035 F4-Dr G TTTAAGAGACCAG TACTTG 3789–3810 7 95 F5 F5-Ur GAAATTTGCGGGGCTAATCAT AG 3670–3692 F5-Dr GAGGTCATATAGCT CCCAGTTCAAT 5072–5096 1 427 F6 F6-Ur A TCAGCTGTTGCTATTATTCA 4 670–4690 F6-Dr ACTGTAAAAAAT AACCCTTGTG 5223–5245 5 76 F7 F7-Ur G TAACATTAGGATAACGG TGAGGAA 4967–5991 F7-Ds T GCAATAAATCG CTTCATATTCT 6027–6049 1 083 F8 F8-Us T ATCGGCCTATACCAGG AAGGA 5908–5929 F8-Dr GATCAAGGTTGGT CAGAA 6543–6560 6 53 F9 F9-Ur AATTACCCTAACATCTTCA GTG 6 355–6376 F9-Ds T ATCTAATCGGATT GGAGATGT 7684–7705 1 351 F10 F10-Ur GCTCTCTTAGTTATAGCTGC 7546–7565 F10-Ds GGTAAGCATTAGT CTGGTT 8783–8801 1 256 F11 F11-Us ACAAAACAAACCTGACGAA C 8 600–8619 F11-Ds T AGTAGAATGAAT CTTTTTATA 9215–9236 6 37 F12 F12-Us GGGGCCTCAACATGAGCCCT 8913–8932 F12-Ds T TTACAACTGCG ATTAGGGT 10422–10441 1529 F13 F13-Us AGGAGGTATATTAGTTCTATTC A 1 0139–10161 F13-Ds GCAAATAGGAAGTA TCATTC 11297–11314 1176 F14 F14-Us AGCAACAGCATTCATAGGAT A 1 0858–10878 F14-Ds C TTTACCTCGTTTTC GTTATGAT 11802–11824 967 F15 F15-Ur ACATGAATTGGAGCACGAC CAGT 11492–11511 F15-Dr G TGGCTTTTTTAACTC T TTTGGAACG 12556–12579 1088 F16 F16-Ur TAGAATTAGAAGATCAGCC AGC 12254–12275 F16-Ds ACTTTAGGGATAAC AGCGTA 12960–12979 726 F17 F17-Us TTCTAATACCTGGTCCTTTC 12757–12776 F17-Ds CGTTTATTAGGGTAT CTGGTTT 13713–13736 980 F18 F18-Ur ATGTTTTTGTTAAACAGGCG 13360–13379 F18-Dr AGACTAGGATTAGA TACCCTATTAT 14555–14574 1215 F19 F19-Us TACAGGACAGGTTCCTC T G 1 4458–14476 F19-Ds GCGTGTATTTTTGCT TATTTA 14826–14845 388 F20 F20-Ur AGGGTATCTAATCCTAGTTT 14557–14576 F20-Dr AGTGATTAGGGTTCCT GTTATTA 254–275 1 762 F21 F21-Us ACTCCTACTACTTTAGCGTT 1 4618–14637 F1-Dr T GTTCCTACTATTCC GGCTCA 1539–1560 2 986 Note: Lowercase ‘‘r’’ behind some primer names represents these primers were designed o n b asis of Simon et al. (1994); L owercase ‘‘r’’ behind some pri mer names represents these primers were d esigned b y u s. doi:10.1371/jou rnal.pone.0100558.t001
(CR), which contains initiation sites for transcription and replication [9] and ranges in size from tens to several thousands of base pairs [10–13]. As the results of highly conservative gene structures among phyla, maternal inheritance, high copy number and relatively fast evolution rates compared to nuclear DNA [14], mitochondrial genome (mitogenome) sequences have been re-garded as useful molecular markers in studies focusing on comparative and evolutionary genomics, molecular evolution, phylogenetics, phylogeography and population genetics [15].
Many complete or nearly complete mitogenomes have been sequenced and comparative analyses at the genus or species level
have used multiple complete mitochondrial genes instead of one or partial genes, including molecular systematics [16–20], population genetics/phylogeography [16], diagnostics [21], molecular evolu-tionary studies [13,22,23], the frequency and type of gene rearrangements [24,25] and the evolution of genome size [26]. To date, more than 500 insect mitogenomes have been sequenced from all orders, including 77 dipterans in 24 families, and are available in Genbank. In this study, we sequenced the complete sequence of the mitogenome of B. minax (Diptera: Tephritidae).
Genbank contains information for only ten Tephritidae species; Bactrocera oleae, Bactrocera tryoni, Bactrocera philippinensis, Bactrocera
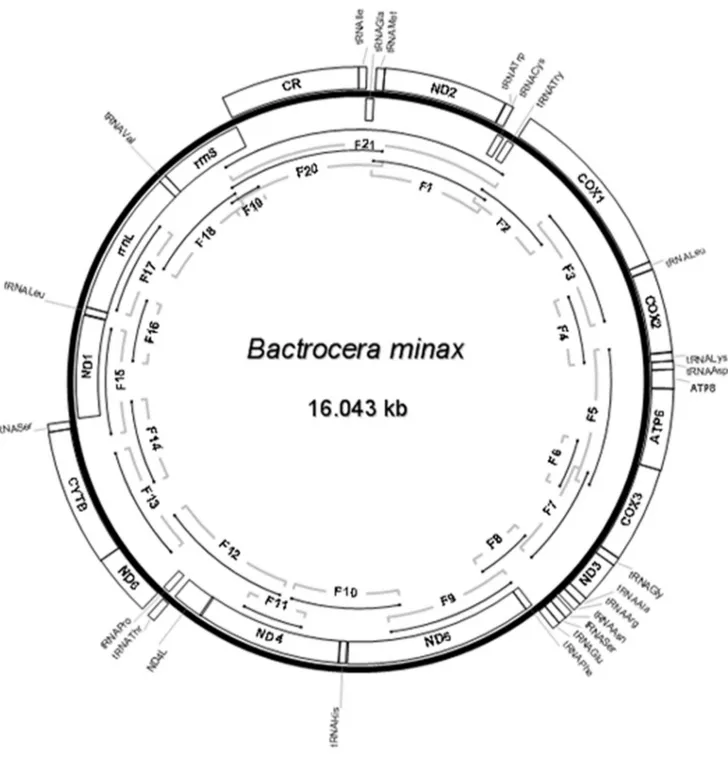
Figure 1. Circular map of the mitogenome ofB. minax. The genes located outside adjoined the bold line circle (J-strand) indicated that the
direction of transcription is opposite to the genes located inside adjoined the bold line circle (N-strand). B. minax complete mitogenome was jointed using 21 (F1–F21) fragments shown as single lines within the bold line circle.
carambolae, Bactrocera papayae, Bactrocera dorsalis, Bactrocera correcta, Bactrocera cucurbitae, Ceratitis capitata and B. minax. Nine of these species belong to the genus Bactrocera, including four species of the B. dorsalis species complex; the other species belongs to the genus Ceratitis. Within the nine Bactrocera species, B. philippinensis, B. carambolae, B. papayae and B. dorsalis belong to the B. dorsalis species complex, B. correcta, B. cucurbitae and B. tryoni belong to other species-groups within the subgenus Bactrocera, and B. oleae and B. minax belong to the subgenus Daculus and Tetradacus, respectively. Although recent molecular evidence suggests B. papaya, B. philippinensis and B. dorsalis likely represent one species [27–30],
with anticipation of the analysis of the B. minax mitogenome, we compare the sequence and mitogenome origins to the tephritid species B. oleae, B. dorsalis, B. philippinensis, B. carambolae, B. papayae, B. correcta, B. cucurbitae B. tryoni and C. capitata.
Materials and Methods
1. Insect and mtDNA extraction, protein-coding genes and sequencing
We collected B. minax adults from a citrus garden on private land at Xianli Zeng covering an area of 20 hectares in Wulong Table 2. Summary of B. minax mitogenome.
Gene Direction Location Size IGS Anticodon Start code Stop code
trnI F 1–65 65 0 GAT
trnQ R 66–134 69 10 TTG
trnM F 145–213 69 21 CAT
nad2 F 213–1235 1023 8 ATT TAG
trnW F 1244–1311 68 28 TCA trnC R 1304–1365 62 42 GCA trnY R 1408–1475 68 22 GTA cox1 F 1474–3009 1536 21 TCG TAT trnL(UUR) F 3009–3072 65 5 TAA
cox2 F 3078–3764 687 6 ATG TAA
trnK F 3771–3841 71 21 CTT
trnD F 3841–3908 68 0 GTC
atp8 F 3909–4070 162 27 ATT TAA
atp6 F 4064–4741 678 21 ATG TAG
cox3 F 4741–5532 792 6 ATG TAA
trnG F 5539–5604 66 0 TCC nad3 F 5605–5956 352 0 GTC T trnA F 5957–6021 65 5 TGC trnR F 6027–6090 64 28 TCG trnN F 6119–6183 65 0 GTT trnS(AGN) F 6184–6251 68 2 GCT trnE F 6254–6319 66 18 TTC trnF R 6338–6403 66 21 GAA nad5 R 6403–8122 1720 14 ATT T trnH R 8137–8201 65 4 GTG
nad4 R 8206–9546 1341 217 ATG TAA
nad4l R 9530–9826 297 2 ATG TAA
trnT F 9829–9893 65 0 TGT
trnP R 9894–9959 66 2 TGG
nad6 F 9962–10483 522 21 ATG TAA
cob F 10483–11619 1137 22 ATG TAG
trnS(UCN) F 11618–11684 67 16 TGA nad1 R 11701–12640 940 10 ATA T trnL(CUN) R 12651–12716 66 0 TAG rrnL R 12717–14049 1333 21 trnV R 14049–14120 72 0 TAC rrnS R 14121–14902 782 0 CR 14903–16043 1141 0 doi:10.1371/journal.pone.0100558.t002
(Chongqing Province, China). We confirm that Mr Zeng, the owner of this land, allowed us to conduct the study on this site. No specific permission was required for this location and our activity. We confirm the field studies did not involve endangered or protected species. B. minax adults were stored at 25uC in 99% (v/v) ethanol. Morphological identification was done according to White and Wang [7]. Total DNA was isolated from three adult specimens using the DNeasy Blood & Tissue kit (QIAGEN) according to the manufacturer’s instructions. The whole B. minax mitogenome sequence was assembled from a single individual (three repeats). Purified total DNA was used as a template for amplification of the entire B. minax mitogenome in 21 overlapping pieces, ranging in size from 388 bp to 1762 bp. PCR primers were designed as described [31] and by comparison to the available sequences of B. oleae, B. dorsalis, B. philippinensis, B. carambolae, B. papayae, B. correcta, B. cucurbitae B. tryoni and C. capitata (Table 1). Amplification was done in a thermocycler (Eppendorf Mastercy-cler 5333) in 50ml reactions containing 5ml of 25 mM MgCl2, 5ml of 106PCR Buffer (Mg2+ free), 8ml of a dNTP mixture (2.5 mM each), 3ml of 10mM each primer, 0.5ml of 5 U/ml Taq polymerase (Takara Biomedical, Japan) and 2ml of a 1/10 dilution of the DNA extract. Amplification conditions were: 59 of pre-PCR denaturation at 94uC followed by 34 cycles of 30 s at 94uC, 1 min at 40–58uC (depending on the primer pair) and 2 min at 72uC. The F21 fragment (Fig. 1) was amplified using LA Taq (Takara Biomedical, Japan) and a cycle consisting of a pre-PCR denaturation at 96uC for 2 min followed by 30 cycles of 10 s at 98uC and 2 min at 58uC with a final elongation step of 10 min at 72uC. PCR products were separated by electrophoresis and purified using a QIAquick Gel Extraction Kit (QIAGEN). PCR products were sequenced directly on both strands using amplifi-cation and additional ad hoc primers as needed. Individual sequences were combined in a consensus contig using DNAStar package software (DNAStar Inc.).
2. Sequence analysis and gene annotation
Genes encoded on the B. minax mitogenome were located initially by comparison to homologous full-length insect mito-chondrial sequences using DNAStar. Nucleotide sequences of PCGs were translated using the invertebrate mtDNA genetic code. tRNA genes were identified initially using tRNAscan-SE Search Server version 1.21 (available online at http://lowelab.ucsc.edu/
tRNAscan-SE/) [32] and refined using tRNAscan-SE and RNAshapes [33]. The presence and secondary structures of tRNA genes that could not be located by tRNAscan-SE owing to variant morphology were annotated manually by comparison to the sequences of other insect tRNAs [34–37]. Codon usage analysis and relative synonymous codon usage (RSCU) in PCGs were calculated using CodonW version 1.4.2 (John Peden, available at http://codonw.sourceforge.net/index.html) [38]. Potential sec-ondary structure folds of non-coding sequences and sequences in the CR were calculated with the DNA mfold web server using default settings (http://mfold.bioinfo.rpi.edu/cgi-bin/dna-form1. cgi) [39]. The presence of tandem repeats in the CR was investigated using the Tandem Repeats Finder available online (http://tandem.bu.edu/trf/trf.html) [40]. The A+T content and nucleotide substitution frequency at synonymous sites and non-synonymous sites (the number of non-synonymous substitutions per site and the number of non-synonymous substitutions per site) were calculated on the basis of the data using MEGA 4.0 [41]. The correlation analysis was done by the bivariate method using SPSS version 13 (SPSS Inc., Chicago, IL). The overall average amino acid distance among each of the PCGs from ten tephritid species (B. minax, B. oleae, B. tryoni B. dorsalis B. philippinensis, B. carambolae, B. papayae, B. correcta, B. cucurbitae and C. capitata) were calculated by the method of Poisson distances by MEGA 4.0 [41]. The complete B. minax mtDNA sequence was deposited in Genbank under accession no. HM776033.
Results and Discussion 1. Genome organization
The mitochondrial genome of B. minax is a closed circular molecule of 16043 bp; hence, it is longer than the other nine tephritid mitogenomes available (range 15,815 bp in B. oleae to 15,980 bp in C. capitata) but is still well within the range of other insect mitogenomes (14,503 bp in Rhopalomyia pomum [42] to 19517 bp in Drosophila melanogaster [11]). The gene content is typical of metazoan mitogenomes, with 13 PCGs (cox1-3, cob, nad1-6, nad4l, atp6 and atp8), 22 tRNAs and two genes for ribosomal RNA subunits (rrnS and rrnL). A long uninterrupted non-coding region of 1141 bp, likely homologous to the insect A+T-rich region, is present between rrnS and trnI, corresponding to position 14,903 to 16,043 in the annotated sequence. The gene order in the Table 3. Length and base composition of different genomic regions in 10 tephritid species, B. oleae, B. tryoni, B. philippinensis, B. carambolae, B. papaya, B. dorsalis, C. capitata, B. minax, B. correcta and B. curcubitae.
Accession No. and speices Whole mtDNA PCGs tRNAs rRNAs CR
Size (A+T)% Size (A+T)% Size (A+T)% Size (A+T)% Size (A+T)%
AY210702 B. oleae 15815 72.6 11188 70.1 1484 75.1 2116 77.1 949 86.9 HQ130030 B. tryoni 15925 72.5 11186 69.6 1467 75.0 2115 77.7 951 87.0 DQ995281 B. philippinensis 15915 73.6 11192 71.1 1466 75.3 2114 77.7 949 88.2 EF014414 B. carambolae 15915 73.6 11190 71.2 1466 75.1 2113 77.6 950 87.9 DQ917578 B. papayae 15915 73.5 11190 71.0 1465 75.1 2114 77.7 950 88.2 DQ 845759 B. dorsalis 15915 73.6 11185 71.2 1467 75.2 2123 77.8 949 88.1 AJ242872 C. capitata 15980 77.5 11272 75.5 1472 76.8 2123 80.2 1004 91.1 HM776033 B. minax 16043 67.3 11187 64.3 1466 72.2 2115 73.7 1141 77.6 JX456552 B. correcta 15936 73.2 11192 71.2 1470 75.3 2117 77.9 949 78.6 JN635562 B. curcubitae 15825 72.8 11190 70.7 1467 75.1 2110 77.8 946 82.3 doi:10.1371/journal.pone.0100558.t003
Table 4. Relative synonymous codon usage of 10 tephritid species, 10 tephritid species, B. oleae , B. tryoni , B. philippinensis , B. carambolae , B. papaya , B. dorsalis , C. capitata , B. minax , B. correcta and B. curcubitae . Amino acid Codon B. minax B. dorsalis B . oleae B . tryoni C . capitata B. philippinensis B. carambolae B. papaya B. correcta B. curcubitae All J N A ll J N All J N A ll J N All J N A ll J N All J N A ll J N All J N A ll J N Phe UUU 1.37 1.06 1.69 1.52 1.37 1.73 1.48 1.25 1.77 1.44 1.31 1.72 1.68 1.67 1.79 1.51 1.36 1.73 1.50 1.35 1.72 1.51 1.36 1.73 1.48 1.39 1.81 1.46 1.34 1.69 UUC 0.63 0.94 0.31 0.48 0.63 0.27 0.52 0.75 0.23 0.56 0.69 0.28 0.32 0.33 0 .21 0 .49 0.64 0.27 0.50 0.65 0.28 0 .49 0.64 0.27 0.52 0.61 0.19 0.54 0.66 0.31 Leu UUA 2.11 1.41 2.52 2.76 2.44 3.27 2.70 2.44 3.07 2.50 2.07 2.94 3.62 4.00 4.04 2.78 2.51 3.25 2.84 2.52 3.28 2.79 2.52 3.27 2.70 2.29 3.42 2.93 2.68 3.20 UUG 1.09 0.38 2.03 0.84 0.30 1.33 0.85 0.31 1.60 0.89 0.24 1.44 0.74 0.36 0 .88 0 .81 0.30 1.28 0.86 0.33 1.36 0 .86 0.33 1.37 0.67 0.31 0.89 0.78 0.46 1.32 CUU 0.98 1.23 0.72 1.10 1.59 0.77 0.98 1.14 0.81 1.08 1.62 0.79 0.87 0.87 0 .70 1 .08 1.56 0.77 1.11 1.59 0.77 1 .07 1.53 0.70 1.03 1.48 0.72 0.98 1.49 0.68 CUC 0.46 0.83 0.18 0.21 0.30 0.08 0.35 0.48 0.05 0.31 0.38 0.06 0.13 0.15 0 .03 0 .19 0.26 0.08 0.16 0.23 0.08 0 .19 0.24 0.11 0.30 0.34 0.25 0.26 0.25 0.12 CUA 0.96 1.81 0.36 0.79 1.15 0.40 0.89 1.40 0.34 0.94 1.33 0.53 0.44 0.54 0 .21 0 .80 1.12 0.43 0.73 1.07 0.32 0 .77 1.13 0.38 1.03 1.30 0.58 0.84 0.98 0.62 CUG 0.39 0.36 0.18 0.30 0.23 0.16 0.23 0.22 0.13 0.28 0.36 0.24 0.19 0.08 0 .13 0 .34 0.26 0.19 0.31 0.26 0.19 0 .32 0.26 0.19 0.29 0.27 0.14 0.21 0.14 0.06 Ile AUU 1.42 1.23 1.83 1.72 1.66 1.84 1.56 1.50 1.87 1.59 1.61 1.77 1.77 1.72 1.83 1.71 1.67 1.83 1.73 1.69 1.85 1.70 1.64 1.81 1.70 1.65 1.83 1.52 1.51 1.61 AUC 0.58 0.77 0.17 0.28 0.34 0.16 0.44 0.50 0.13 0.41 0.39 0.23 0.23 0.28 0 .17 0 .29 0.33 0.17 0.27 0.31 0.15 0 .30 0.36 0.19 0.30 0.35 0.17 0.48 0.49 0.39 Met AUA 1.33 1.45 1.20 1.37 1.46 1.42 1.41 1.46 1.37 1.43 1.43 1.51 1.53 1.44 1.69 1.38 1.47 1.45 1.40 1.44 1.46 1.38 1.45 1.41 1.49 1.43 1.52 1.48 1.40 1.56 AUG 0.67 0.55 0.80 0.63 0.54 0.58 0.59 0.54 0.63 0.57 0.57 0.49 0.47 0.56 0 .31 0 .62 0.53 0.55 0.60 0.56 0.54 0 .62 0.55 0.59 0.51 0.57 0.48 0.52 0.60 0.44 Val GUU 1.46 0.63 2.09 1.52 1.14 2.04 1.41 0.74 2.29 1.55 1.32 1.94 2.31 2.10 2.50 1.59 1.19 2.11 1.64 1.23 2.15 1.63 1.28 2.11 1.75 1.47 2.20 1.67 1.43 2.03 GUC 0.48 0.77 0.18 0.44 0.42 0.30 0.39 0.63 0.25 0.52 0.49 0.56 0.27 0.07 0 .39 0 .41 0.42 0.30 0.34 0.35 0.31 0 .38 0.36 0.30 0.24 0.42 0.12 0.46 0.35 0.42 GUA 1.25 1.88 0.93 1.49 2.23 1.09 1.70 2.40 0.96 1.42 1.71 1.06 1.13 1.63 0 .83 1 .41 2.13 0.99 1.45 2.22 0.97 1 .39 2.15 0.95 1.56 1.84 1.22 1.59 2.07 1.13 GUG 0.81 0.72 0.81 0.55 0.21 0.57 0.51 0.23 0.50 0.52 0.49 0.44 0.30 0.20 0 .28 0 .59 0.26 0.60 0.57 0.20 0.57 0 .60 0.21 0.65 0.45 0.26 0.46 0.28 0.15 0.42 Ser UCU 1.29 0.96 2.19 1.66 1.20 2.13 1.61 1.43 1.97 2.14 1.48 2.29 2.02 1.59 2.06 1.67 1.20 2.13 1.62 1.13 2.16 1.70 1.21 2.13 1.94 1.28 2.59 1.92 1.50 1.99 UCC 1.17 1.14 0.31 0.65 0.63 0.35 0.85 0.76 0.36 0.48 0.43 0.34 0.56 0.74 0 .24 0 .63 0.63 0.40 0.64 0.63 0.35 0 .59 0.55 0.35 0.62 0.59 0.29 0.69 0.72 0.53 UCA 1.35 1.26 0.66 1.81 1.93 0.86 1.48 1.53 1.07 1.68 1.88 0.95 1.67 1.69 1.24 1.74 1.88 0.86 1.81 1.95 0.82 1.74 1.89 0.86 1.68 1.84 1.00 1.57 1.57 1.11 UCG 0.53 0.29 0.31 0.46 0.31 0.23 0.46 0.28 0.36 0.40 0.40 0.22 0.28 0.23 0 .12 0 .44 0.29 0.23 0.40 0.26 0.18 0 .47 0.32 0.23 0.38 0.26 0.18 0.47 0.40 0.12 Pro CCU 1.33 1.43 1.93 1.78 1.35 3.33 1.85 1.65 2.75 1.61 1.46 1.86 2.09 1.82 2.59 1.89 1.44 3.11 1.84 1.45 3.16 1.79 1.41 3.53 1.72 1.49 2.30 1.67 1.78 2.06 CCC 1.23 1.17 1.19 0.85 1.14 0.22 0.79 0.95 0.50 0.96 1.15 1.29 0.27 0.57 0 .00 0 .74 1.00 0.44 0.80 1.05 0.21 0 .84 1.10 0.24 0.89 1.06 0.48 0.90 0.85 0.77 CCA 1.30 1.25 0.59 1.33 1.47 0.44 1.09 1.12 0.75 1.27 1.27 0.71 1.45 1.51 1 .41 1 .33 1.48 0.22 1.25 1.41 0.63 1 .26 1.37 0.24 1.29 1.29 1.09 1.27 1.30 0.90 CCG 0.14 0.16 0.30 0.04 0.04 0.00 0.27 0.28 0.00 0.16 0.12 0.14 0.18 0.10 0 .00 0 .04 0.08 0.22 0.10 0.08 0.00 0 .11 0.12 0.00 0.10 0.16 0.12 0.16 0.07 0.26 Thr ACU 1.38 1.29 2.40 1.60 1.32 2.84 1.66 1.39 2.53 1.42 1.26 2.17 1.65 1.41 2.07 1.62 1.34 2.84 1.58 1.31 2.78 1.61 1.34 2.92 1.48 1.36 2.38 1.48 1.33 1.53 ACC 1.03 1.08 0.46 0.66 0.71 0.21 0.70 0.77 0.40 0.71 0.77 0.43 0.60 0.60 0 .41 0 .65 0.71 0.32 0.69 0.73 0.22 0 .64 0.71 0.22 0.70 0.64 0.48 0.72 0.70 0.77 ACA 1.29 1.33 0.69 1.52 1.67 0.74 1.45 1.68 0.80 1.55 1.73 0.96 1.52 1.65 1.38 1.52 1.67 0.63 1.48 1.66 0.78 1 .53 1.67 0.76 1.61 1.78 0.95 1.50 1.68 1.36 ACG 0.29 0.29 0.46 0.22 0.30 0.21 0.19 0.16 0.27 0.33 0.25 0.43 0.24 0.33 0 .14 0 .20 0.28 0.21 0.26 0.30 0.22 0 .22 0.28 0.11 0.21 0.22 0.19 0.30 0.29 0.34 Ala GCU 1.43 0.97 2.27 2.16 1.66 2.87 2.02 1.39 3.31 1.81 1.40 2.70 2.42 2.41 2.40 2.04 1.71 2.63 2.12 1.77 2.44 2.14 1.69 2.84 1.98 1.68 2.47 2.48 2.11 3.09 GCC 1.33 1.95 0.24 0.71 1.03 0.00 0.88 1.28 0.11 0.92 1.14 0.54 0.28 0.29 0 .23 0 .82 0.91 0.32 0.73 0.91 0.39 0 .74 0.96 0.11 0.53 0.68 0.34 0.74 1.06 0.34 GCA 0.68 0.77 0.71 1.02 1.26 0.72 1.03 1.28 0.46 1.09 1.30 0.54 1.21 1.24 1 .03 1 .02 1.26 0.84 1.00 1.20 0.88 1 .01 1.24 0.84 1.29 1.42 0.85 0.63 0.72 0.34 GCG 0.56 0.31 0.78 0.12 0.06 0.41 0.08 0.06 0.11 0.17 0.16 0.22 0.08 0.06 0 .34 0 .12 0.11 0.21 0.15 0.11 0.29 0 .12 0.11 0.21 0.20 0.21 0.34 0.15 0.11 0.23 Tyr UAU 1.31 1.13 1.76 1.58 1.40 1.81 1.44 1.25 1.83 1.46 1.39 1.70 1.58 1.46 1.82 1.53 1.36 1.73 1.56 1.38 1.77 1.56 1.38 1.76 1.51 1.33 1.75 1.40 1.35 1.75
Table 4. Cont. Amino acid Codon B. minax B. dorsalis B . oleae B . tryoni C . capitata B. philippinensis B. carambolae B. papaya B. correcta B. curcubitae All J N A ll J N All J N A ll J N All J N A ll J N All J N A ll J N All J N A ll J N UAC 0.69 0.87 0.24 0.42 0.60 0.19 0.56 0.75 0.17 0.54 0.61 0.30 0.42 0.54 0 .18 0 .47 0.64 0.27 0.44 0.62 0.23 0 .44 0.62 0.24 0.49 0.67 0.25 0.60 0.65 0.25 Stop UAA 1.11 1.45 1.07 1.17 1.76 0.94 1.19 1.73 1.07 1.28 1.69 1.33 1.36 1.76 1.09 1.17 1.75 0.98 1.18 1.76 0.98 1.18 1.75 1.00 1.21 1.81 1.57 1.27 1.71 1.36 UAG 0.89 0.55 0.93 0.83 0.24 1.06 0.81 0.27 0.93 0.72 0.31 0.67 0.64 0.24 0 .91 0 .83 0.25 1.02 0.82 0.24 1.02 0.82 0.25 1.00 0.79 0.19 0.43 0.73 0.29 0.64 His CAU 1.04 1.02 1.78 1.27 1.22 1.88 1.46 1.37 2.00 1.23 1.18 1.30 1.57 1.55 1.87 1.33 1.30 1.88 1.29 1.22 1.87 1.30 1.22 1.88 1.22 1.13 1.57 1.45 1.18 1.64 CAC 0.96 0.98 0.22 0.73 0.78 0.13 0.54 0.63 0.00 0.78 0.82 0.70 0.42 0.45 0 .13 0 .67 0.70 0.13 0.71 0.78 0.13 0 .70 0.78 0.13 0.78 0.87 0.43 0.55 0.82 0.36 Gln CAA 1.33 1.79 1.33 1.19 1.74 1.33 1.38 1.82 1.47 1.35 1.73 1.49 1.45 1.83 1.68 1.28 1.80 1.38 1.25 1.80 1.38 1.25 1.80 1.38 1.40 1.75 1.48 1.39 1.80 1.65 CAG 0.67 0.21 0.67 0.81 0.26 0.67 0.62 0.18 0.53 0.65 0.27 0.51 0.55 0.17 0 .32 0 .72 0.20 0.63 0.75 0.20 0.63 0 .75 0.20 0.63 0.60 0.25 0.52 0.61 0.20 0.35 Asn AAU 1.22 1.14 1.74 1.44 1.36 1.68 1.45 1.33 1.75 1.42 1.36 1.55 1.66 1.57 1.80 1.46 1.40 1.63 1.46 1.39 1.68 1.42 1.37 1.63 1.41 1.39 1.43 1.39 1.36 1.59 AAC 0.78 0.86 0.26 0.56 0.64 0.32 0.55 0.67 0.25 0.58 0.64 0.45 0.34 0.43 0 .20 0 .54 0.60 0.38 0.54 0.61 0.32 0 .58 0.63 0.38 0.59 0.61 0.57 0.61 0.64 0.41 Lys AAA 1.30 1.57 0.78 1.26 1.52 0.97 1.37 1.65 0.97 1.45 1.56 1.52 1.46 1.65 1.42 1.26 1.51 0.97 1.25 1.51 1.06 1.26 1.51 1.00 1.46 1.45 1.23 1.47 1.53 1.35 AAG 0.70 0.43 1.22 0.74 0.48 1.03 0.63 0.35 1.03 0.55 0.44 0.48 0.54 0.35 0 .58 0 .74 0.49 1.03 0.75 0.49 0.94 0 .74 0.49 1.00 0.54 0.55 0.77 0.53 0.47 0.65 Asp GAU 1.26 0.94 1.42 1.44 1.29 1.70 1.54 1.40 1.79 1.42 0.94 1.75 1.63 1.41 2.00 1.47 1.29 1.78 1.41 1.35 1.64 1.41 1.29 1.64 1.46 1.38 1.39 1.46 1.25 1.59 GAC 0.74 1.06 0.58 0.56 0.71 0.30 0.46 0.60 0.21 0.58 1.06 0.25 0.37 0.59 0 .00 0 .53 0.71 0.22 0.59 0.65 0.36 0 .59 0.71 0.36 0.54 0.63 0.61 0.54 0.75 0.41 Glu GAA 1.22 2.00 1.00 1.43 2.00 1.62 1.38 2.00 1.28 1.37 1.85 1.38 1.34 1.93 1.56 1.39 2.00 1.48 1.44 2.00 1.62 1.44 2.00 1.60 1.56 2.00 1.76 1.29 2.00 1.19 GAG 0.78 0.00 1.00 0.57 0.00 0.38 0.62 0.00 0.72 0.63 0.15 0.62 0.66 0.07 0 .44 0 .61 0.00 0.52 0.56 0.00 0.38 0 .56 0.00 0.40 0.44 0.00 0.24 0.71 0.00 0.81 Cys UGU 1.47 1.00 1.46 1.47 1.14 1.55 1.60 1.03 1.77 1.40 1.10 1.61 1.50 1.12 1.73 1.48 1.20 1.56 1.47 1.18 1.54 1.44 1.14 1.50 1.48 1.14 1.74 1.52 1.03 1.76 UGC 0.53 1.00 0.54 0.53 0.86 0.45 0.40 0.97 0.23 0.60 0.90 0.39 0.50 0.88 0 .27 0 .52 0.80 0.44 0.53 0.82 0.46 0 .56 0.86 0.50 0.52 0.86 0.26 0.48 0.97 0.24 Trp UGA 1.25 1.49 1.00 1.47 1.47 1.42 1.47 1.57 1.23 1.44 1.46 1.35 1.63 1.53 1.41 1.47 1.48 1.43 1.48 1.53 1.33 1.53 1.53 1.43 1.61 1.50 1.64 1.66 1.46 1.42 UGG 0.75 0.51 1.00 0.53 0.53 0.58 0.53 0.43 0.77 0.56 0.54 0.65 0.37 0.47 0 .59 0 .53 0.52 0.57 0.52 0.47 0.67 0 .47 0.47 0.57 0.39 0.50 0.36 0.34 0.54 0.58 Arg CGU 1.33 0.84 1.71 0.82 0.60 1.87 1.00 0.60 1.56 0.85 0.78 0.80 1.25 1.20 1 .67 0 .68 0.42 1.43 0.62 0.49 1.33 0.74 0.50 1.75 0.98 0.72 1.47 1.19 0.98 1.20 CGC 0.56 0.90 0.19 0.36 0.80 0.00 0.17 0.68 0.00 0.31 0.52 1.07 0.00 0.27 0 .00 0 .39 0.95 0.00 0.44 0.98 0.22 0 .37 0.90 0.00 0.27 0.72 0.21 0.37 0.73 0.20 CGA 1.39 1.61 0.95 2.09 1.90 1.07 2.00 1.87 1.11 2.00 1.74 1.07 2.13 1.87 2.00 2.15 1.89 1.14 2.13 1.76 1.33 2.14 1.90 1.00 1.87 1.85 1.26 1.70 1.55 2.00 CGG 0.72 0.65 1.14 0.73 0.70 1.07 0.83 0.85 1.33 0.85 0.96 1.07 0.63 0.67 0 .33 0 .78 0.74 1.43 0.80 0.78 1.11 0 .74 0.70 1.25 0.89 0.72 1.05 0.74 0.73 0.60 Ser AGU 1.15 1.17 1.78 1.15 1.25 1.55 1.07 1.17 1.31 0.92 1.08 1.17 1.07 1.10 1.35 1.19 1.28 1.61 1.17 1.29 1.52 1.17 1.29 1.55 1.10 1.30 1.53 1.04 1.20 1.46 AGC 0.70 1.11 0.46 0.65 0.91 0.52 0.78 1.15 0.48 0.84 1.08 0.84 0.72 0.95 0 .65 0 .66 0.92 0.46 0.68 0.92 0.58 0 .68 0.95 0.52 0.78 0.97 0.53 0.63 0.95 0.35 AGA 0.94 0.99 1.27 1.01 0.81 1.55 1.00 0.74 1.91 0.92 0.73 1.57 1.00 0.72 1.65 1.04 0.84 1.50 1.00 0.82 1.52 1.02 0.82 1.55 0.88 0.72 1.41 1.04 0.80 1.93 AGG 0.86 1.08 1.02 0.61 0.96 0.81 0.76 0.94 0.54 0.63 0.93 0.62 0.70 0.97 0 .71 0 .63 0.97 0.81 0.68 1.00 0.88 0 .64 0.97 0.81 0.64 1.05 0.47 0.63 0.87 0.53 Gly GGU 0.89 0.40 1.42 1.06 1.00 1.39 1.06 0.83 1.28 0.93 0.98 1.13 1.26 0.74 1.73 1.18 1.01 1.48 1.14 0.97 1.41 1.14 1.01 1.35 1.10 0.92 1.33 1.53 1.51 1.68 GGC 0.43 0.53 0.41 0.11 0.15 0.27 0.37 0.54 0.20 0.22 0.24 0.24 0.20 0.32 0 .18 0 .08 0.15 0.22 0.11 0.15 0.27 0 .11 0.15 0.27 0.18 0.05 0.27 0.18 0.24 0.23 GGA 1.07 1.89 0.49 1.93 2.35 1.44 1.47 2.00 0.99 1.51 2.05 0.84 2.01 2.79 1.13 1.95 2.43 1.37 1.96 2.46 1.41 1.92 2.38 1.41 2.16 2.67 1.53 1.53 1.84 1.22 GGG 1.61 1.19 1.68 0.90 0.50 0.91 1.10 0.63 1.53 1.34 0.73 1.79 0.53 0.16 0 .96 0 .79 0.41 0.93 0.79 0.41 0.92 0 .84 0.46 0.97 0.56 0.36 0.87 0.76 0.42 0.87 Note: ‘‘All’’ represents the relative synonymous codon usage for all PCGs, ‘‘J’’ represents the relative synonymous codon usage for the PCGs on major ity strand, ‘‘N’’ represents the relative synonymous codon usage for the PCGs on minority strand. The bold numbers represent the highest relative synonymous codon usage for each kind o f a mino acid. doi:10.1371/jou rnal.pone.0100558.t004
B. minax mitogenome corresponds to the typical and plesiomorphic state hypothesized for the Pancrustacea, and is shared with all tephritids analyzed to date (Fig. 1).
Genes in the B. minax mitogenome overlap by a total of 43 bp, distributed in 12 segments from 1 to 17 bp long and are separated by a total of 178 bp dispersed in 16 intergenic spacers from 2 to 42 bp (without taking the tRNA-like sequence into account; Table 2). Despite its relatively large size, the B. minax mitogenome has more overlapping sequences between genes compared to those of other tephritids; genes overlap by a total of 35 bp at 11 boundaries in B. oleae, 29 bp in seven locations in B. tryoni, 27 bp in five locations in B. dorsalis, 34 bp in ten locations in B. philippinensis, 32 bp in nine locations in B. carambolae, 34 bp in ten locations in B. papayae, 35 bp in 11 locations in B. correcta, 32 bp in nine locations in B. cucurbitae and only 3 bp at three boundaries in C. capitata.
2. Nucleotide composition
The overall base composition of B. minax is 38.0% A, 11.2% G, 29.3% T and 21.5% C. Similar to other insect sequences, the B. minax mitogenome nucleotide composition is biased toward adenine and thymine (67.3% A+T), which is the lowest value among the tephritid mitogenomes available. Analyzed separately,
all PCGs (64.3%), tRNAs (72.2%), sRNAs (73.7%) and CR (77.6%) have the lowest A+T content compared to the other known tephritid mitogenomes (Table 3).
Considering the two strands separately, the PCGs on the Majority strand (J-strand, nine PCGs are located on this strand) (61.5%) have a lower A+T content compared to the Minority strand (N-strand, the other four PCGs are located on this strand) (68.9%). Furthermore, PCGs encoded on the J-strand have a comparable content of A (31.0%) and T (30.5%), whereas PCGs on the N-strand show a strong bias for T content (46.3%) compared to A content (22.6% A). The above situation has been observed in the other tephritid mitogenomes available (data not shown) and in other insects [34–37,43–50]. However, tRNAs on the two opposite strands have nearly equal A+T contents, which has been found in the other nine tephritid species. For three PCG codon positions, the third codon positions have significantly higher A+T content than the first and second codon positions owing to genetic code degeneracies. In particular, T in each codon position of PCGs on the N-strand is over-represented. With exception of the second codon position over-representing T, however, the first and third codon positions of PCGs show a preponderance of A on
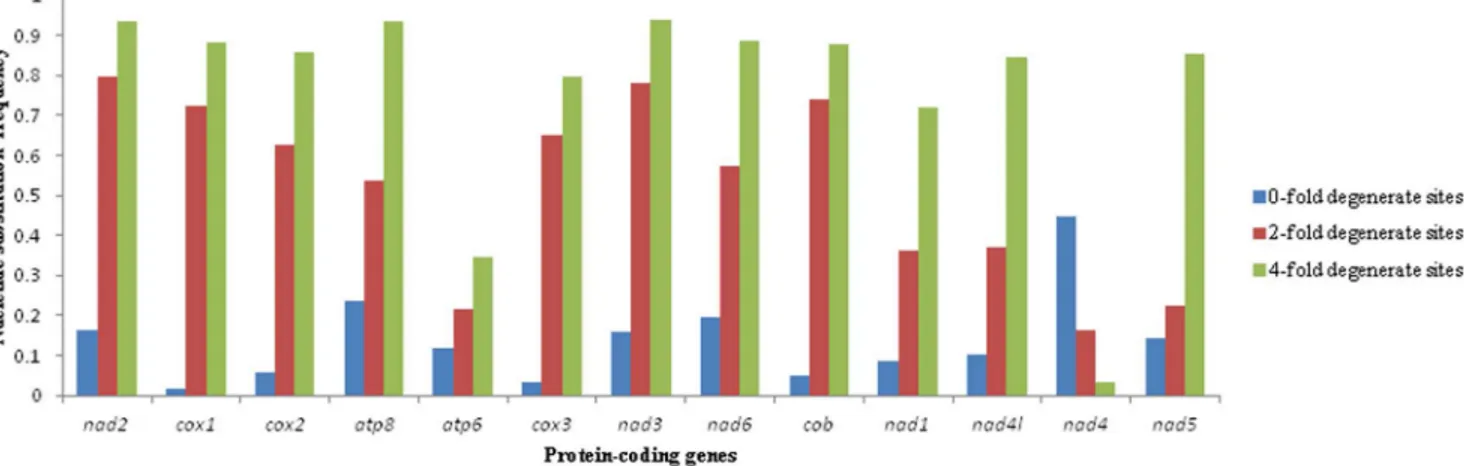
Figure 2. The AT content percentage of 0-fold degenerate sites, 2-fold degenerate sites and 4-fold degenerate sites in each
protein-coding gene of mitochondrial genomes of 10 tephritid species,B. oleae,B. tryoni,B. philippinensis,B. carambolae,B. papaya,B. dorsalis,
C. capitata,B. minax,B. correctaandB. curcubitae. The black line with short line on the top of each bar represents the standard deviation value
(SD).
doi:10.1371/journal.pone.0100558.g002
Figure 3. The nucleotide substitution frequency at 0-fold degenerate sites, 2-fold degenerate sites and 4-fold degenerate sites in
each protein-coding gene of mitochondrial genomes of 10 tephritid species,B. oleae,B. tryoni,B. philippinensis,B. carambolae,B.
papaya,B. dorsalis,C. capitata,B. minax,B. correctaandB. curcubitae.
the J-strand and T on the N-strand, which is similar to many insect mitogenomes [34–37,43–50] (Table 3).
The base compositional bias for A+T in PCGs is reflected in the relative synonymous codon usage statistics of the B. minax mitogenome (Table 4). With the exception of amino acid His, codons with A or T in the third codon position are generally strongly over-represented compared to codons terminating with either G or C. The ratio of G+C-rich (Pro, Ala, Arg and Gly) codons to A+T-rich codons (Phe, Ile, Met, Tyr, Asn and Lys) in B. minax PCGs was 0.44, which is higher compared to the other nine tephritids B. dorsalis (0.29), B. philippinensis (0.29), B. carambolae (0.30), B. papayae (0.29), B. correcta (0.30), B. cucurbitae (0.32), B. oleae (0.31), B. tryoni (0.32) and C. capitata (0.23). This demonstrates the amino acid composition is affected by the lower A+T mutational bias in B. minax (67.3%) and the stronger A+T mutational bias in B. dorsalis (73.6%), B. philippinensis (73.6%), B. carambolae (73.6%), B. papayae (73.5%), B. correcta (73.2%), B. cucurbitae (72.8%), B. oleae (72.6%), B. tryoni (72.4%) and C. capitata (77.5%).
With the exception of first codon positions, G is under-represented compared to C in coding genes on the J-strand (PCGs, tRNAs, CR and intergenic nucleotides), while the G content is higher compared to C in coding genes on the N-strand (PCGs, tRNAs and rRNAs). This base compositional bias is in line with the general trend in the mitogenome toward a lower G content [51].
Base compositional heterogeneity and among-site rate variation (ASRV) are known to affect phylogenetic inference, resulting in the identification of incorrect phylogenetic relationships [52]. The easiest solution is simply to avoid non-stationary genes [53] but most earlier studies used relatively intuitive mitogenome data partitioning schemes, including by gene type (PCG, rRNA and tRNA), by gene, by codon position, by codon and gene, or by the
strand on which the coding gene is located [15]. Inevitably, different intuitive partitioning schemes can each result in strong conflicting topologies, especially at deeper phylogenetic levels [25,54,55]. Therefore, selection of stationary, reversible composi-tional homogeneous is vital for reliable phylogenetic inference [52,56].
Many earlier studies were focused on the A+T content of different genes or regions to investigate the base compositional heterogeneity and among-site rate variation ASRV [57]. For mitogenomes, composition bias of A+T content was verified in most earlier studies; e.g. A+T content was usually over-represented in non-coding regions [58] and the third codon position generally had stronger A+T composition bias compared to the other two codon positions [59] etc.. We asked how variability between PCGs is related to underlying A+T content and its distribution across synonymous and non-synonymous sites.
In this study, the A+T content of zero-fold sites (P0FD), two-fold (P2FD) and four-fold degenerate sites (P4FD) was determined for each of the PCGs from ten tephritid species (B. minax, B. oleae, B. tryoni B. dorsalis B. philippinensis, B. carambolae, B. papayae, B. correcta, B. cucurbitae and C. capitata) (Fig. 2). Nucleotide substitution frequency was calculated in P0FD, P2FDand P4FDfor each of the PCGs among five tephritid species (Fig. 3). After analyzing the correlation between A+T content and nucleotide substitution frequency for each of the PCGs, we found a significant positive correlation between A+T content percentage of zero-fold degen-erate sites (AT0F) and nucleotide substitution frequency at P0FD (r = 0.735, P = 0.004) as well as between A+T content percentage of four-fold degenerate sites (AT4F) and nucleotide substitution frequency at P4FD (r = 0.864, P = 0.000) (Table 5). Correlation analysis indicated there is a significant positive correlation between AT0F and ASD (r = 0.752, P = 0.003), ASD and the nucleotide Table 5. A+T content percentage and nucleotide substitution frequency at 0-fold degenerate sites (P0FD), 2-fold degenerate sites (P2FD) and 4-fold degenerate sites (P4FD) (the number of substitutions per P0FD, P2FDand P4FDsite)in each PCG of mtgenome of 10 tephritid species, B. oleae, B. tryoni, B. philippinensis, B. carambolae, B. papaya, B. dorsalis, C. capitata, B. minax, B. correcta and B. curcubitae. Protein-coding genes P0FD P2FD P4FD A+T percentage (%) nucleotide substitution frequency A+T percentage (%) nucleotide substitution frequency A+T percentage (%) nucleotide substitution frequency nad2 70.9661.41 0.198 74.6168.66 0.811 74.33610.99 1.689 cox1 56.5360.21 0.025 73.3168.55 0.743 84.9367.82 1.409 cox2 59.7160.74 0.074 76.9267.67 0.624 82.4768.64 1.306 atp8 68.9260.81 0.235 81.5468.66 0.577 83.33611.86 1.400 atp6 68.7662.92 0.459 63.36.62.91 0.227 62.4666.84 0.590 cox3 57.4660.36 0.034 75.1065.61 0.655 87.3464.95 1.266 nad3 68.3861.05 0.192 76.61610.74 0.831 82.1268.50 1.485 nad6 72.5961.44 0.265 80.1268.60 0.655 87.6864.11 1.326 cob 61.6260.42 0.057 68.6669.26 0.741 81.1466.72 1.417 nad1 65.5460.53 0.094 88.3362.51 0.381 73.7261.09 1.090 nad4l 71.4461.44 0.107 87.9464.12 0.397 83.4668.32 1.154 nad4 76.4263.72 0.783 77.4961.86 0.172 41.7260.73 0.004 nad5 66.3361.23 0.172 85.7764.83 0.313 85.1865.45 1.234 Correlation coefficient (r) 0.735 20.217 0.864 Confidence probability (P) 0.004,0.01 0.477.0.05 0.000,0.01
Note: the correlation analysis used Pearson coefficient under two-tailed test of significance. doi:10.1371/journal.pone.0100558.t005
Table 6. The A + T content percentage of 0-fold degenerate sites (AT 0F ), the nucleotide substitution number of 0-fold degenerate sites/the nucleotide substitution number of all degenerate sites (R0F/all ) and the mean genetic distance based on amino acid sequence (ASD) in each protein-coding gene of mitochondrial genomes of 10 tephritid species, B. oleae , B. tryoni , B. philippinensis , B. carambolae , B. papaya , B. dorsalis , C. capitata , B. minax , B. correcta and B. curcubitae , and the correlation coefficient between them (AT 0F ,R 0F/all and ASD). Protein-coding genes AT 0F AT 4F R0F/all R4F/al l ASD AT 0F &R 0F/all AT 0F & ASD R0F/all & ASD AT 4F &R 4F/all AT 4F & ASD R4F/all & ASD nad2 70.96 6 1.41 74.33 6 10.99 0.290 0 .362 0.117 r = 0 .760, P = 0.003 , 0.01 r = 0.752, P = 0.003 , 0.01 r = 0.983, P = 0.000 , 0.01 r = 0 .809, P = 0 .001 , 0.01 r = 2 0.828, P = 0 .000 , 0.01 r = 2 0.970, P = 0 .000 , 0.01 cox1 56.53 6 0.21 84.93 6 7.82 0.046 0 .606 0.014 cox2 59.71 6 0.74 82.47 6 8.64 0.148 0 .514 0.036 atp8 68.92 6 0.81 83.33 6 11.86 0.400 0 .350 0.164 atp6 68.76 6 2.92 62.46 6 6.84 0.780 0 .141 0.280 cox3 57.46 6 0.36 87.34 6 4.95 0.068 0 .552 0.014 nad3 68.38 6 1.05 82.12 6 8.50 0.300 0 .350 0.105 nad6 72.59 6 1.44 87.68 6 4.11 0.417 0 .297 0.168 cob 61.62 6 0.42 81.14 6 6.72 0.106 0 .497 0.029 nad1 65.54 6 0.53 73.72 6 1.09 0.222 0 .449 0.052 nad4l 71.44 6 1.44 83.46 6 8.32 0.244 0 .385 0.053 nad4 76.42 6 3.72 41.72 6 0.73 0.936 0 .004 0.382 nad5 66.33 6 1.23 85.18 6 5.45 0.357 0 .431 0.083 Note: the correlation a nalysis used Pearson coefficient u nder two-tailed test of significance. The A + T content p ercentage o f 4 -fold degenerate sites (AT 4F ), the nucleotide substitution number o f 0 -fold degenerate sites/the nucleotide substitution number of all degenerate sites (R4F/all ) a nd the m ean g enetic distance b ased on amino acid sequence (ASD) in each protein-coding gene of mitochondrial genomes o f 1 0 tephritid species above, and the correlation coefficient bet ween them (AT 4F ,R 4F/all and ASD). doi:10.1371/journal.pone. 0100558.t006
substitution number of zero-fold degenerate sites/the nucleotide substitution number of all degenerate sites (R0F/all) (r = 0.983, P = 0.000), AT0F and R0F/all (r = 0.760, P = 0.003) (Table 6). Interestingly, the significant positive correlation was observed between AT4Fand the nucleotide substitution number of four-fold degenerate sites/the nucleotide substitution number of all degen-erate sites (R4F/all) (r = 0.809, P = 0.001); however, there was significant negative correlation between AT4F and ASD (r = 2 0.828, P = 0.000), between R4F/all and ASD (r = 20.970, P = 0.000) (Table 6). On the basis of the above results, we can hypothesize divergence at the amino acid level of less well conserved PCGs is due to higher A+T at P0FDin those genes and/ or lower A+T at P4FD. On the basis of this result, when we choose which PCGs are used to analyze phylogenic relationships for different evolutionary time scales, the A+T content of P0FDand/or P4FDof PCGs could be useful to judge the homogenesis of PCGs. Nucleotide substitution is considered to be a reflection of evolution at the molecular level. Many earlier studies indicated the substitution was directional bias across different genes in the mitogenome [15]. Some researchers have proposed variation of A+T% among taxa is associated with directional mutation pressure and has a phylogenetic component [57,60,61]. In this study, with the exception of nad4, all PCGs had significantly lower variation of A+T content among the ten tephritid species at P0FD compared to both P2FDand P4FDsites. We observed that, with the exception of nad4, P0FD sites had lower nucleotide substitution frequency compared to both P2FDand P4FDsites (Fig. 3). The P0FD of nad4 had a higher nucleotide substitution frequency (0.783) compared to both P2FD(0.172) and P4FD(0.004), and the R0F/all was 0.936. As a result of functional constraints, the number of nucleotide substitution per non-synonymous site is usually lower than that per synonymous site [62]. In this study, a higher nucleotide substitution frequency at P0FD of nad4 indicates the non-synonymous nucleotide substitution frequency was higher compared to the synonymous sites for this gene. Higher number of nucleotide substitution per non-synonymous site has been observed at the variable-region genes of immunoglobulins [63]
and some genes of the histocompatibility complex [64] but this is the first reported occurrence in the mitogenome.
3. Protein-coding genes
With the exception of cox1 and nad3, all protein coding genes start with an ATN codon, with ATG used in cox2, atp6, cox3, nad4, nad4l, nad6 and cob, ATT in nad2, atp8 and nad5 and ATA in nad1. Genes for cox1 and nad3 used TCG and GTC as initiation codons, respectively. The initiation codon for cox1 was TCG(S) in B. minax, which was observed in other Diptera species [54]. GTC being the initiation codon for nad3 was a new observation in tephritids, but it is common in other insects [65].
With the exception of nad3, nad5 and nad1, all PCGs are terminated by complete stop codons: TAG is used for nad2, atp6 and cob, TAA is used for cox2, atp8, cox3, nad4, nad4l and nad6 and TA is used for cox1. The remaining genes, nad3, nad5 and nad1, are terminated by incomplete stop codons ‘‘T’’.
4. Transfer RNA genes, ribosomal RNA genes and tRNA-like structure
All of 22 tRNA genes typical of metazoan mitogenomes were identified in the B. minax mitogenome, and the predicted structures are shown in Fig. 4. All tRNAs display a typical clover-leaf secondary structure, except for trnS(AGN), where the DHU arm appears to be replaced by seven unpaired nucleotides, a feature typical of other animal mitochondria [66]. Nuclear magnetic resonance analysis of the tertiary structure of nematode trnS(AGN)) suggested such aberrant tRNA can fit the ribosome by adjusting its structural conformation and function in a way similar to that of usual tRNAs in the ribosome [67].
Like most insect tRNAs, all B. minax tRNAs have a length of 7 bp for the anticodon loop, 7 bp for the acceptor stem and 5 bp for anticodon stem. Most of the size variability in the B. minax tRNA genes originated from length variation in the DHU arms (loop size 4–9 bp, stem size 3–4 bp) and the TYC arms (loop size 2–9 bp, stem size 3–5 bp); in addition, trnA and trnH contained U-U mismatches. trnS(UCN)encodes an A–C mismatch, trnH encodes
Figure 4. Predicated secondary clover-leaf structures for the 22 tRNA genes ofB. minax. The tRNAs are labled with abbreviation of their
corresponding amino acids below each tRNA gene structure. Arms of tRNAs (clockwise from top) are the amino acid acceptor arm, TYC arm, the anticodon arm, and dihydrouridine (DHU) arm. (A) J-strand coding tRNAs. (B) N-strand coding tRNAs.
doi:10.1371/journal.pone.0100558.g004
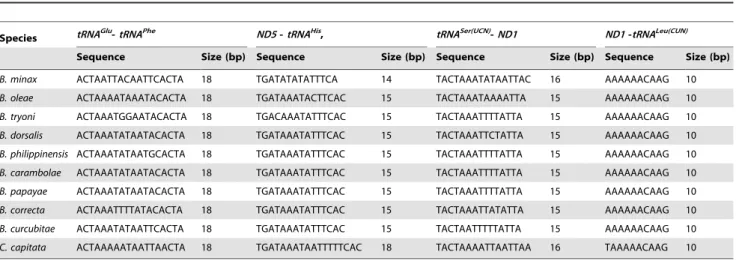
Table 7. Locations, length and sequences of four shorter intergenic spacers in 10 tephritid species, B. oleae, B. tryoni, B. philippinensis, B. carambolae, B. papaya, B. dorsalis, C. capitata, B. minax, B. correcta and B. curcubitae.
Species tRNAGlu-tRNAPhe ND5 - tRNAHis, tRNASer(UCN)-ND1 ND1 -tRNALeu(CUN)
Sequence Size (bp) Sequence Size (bp) Sequence Size (bp) Sequence Size (bp)
B. minax ACTAATTACAATTCACTA 18 TGATATATATTTCA 14 TACTAAATATAATTAC 16 AAAAAACAAG 10
B. oleae ACTAAAATAAATACACTA 18 TGATAAATACTTCAC 15 TACTAAATAAAATTA 15 AAAAAACAAG 10
B. tryoni ACTAAATGGAATACACTA 18 TGACAAATATTTCAC 15 TACTAAATTTTATTA 15 AAAAAACAAG 10
B. dorsalis ACTAAATATAATACACTA 18 TGATAAATATTTCAC 15 TACTAAATTCTATTA 15 AAAAAACAAG 10
B. philippinensis ACTAAATATAATGCACTA 18 TGATAAATATTTCAC 15 TACTAAATTTTATTA 15 AAAAAACAAG 10
B. carambolae ACTAAATATAATACACTA 18 TGATAAATATTTCAC 15 TACTAAATTTTATTA 15 AAAAAACAAG 10
B. papayae ACTAAATATAATACACTA 18 TGATAAATATTTCAC 15 TACTAAATTTTATTA 15 AAAAAACAAG 10
B. correcta ACTAAATTTTATACACTA 18 TGATAAATATTTCAC 15 TACTAAATTATATTA 15 AAAAAACAAG 10
B. curcubitae ACTAAATATAATTCACTA 18 TGATAAATATTTCAC 15 TACTAATTTTTATTA 15 AAAAAACAAG 10
C. capitata ACTAAAAATAATTAACTA 18 TGATAAATAATTTTTCAC 18 TACTAAAATTAATTAA 16 TAAAAACAAG 10
an A-G mismatch and trnRtrnR has a U-C mismatch in the acceptor stem. Additionally, trnV contains a U-U mismatch in the TYC stem.
Anticodon sequences were the same as in B. dorsalis, B. oleae, B. tryoni and C. capitata, which are considered common for other insects, including Gryllotalpa orientalis [68], Philaenus spumarius [35], Phthonandria atrilineata [50] and Artogeia melete [36].
On the basis of the sequence similarity of B. dorsalis, the two genes coding for the small and the large ribosomal subunits were located in the B. minax mitogenome between trnL(CUN)and trnV and between trnV and the CR region. The length of B. minax rrnS and rrnL was 782 bp and 1333 bp, respectively, similar to B. dorsalis, B. oleae and C. capitata.
5. Intergenic spacers
In B. minax, the two longest intergenic spacers were 42 bp between trnC and trnY and 28 bp between trnR and trnN. In B. dorsalis, the second longest intergenic spacer was 45 bp between trnC and trnY. In B. tryoni, the second longest intergenic spacer was 33 bp between trnR and trnN and the third longest intergenic spacer was 30 bp between trnC and trnY. In B. oleae, the longest intergenic spacer was 28 bp between trnR and trnN. In B. minax, however, only a 10 bp intergenic spacer was observed between trnQ and trnM, which is shorter compared to 66 bp in B. dorsalis, 71 bp in B. tryoni and 47 bp in C. capitata at the same location. Yu et al. [48] reported the 45 bp intergenic spacer located between trnC and trnY in B. dorsalis had a clear counterpart in the CR with the first 33 of 45 bp matching. These counterparts were predicted to form a small internal stem and a long stem structure pairing with the partially complementary sequence in the CR. A similar phenomenon was observed in the B. tryoni mitogenome, where both the second longest (33 bp between trnR and trnN) and the third longest intergenic spacer (30 bp between trnC and trnY) have clear counterparts (32 out of 33 bases and 25 out of 30 bases, respectively) on the N-strand of the CR. These two intergenic spacers have highly significant similarity and their counterparts were located in the same position of the CR. We asked whether the 42 bp intergenic spacer located between trnC and trnY in B. minax had these features. The first 15/42 bp of the spacer have a clear counterpart in the CR at positions 15,670–15,684. The 42 bp of intergenic spacer was predicted to form two stem-loop secondary structures with 4 bp loops and one with a 3 bp stem and the other with a 4 bp stem. The first 15 of the 42 bp formed one of the two structures; a 4 bp stem with a 4 bp loop and a 3 bp flanking sequence. The counterpart in the CR also formed a long stem structure with the neighboring sequence. Yu et al. [48]
compared the 33 bp counterpart in the CR from B. dorsalis with the B. oleae CR and found 25 of the 33 bp were identical. Surprisingly, of the original 33 bases present in the B. minax CR, 23 were identical. Therefore, the results obtained in this study support the hypothesis that the secondary structures of the counterparts in both the intergenic spacer and the CR might have a major role in recombination [48,69].
The four intergenic spacers in B. minax, ISS-1 (18 bp between trnE and trnF), ISS-2 (14 bp between nad5 and tRNAHis), ISS-3 (16 bp between trnS(UCN)and nad1) and ISS-4 (10 bp between nad1 and trnL(CUN)), were observed to be of similar size in the tephritids B. dorsalis, B. philippinensis, B. carambolae, B. papayae, B. correcta, B. cucurbitae, B. oleae and B. tryoni (18 bp, 15 bp, 15 bp and 10 bp) and C. capitata (18 bp, 18 bp, 16 bp and 10 bp) at the same locations. All intergenic spacers were found at the same locations and have highly significant similarity in percentage identity (71.4–100%; Table 7).
Additionally, all four intergenic spacers have clear counterparts in the CR of the ten tephritid species (data not shown) but these intergenic spacers cannot form the secondary structures (even though some can be predicted to form stem-loop structures with 2–3 bp stems). Some earlier studies focused on longer intergenic spacers with potential secondary structure and tried to find original sequences and structures in the CR [48]. Even among the close tephritid species, however, these longer intergenic spacers had significantly different features, including sequence, length and location. Cameron et al. [70] suggested the possibility that stem-loop structures instead of tRNAs in the 39 end of PCGs enhance the rearrangement. Two of four small intergenic spaces locate the 39 end of PCGs without forming stem-loop structures. These results might explain why no rearrangement was found in tephritid species. This is the first report of shorter intergenic spacers with highly conserved sequences and locations among four tephritid species, which should attract more attention to the shorter intergenic spacers, even though the functions of these are not clear.
6. CR
The CR has a high A+T content among the mitochondrial genes of both vertebrates and invertebrates, and the initiation of replication is one of the most interesting features of this region [8]. Zhang and Hewitt [71] proposed conserved structural features on the basis of comparison of the CRs of one dipteran and two orthopteran species. These features include: (1) a poly(T) stretch at the 59 end of the CR; (2) a [TA(A)]n-like stretch after the poly(T) stretch; (3) a highly conserved stem-loop structure; (4) a stem-loop structure with a highly conserved flanking sequence of a TATA
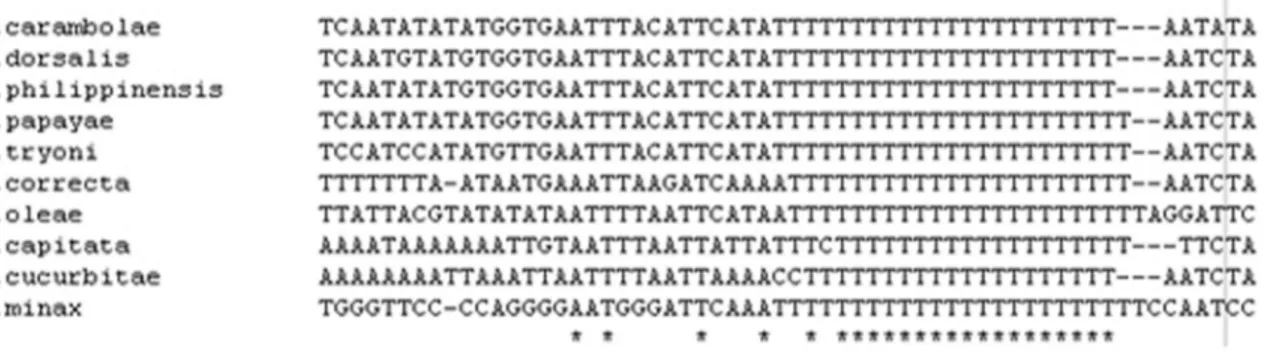
Figure 5. Alignment of the poly-thymidine stretch at the 59 end of the control region described by Zhang et al. (1997) among 10
tephritid species, B. oleae, B. tryoni, B. philippinensis, B. carambolae, B. papaya, B. dorsalis, C. capitata, B. minax, B. correctaand B.
curcubitae. The poly-T stretch runs from nucleotide positions from 15974 to 15997 with respect to the B. minax mitogenome in the direction of 59-39.
consensus at the 59 end and a G(A)nT consensus at the 39 end; and (5) a G+A-rich sequence downstream of the secondary structure. The B. minax CR was found to have three of the five features proposed by Zhang and Hewitt [71].
The CR from four tephritid species, including B. minax, presented a conspicuous poly(T) stretch at the 59 end. This sequence stretch has been found to be conserved within hymenoptera [49]. Further, the poly(T) stretch has been observed to be followed by a [TA(A)]n-like stretch (Fig. 5). Our results suggest that this poly(T) region might be involved in the control of transcription and/or replication, or have some other unknown functions [10]. Additionally, a highly conserved G+A-rich sequence block was found in front of the poly(T) stretch among the four tephritid species and these sequences can be predicted to form secondary structures with a stem-loop. The highly conserved G+A-rich sequence with a poly(T) stretch nearby has been found in other dipteran and orthopteran species [71].
In the B. minax CR, more than ten sequences have the potential to form stem-loop structures with perfect matches and loops of variable size. In addition, several other stem-loop structures with some mismatch in the stems can be predicted. However, obvious
stem-loop structures with conserved flanking sequences were not found in the CR of these ten tephritid species. In addition, The B. minax CR does not contain any tRNA-like sequence, but contains two tandem repeats ranging in size from 33 to 45 bp. The sequence TATTAATTTTATTAAA occurred twice and the sequence CCTTTTAAATTTTCC occurred three times. The two repeats were located at positions from 15,325 to 15,357 and from 15,858 to 15,903, respectively. For other tephritid species, we found one tandem repeat in the CR of B. doraslis, B. correcta, B. curcubitae and C. capitata, two in B. philippinensis and B. carambolae, three in B. oleae and B. papaya but none in B. tryoni.
Acknowledgments
We thank Kostas Bourtzis, Jane Skeltonand the anonymous reviewers whose invaluable critical comments helped greatly to improve this article. Author Contributions
Conceived and designed the experiments: YL. Performed the experiments: BZ. Analyzed the data: BZ. Contributed reagents/materials/analysis tools: FN HH-S XW. Wrote the paper: BZ.
References
1. Thompson FC (1998) Fruit Fly Expert Identification System and Systematic Information Database. The International Journal of the North American Dipterists’ Society. 524p.
2. Wang XJ, Luo LY (1995) Research progress in the Chinese citrus fruit fly. Entomological Knowledge 32: 310–315.
3. Drew RAI (1979) The genus Dacus Fabricius (Diptera: Tephritidae) two new species from northern Australia and a discussion of some subgenera. Australian Journal of Entomology 18: 71–80.
4. Allwood AJ, Chinajariyawong A, Drew RAI, Hamacek EL, Hancock DL, et al. (1999) Host plant records for fruit flies (Diptera: Tephritidae) in South East Asia. The Raffles Bulletin of Zoology Supplement 7: 1–92.
5. Rieger M (2006) Citrus: lemon, lime, orange, tangerine, grapefruit-Citrus spp. Available: http://www.uga.edu/fruit/citrus/html. Accessed 9 February 2006. 6. White IM, Elson-Harris MM (1992) Fruit flies of economic significance: their
identification and bionomics. Wallingford, USA.
7. White IM, Wang XJ (1992) Taxonomic notes on some Dacine (Diptera: Tephritidae) fruit flies associated with citrus, olives, and cucurbits. Bulletin of Entomological Research 82: 275–279.
8. Boore JL (1999) Animal mitochondrial genomes. Nucleic Acids Research 27: 1767–1780.
9. Taanman JW (1999) The mitochondrial genome: structure, transcription, translation and replication. Biochimica et Biophysica Acta (BBA)-Bioenergetics 1410: 103–123.
10. Zhang DX, Szymura JM, Hewitt GM (1995) Evolution and structural conservation of the control region of insect mitochondrial DNA. Journal of Molecular Evolution 40: 382–391.
11. Lewis DL, Farr CL, Kaguni LS (1995) Drosophila melanogaster mitochondrial DNA, completion of the nucleotide sequence and evolutionary comparisons. Insect Molecular Biology 4: 263–278.
12. Inohira K, Hara T, Matsuura ET (1997) Nucleotide sequence divergence in the A+T-rich region of mitochondrial DNA in Drosophila simulans and Drosophila mauritiana. Molecular Biology and Evolution 14: 814–822.
13. Shao R, Campbell NJ, Barker SC (2001) Numerous gene rearrangements in the mitochondrial genome of the wallaby louse, Heterodoxus macropus (Phthiraptera). Molecular Biology and Evolution 18: 858–865.
14. Moriyama EN, Powell JR (1997) Synonymous substitution rates in Drosophila: mitochondrial versus nuclear genes. Journal of Molecular Evolution 45: 378– 391.
15. Cameron SL (2014) Insect mitochondrial genomics implications for evolution and phylogeny. Annual Review of Entomology 59: 95–117.
16. Ma C, Yang P, Jiang F, Chapuis MP, Shali Y, et al. (2012) Mitochondrial genomes reveal the global phylogeography and dispersal routes of the migratory locust. Molecular Ecology 21: 4344–4358.
17. Beckenbach AT (2012) Mitochondrial genome sequences of Nematocera (lower Diptera): evidence of rearrangement following a complete genome duplication in a winter crane fly. Genome Biology and Evolution 4: 89–101.
18. Cameron SL, Miller KB, D’Haese CA, Whiting MF, Barker SC (2004) Mitochondrial genome data alone are not enough to unambiguously resolve the relationships of Entognatha, Insecta and Crustacea sensu lato (Arthropoda). Cladistics 20: 534–557.
19. Wan X, Kim MI, Kim MJ, Kim I (2012) Complete mitochondrial genome of the free-living earwig, Challia fletcheri (Dermaptera: Pygidicranidae) and phylogeny of Polyneoptera. PLoS ONE 7(8): e42056. doi:10.1371/journal.pone.0042056.
20. Nardi F, Spinsanti G, Boore JL, Carapelli A, Dallai R, et al. (2003a) Hexapod origins: monophyletic or paraphyletic?. Science 299: 1887–1889.
21. Nelson LA, Lambkin CL, Batterham P, Wallman JF, Dowton M, et al. (2012) Beyond barcoding: A mitochondrial genomics approach to molecular phyloge-netics and diagnostics of blowflies (Diptera: Calliphoridae). Gene 511: 131–142. 22. Castro LR, Austin AD, Dowton M (2002) Contrasting rates of mitochondrial molecular evolution in parasitic Diptera and Hymenoptera. Molecular Biology and Evolution 19: 1100–1113.
23. Salvato P, Simonato M, Battisti A, Negrisolo E (2008) The complete mitochondrial genome of the bag-shelter moth Ochrogaster lunifer (Lepidoptera: Notodontidae). BMC Genomics 9: 331.
24. Cameron SL, Yoshizawa K, Mizukoshi A, Whiting MF, Johnson KP (2011) Mitochondrial genome deletions and minicircles are common in lice (Insecta: Phthiraptera). BMC Genomics 12: 394.
25. Dowton M, Cameron SL, Dowavic JI, Austin AD, Whiting MF (2009) Characterization of 67 mitochondrial tRNA gene rearrangements in the Hymenoptera suggests that mitochondrial tRNA gene position is selectively neutral. Molecular Biology and Evolution 26: 1607–1617.
26. Shao R, Kirkness EF, Barker SC (2009) The single mitochondrial chromosome typical of animals has evolved into 18 minichromosomes in the human body louse, Pediculus humanus. Genome Research 19: 904–912.
27. Krosch MN, Schutze MK, Armstrong KF, Boontop Y, Boykin LM, et al. (2013) Piecing together an integrative taxonomic puzzle: microsatellite, wing shape and aedeagus length analyses of Bactrocera dorsalis s.l. (Diptera: Tephritidae) find no evidence of multiple lineages in a proposed contact zone along the Thai/Malay Peninsula. Systematic Entomology 38: 2–13.
28. Schutze MK, Krosch MN, Armstrong KF, Chapman TA, Englezou A, et al. (2012) Population structure of s.s., B. papayae and B. philippinensis (Diptera: Tephritidae) in southeast Asia: evidence for a single species hypothesis using mitochondrial DNA and wing-shape data. BMC Evolutionary Biology 12: 130. 29. Jose MS, Leblanc L, Geib SM, Rubinoff D (2013) An evaluation of the species status of Bactrocera invadens and the systematics of the Bactrocera dorsalis (Diptera: Tephritidae) complex. Annals of the Entomological Society of America 106: 684–694.
30. Boykin LM, Schutze MK, Krosch MN, Chomicˇ A, Chapman TA, et al. Multi-gene phyloMulti-genetic analysis of south-east Asian pest members of the Bactrocera dorsalis species complex (Diptera: Tephritidae) does not support current taxonomy. Journal of Applied Entomology in press.
31. Simon C, Frati F, Beckenbach A, Crespi B, Liu H, et al. (1994) Evolution, weighting, and phylogenetic utility of mitochondrial gene sequences and a compilation of conserved polymerase chain reaction primers. Annals of the Entomological Society of America 87: 651–701.
32. Lowe TM, Eddy SR (1997) tRNA-scan-SE: a program for improved detection of transfer RNA genes in genomic sequence. Nucleic Acids Research 25: 955–964. 33. Steffen P, Vob B, Rehmsmeier M, Reeder J, Giegerich R (2006) RNAshapes: an integrated RNA analysis package based on abstract shapes. Bioinformatics 22: 500–503.
34. Stewart JB, Beckenbach AT (2003) Phylogenetic and genomic analysis of the complete mitochondrial DNA sequence of the spotted asparagus beetle Crioceris duodecimpunctata. Molecular Phylogenetics and Evolution 26: 513–526. 35. Stewart JB, Beckenbach AT (2005) Insect mitochondrial genomics: the complete
mitochondrial genome sequence of the meadow spittlebug Philaenus spumarius (Hemiptera: Auchenorrhyncha: Cercopoidae). Genome 48: 46–54.
36. Hong GY, Jiang ST, Yu M, Yang Y, Li F, et al. (2009) The complete nucleotide sequence of the mitochondrial genome of the cabbage butterfly, Artogeia melete (Lepidoptera: Pieridae). Acta Biochimica et Biophysica Sinica 41: 446–455. 37. Song N, Liang AP (2009) The complete mitochondrial genome sequence of
Geisha distinctissima (Hemiptera: Flatidae) and comparison with other hemipteran insects. Acta Biochimica Et Biophysica Sinica 41: 206–216.
38. Wang M, Liu YS, Zhou JH, Chen HT, Ma LN, et al. (2011) Analysis of codon usage in newcastle disease virus. Virus Genes 42: 245–253.
39. Zuker M (2003) Mfold web server for nucleic acid folding and hybridization prediction. Nucleic Acids Research 31: 3406–3415.
40. Benson G (1999) Tandem repeats finder: a program to analyze DNA sequences. Nucleic Acids Research 27: 573–580.
41. Tamura K, Dudley J, Nei M, Kumar S (2007) MEGA4: Molecular evolutionary genetic analysis (MEGA) software version 4.0. Molecular Biology and Evolution 24: 1596–1599.
42. Beckenbach AT, Joy JB (2009) Evolution of the mitochondrial genomes of gall midges (Diptera: Cecidomyiidae): rearrangement and severe truncation of tRNA genes. Genome Biology and Evolution 1: 278–287.
43. Friedrich M, Muqim N (2003) Sequence and phylogenetic analysis of the complete mitochondrial genome of the flour beetle Tribolium castanaeum. Molecular Phylogenetics and Evolution 26: 502–512.
44. Nardi F, Carapelli A, Boore JL, Roderick GK, Dallai R, et al. (2010) Domestication of olive fly through a multi-regional host shift to cultivated olives: Comparative dating using complete mitochondrial genomes. Molecular Phylogenetics and Evolution 57: 678–686.
45. Nardi F, Carapelli A, Dallai R, Frati F (2003b) The mitochondrial genome of the olive fly Bactrocera oleae: two haplotypes from distant geographical locations. Insect Molecular Biology 12: 605–611.
46. Stewart JB, Beckenbach AT (2006) Insect mitochondrial genomics 2: the complete mitochondrial genome sequence of a giant stonefly, Pteronarcys princeps, asymmetric directional mutation bias, and conserved plecopteran A+T-region elements. Genome 49: 815–824.
47. Fenn JD, Cameron SL, Whiting MF (2007) The complete mitochondrial genome sequence of the Mormon cricket (Anabrus simplex: Tettigoniidae: Orthoptera) and an analysis of control region variability. Insect Molecular Biology 16: 239–252.
48. Yu DJ, Xu L, Nardi F, Li JG, Zhang RJ (2007) The complete nucleotide sequence of the mitochondrial genome of the oriental fruit fly, Bactrocera dorsalis (Diptera: Tephritidae). Gene 396: 66–74.
49. Cha SY, Yoon HJ, Lee EM, Yoon MH, Hwang JS, et al. (2007) The complete nucleotide sequence and gene organization of the mitochondrial genome of the bumblebee, Bombus ignites (Hymenoptera: Apidae). Gene 392: 206–220. 50. Yang L, Wei ZJ, Hong GY, Jiang ST, Wen LP (2009) The complete nucleotide
sequence of mitochondrial genome of Phthonandria atrilineata (Lepidoptera: Geometridae). Molecular Biology Reports 36: 1441–1449.
51. Lessinger AC, Martins Junqueira AC, Lemos TA, Kemper EL, da Silva FR, et al. (2000) The mitochondrial genome of primary screwworm fly Cochliomyia hominivorax (Diptera: Calliphoridae). Insect Molecular Biology 9: 521–529. 52. Song H, Sheffield NC, Cameron SL, Miller KB, Whiting MF (2010) When
phylogenetic assumptions are violated: base compositional heterogeneity and among-site rate variation in beetle mitochondrial phylogenomics. Systematic Entomology 35: 429–448.
53. Collins TM, Fedrigo O, Naylor GJ (2005) Choosing the best genes for the job: the case for stationary genes in genome-scale phylogenetics. Systematic Biology 54: 493–500.
54. Cameron SL, Lambkin CL, Barker SC, Whiting MF (2007a) A mitochondrial genome phylogeny of Diptera: whole genome sequence data accurately resolve relationships over broad timescales with high precision. Systematic Entomology 32: 40–59.
55. Fenn JD, Song H, Cameron SL, Whiting MF (2008) A preliminary mitochondrial genome phylogeny of Orthoptera (Insecta) and approaches to maximizing phylogenetic signal found within mitochondrial genome data. Molecular Phylogenetics and Evolution 49: 59–68.
56. Sheffield NC, Song H, Cameron SL, Whiting MF (2009) Nonstationary evolution and compositional heterogeneity in beetle mitochondrial phyloge-nomics. Systematic Biology 58: 381–394.
57. Jermiin LS, Crozier RH (1994) The cytochrome b region in the mitochondrial DNA of the ant Tetraponera rufoniger: sequence divergence in hymenoptera may be associated with nucleotide content. Journal of Molecular Evolution 38: 282–294. 58. Nei M 1987. Molecular Evolutionary Genetics. Columbia University Press, New
York.
59. Sueoka N (1992) Directional mutation pressure, selective constraints, and genetic equilibria. Journal of Molecular Evolution 34: 95–114.
60. Osawa S, Jukes TH, Watanabe K, Muto A (1992) Recent evidence for evolution of the genetic code. Microbiological Reviews 56: 229–264.
61. Jermiin LS, Graur D, Lowe RM, Crozier RH (1994) Analysis of directional mutation pressure and nucleotide content inmitochondrial cytochrome b genes. Journal of Molecular Evolution 39: 160–173.
62. Saccone C, Pesole G, Kadenbach B (1991) Evolutionary analysis of the nucleus-encoded subunits of mammalian cytochrome c oxidase. European Journal of Biochemistry 195: 151–156.
63. Tanaka T, Nei M (1989) Positive darwinian selection observed at the variable-region genes of immunoglobulins. Molecular Biology and Evolution 5: 447–459. 64. Hughes AL, Nei M (1989) Nucleotide substitution at major histocompatibility complex class II loci: evidence for overdominant selection. Proceedings of the National Academy of Sciences 86: 958–962.
65. Cameron SL, Lo N, Bourguignon T, Svenson GJ, Evans TA (2012) A mitochondrial genome phylogeny of termites (Blattodea: Termitoidae): Robust support for interfamilial relationships and molecular synapomorphies define major clades. Molecular Phylogenetics and Evolution 65: 163–173.
66. Wolstenholme DR (1992) Animal mitochondrial DNA: structure and evolution. International Review of Cytology 141: 173–216.
67. Ohtsuki T, Kawai G, Watanabe K (2002) The minimal tRNA: unique structure of Ascaris suum mitochondrial tRNAser-UCU having a short T arm and lacking the entire D arm. FEBS Lett 514: 37–43.
68. Kim I, Cha SY, Yoon MH, Hwang JS, Lee SM, et al. (2005) The complete nucleotide sequence and gene organization of the mitochondrial genome of the oriental mole cricket, Gryllotalpa orientalis (Orthoptera: Gryllotalpidae). Gene 353: 155–168.
69. Stanton DJ, Daehler LL, Moritz CC, Brown WM (1994) Sequences with the potential to form stem-and-loop structures are associated with coding region duplications in animal mitochondrial DNA. Genetics 137: 233–241. 70. Cameron SL, Johnson KP, Whiting MF (2007b) The mitochondrial genome of
the screamer louse Bothriometopus (Phthiraptera: Ischnocera): effects of extensive gene rearrangements on the evolution of the genome. Journal of Molecular Evolution 65: 589–604.
71. Zhang DX, Hewitt GM (1997) Insect mitochondrial control region: a review of its structure, evolution and usefulness in evolutionary studies. Biochemical Systematics and Ecology 25: 99–120.