Research Article
Functionalized Graphene Derivatives: Antibacterial Properties
and Cytotoxicity
Federica Valentini
,
1,2Andrea Calcaterra,
2Vincenzo Ruggiero,
3,4Elena Pichichero,
4Assunta Martino,
4Francesca Iosi,
5Lucia Bertuccini,
5Simonetta Antonaroli,
1Stefania Mardente,
6Alessandra Zicari,
6Emanuela Mari,
6Giulia Iovenitti,
3Gemma Leone,
3Maurizio Botta,
3and Maurizio Talamo
21Department of Chemistry, Tor Vergata University, via della Ricerca Scientifica 1, 00133 Roma, Italy
2
Inuit Foundation, Tor Vergata University, via dell’Archiginnasio snc, 00133 Roma, Italy
3Department of Biotechnologies, Chemistry and Pharmacy, Siena University, Via Aldo Moro2, 53100 Siena, Italy
4Hygeia Lab srl Tor Vergata University, Edificio PP1 c/o, Via della Ricerca Scientifica snc, 00133 Roma, Italy
5Core Facilities Istituto Superiore di Sanità, Viale Regina Elena 299, 00161 Roma, Italy
6Department of Experimental Medicine, Sapienza University of Roma, Viale Regina Elena, 00161 Roma, Italy
Correspondence should be addressed to Federica Valentini; [email protected]
Received 23 August 2018; Revised 28 November 2018; Accepted 3 December 2018; Published 14 February 2019 Academic Editor: Jianbo Yin
Copyright © 2019 Federica Valentini et al. This is an open access article distributed under the Creative Commons Attribution License, which permits unrestricted use, distribution, and reproduction in any medium, provided the original work is properly cited.
In this work, the authors prepared and characterized two different graphene oxides: one chemically synthesized (GO sample) and
the other one electrochemically synthesized (GO(LiCl)). Both samples were fully characterized with atomic force microscopy (AFM),
Raman and Fourier transform infrared (FTIR) spectroscopies, X-ray photo electron spectroscopy (XPS), thermal analysis (TG/DTA), and Z-potential. The antibacterial properties of both graphene oxides were studied using Gram-negative Escherichia coli ATCC 25922 and Gram-positive Staphylococcus aureus ATCC 25923 by spectrophotometer and viable cell count as indirect
and direct methods, respectively. Results demonstrated that the GO(LiCl)exhibited a significant antibacterial activity compared to
GO that showed a bacteriostatic effect on both pathogens. Electron microscopy analysis confirmed the antibacterial effects of both
graphene oxides toward the pathogens, especially working at 80μg/mL, for 24 h. Additional studies were also performed and both
GO samples were not cytotoxic at 2μg/mL toward neuroblastoma cells. Moreover, 2 μg of GO was suitable to carry the minimum
effective dose (5.74 ng/mL) of kinase inhibitor S29 (1-(2-chloro-2-(4-chlorophenyl)ethyl)-N-(4-fluorobenzyl)-1H-pyrazolo[3,4-d] pyrimidin-4-amine), providing negligible side effects related to the S29 treatment (this latter being specifically active on the neuroblastoma cell lines (SK-N-BE(2))).
1. Introduction
One of the most important research field applications for medicine focuses on new therapeutic agents’ delivery tools, with the first aim to improve therapy efficiency. Recent advances in the nanomaterial field provide useful biocom-patible nanostructured materials and nanocomposites, suit-able for drug delivery systems. Among all the innovative materials, graphene derivatives [1] have attracted a great deal of scientific interest in biomedicine and pharmacology
sciences. Graphene, a single layer of sp2-hybridized carbon atoms arranged in a honeycomb two-dimensional (2-D) crystal lattice, exhibits excellent chemical-physical, biochem-ical [2], mechanbiochem-ical, and engineering properties, extremely useful for several applications in sensors [3] and optoelec-tronic devices [4], environmental monitoring tools [5], food quality control [6], and medical devices [7]. With particular regard to thefields of application that include food quality control and medicinefield applications, the antibacterial fea-tures [8] and the biocompatibility properties toward the real Volume 2019, Article ID 2752539, 14 pages
matrixes (as food or normal human cell lines, organic tissue, and blood) represent a key point that nanomaterials must possess. There are several cases of study, described in litera-ture by interesting review articles concerning the improved antibacterial activity [9] and the increased biocompatibility [10] properties, exhibited by the graphene derivatives. These last properties mainly depend on the synthesis routes applied for graphene production [11]. According to this, Valentini et al. [12] recently report about a metal-free green graphene oxide (GO(LiCl)), synthesized by the elec-trochemical exfoliation of micrometric graphite electrodes (2015 patent no. 102015000023739). GO(LiCl) was fully characterized, resulting in antibacterial material, and finally applied for in vitro cellular experiments, to establish its biocompatibility [12]. The novelty of this work consists of a new green chemistry synthetic route (under patent) for the fabrication of GO samples. The latter showed a bacteriostatic activity (if compared with the bactericidal action, exhibited by GO(LiCl)), in the presence of both path-ogens, as the Gram-negative E. coli ATCC 25922 and the Gram-positive S. aureus ATCC 25923. A cytotoxicity assay was performed, in order to identify in GO a new promising nanocarrier for compound S29: 1-(2-chloro-2-(4-chlorophe-nyl)ethyl)-N-(4- fluorobenzyl)-1H-pyrazolo[3,4-d]pyrimidi-n-4-amine, therapeutic agent. The scientific interest on S29 as a therapeutic agent consists of its ability to reduce tumor mass in neuroblastoma xenograft mice models. For this pur-pose, in this study the SK-N-BE(2) neuroblastoma cell lines were used for the cytotoxicity investigation, concerning the S29 therapeutic anticancer agent. S29 shows an unfavorable pharmacokinetic profile, causing a limited use in the treat-ment of cancer. Until now, in literature, liposomes [13] and human serum albumin (HSA) [14] have been applied to improve S29 delivery, biodistribution, and bioavailabil-ity but the concentration of liposomes and HAS nanopar-ticles had to be very high and this leads to significant high cytotoxicity in vitro and in vivo [13, 14] experiments. Instead, in this work, it has been shown that graphene derivatives were not cytotoxic and they could be used at extremely low levels of concentration, if compared with those applied in the presence of liposomes and HAS nano-particles. In particular, according to the results exhibited by the GO samples, this latter seems to be more eligible for S29 delivery.
2. Materials and Methods
2.1. Chemicals. The electrochemically grown graphene oxide sample (labelled as GO(LiCl)) was obtained by a patented synthetic approach, as widely reported in a 2015 patent (no. 102015000023739) and also in reference [12]. For the chem-ical synthesis of the graphene oxide (labelled as GO), a new wet mechanic-chemical exfoliation synthesis was developed by the same authors of this work, and now it is under patent. The other chemicals used in the analysis were purchased from Sigma-Aldrich (USA). All reagents were of analytical grade and used as received without further purification.
The procedure of preparing GO and GO(LiCl)nanosheet dispersions was similar for the cytotoxicity and antibacterial
tests, except that GO suspension was carried out by using phosphate-buffered saline (PBS) for the cytotoxicity analysis and by using a saline solution 0.9% (10 mL) in the case of the antibacterial tests. The finial graphene oxide dispersions were transparent, and they were very well dispersed by son-ication with a polytronic probe, at room temperature. 2.2. Material Characterization. The AFM measurements were performed in air using a Veeco Multiprobe IIIa instrument (Veeco, Santa Barbara, CA, USA). The GO was deposited using an aqueous solution on the mica substrates. The exper-iments were carried out at room temperature (20°C) in tap-ping mode using Si tips with a spring constant of about 40 N/m and a typical curvature radius on the tip of 7 nm. The XPS measurements were carried out using an Omicron DAR 400 Al/Mg Kα nonmonochromatic X-ray source and a
VG-CLAM2 electron spectrometer. GO (1 mg/mL) was very well dispersed in ethanol using an ultrasonic probe and then deposited on the silicon wafer. ζ-potential was determined
by Dynamic Light Scattering (DLS) (Zetasizer Nano ZS90, Malvern Instruments Ltd., Malvern, UK). Graphene oxide samples were diluted in water, providing an optical density (OD) of 0.1 at 420 nm, and then measured at 24°C with a
scattering angle of 90°.ζ-potential measurements were carried
out using folded capillary cells (Malvern). Thermogravimetric analysis was carried out by a Q600 thermogravimetric ana-lyzer (TA Instruments-Waters, USA). Samples (~20 mg) were put in a platinum crucible and heated from 30°C to 700°C, with a rate of 10°C/min, under nitrogen purge gas.
2.3. Cytotoxicity Tests: Cell Culture. The long-term neuro-blastoma cell lines, SH-SY5Y and SK-N-BE(2) (ACC no. 209 and ACC no. 632, respectively), obtained from DSMZ, Braunschweig, Germany, in October 2012, were maintained in RPMI 1640 (Gibco, Grand Island, NY, USA) with or with-out phenol red, supplemented with heat-inactivated 10% FCS containing 2 mM L-glutamine. Preliminary time and concentration course experiments with GO 0.57, 5.74, and 57.4μg/mL were performed in our laboratory in order to
establish the conditions at which GO did not cause cell necrosis. Cell vitality was monitored before each experiment by a trypan blue (Sigma-Aldrich) [15] exclusion assay, in which dead cells are stained and those with intact membranes are not. Briefly, cell viability was determined using the trypan blue exclusion test. SK-N-BE(2) cells (5 × 10⁴/mL) were sus-pended in a 10μL suspension containing trypan blue (0.4%
w/v; Sigma-Aldrich) in phosphate-buffered saline (PBS) and incubated at room temperature for 5 min, followed by exami-nation under a light microscope to determine the percent-age of cells with clear (viable cells) and blue (nonviable cells) cytoplasm.
2.4. Antibacterial Activity. GO or GO(LiCl)(2 mg) were dis-persed in saline solution 0.9% (10 mL) by sonication with a polytronic probe. The suspensions were sterilized by autoclaving, at 121°C for 15 min, before being inoculated with bacteria to reach a final concentration ranging from 20 to 80 μg/mL. Staphylococcus aureus subspecies aureus
ATCC 25922 were purchased from Microbiologics (USA). Tryptic Soy Broth (TSB) was purchased from VWR Prolabo Chemicals (Italy) and prepared as reported in data sheet. Nutrient Agar with NaCl was purchased from BioLife (Italy) and prepared as reported in product information. Saline solution 0.9% (NaCl: VWR Prolabo Chemicals, Italy) was prepared dissolving 9 g of NaCl in 1000 mL of distilled water, sterilized by autoclaving at 121°C for 15 min. E. coli (ATCC
25922) and S. aureus (ATCC 25923) were used to perform viability tests. Bacteria were grown in TSB medium at 37°C
overnight, and cells were collected via centrifugation (4000 rpm for 20 min). The cells were washed three times with sterile saline solution to remove residual macromole-cules and other growth medium constituents. The pellets were then suspended in saline solution at 0.9% [16, 17]. Bac-terial cell suspensions were diluted in NaCl 0.9% to obtain cell samples having an optical density at 600 nm (OD600) at
T
0 corresponding to 107-108 CFU/mL (OD600 = 0.4 for S.
aureus and OD600 = 0.3 for E. coli). Cells were incubated with different concentrations (20, 40, and 80 μg/mL) of GO or GO(LiCl)at 37°C for 4 hours (T1) and 24 hours (T2 ). The untreated samples with E. coli or S. aureus were used as the control. Growth of treated and untreated samples were followed by measuring OD at 600 nm with spectropho-tometer NANOCOLOR UV/VIS II (MACHEREY-NAGEL, Germany), at 1-hour intervals for 6 hours and then after 24 hours of treatment. The viability was evaluated by the colony-counting method. Briefly, bacterial amount at the starting time (T0), after 4 hours of treatment (T1), and after 24 hours (T2) was determined by performing a series of 10-fold cell dilutions (100 μL each) that were spread onto
Nutrient Agar plates and allowed to grow overnight at 37°C. Colonies were counted and compared with those on control plates to calculate the change in cell growth inhibi-tion. The antibacterial activity was expressed as a function of cell viability loss; the loss of cell viability (%) was deter-mined by using the number of colonies found in the exper-imental mixture incubated with GO and the number of colonies found in the “inoculum only,” incubated without GO. All the experiments were done in duplicate, and the average values were reported. For SEM (FE-SEM Quanta Inspect F, FEI, Thermo Fisher Scientific) analysis, a steady state culture of E. coli (ATCC 29522) and S. aureus (ATCC 29523), grown in LB at 37°C o.n., was washed in physiolog-ical saline solution and incubated with GO or GO(LiCl) 80μg/mL, for 8 and 24 hours at 37°C. Successively, samples werefixed with 2.5% glutaraldehyde in 0.1 M sodium caco-dylate buffer and were left to adhere on poly-lysine-treated glass coverslips for 4 hours at room temperature (RT) and
o.n. at 4°C. Then, adhered bacteria were washed and post-fixed with 1% OsO4 in 0.1 M sodium cacodylate buffer for
1 h at RT and dehydrated through a graded series of ethanol solutions (from 30% to 100%), according to reference [18]. For TEM (EM 208S transmission electron microscope, FEI, Thermo Fisher, equipped with the acquisition system Olym-pus MegaView SIS camera, at 100 kV) analysis, the same bacterial cultures were fixed in 2.5% glutaraldehyde, 2% paraformaldehyde, and 2 mM CaCl2in 0.1 M sodium caco-dylate buffer, pH 7.4, overnight at 4°C, and were processed according to Perry and Gilbert [19]. Samples were washed in cacodylate buffer and postfixed with 1% OsO4 in 0.1 M sodium cacodylate buffer for 1 hour at RT, treated with 1% tannic acid for 30 min and rinsed in 1% sodium sulphate, for 10 min. Postfixed specimens were washed, dehydrated through a graded series of ethanol solutions (30–100% etha-nol), and embedded in Agar 100 (Agar Scientific Ltd., UK).
3. Results and Discussion
3.1. Characterization of GO Samples. These two graphene oxide samples were synthesized by a chemical and electro-chemical synthesis pathway, respectively, and fully charac-terized by using AFM, EDAX, and XPS techniques. The
Table1: Chemical-physical parameters and microanalysis of the graphene oxide samples.
Sample Shape Thickness (nm) Area (μm2) Microanalysis % (w/w)
Chemically synthesized GO Rectangular nanosheets No. layers: 2-31 5 ± 0 4 6 × 10⁻²- 0.1 Si, S, Ca, Cr, Fe, Con.d.
Electrochemically synthesized GO Rectangular nanosheets No. layers: 21 2 ± 0 3 0.1-3.0 Si, S, Ca, Cr, Fe, Con.d.
n.d.: not detectable.
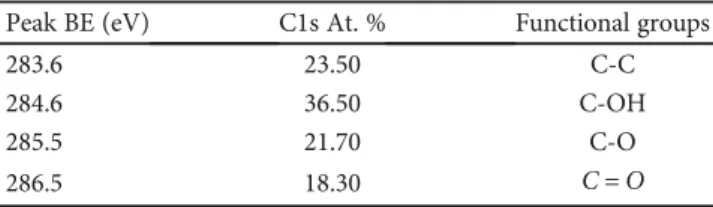
Table2: Binding Energies (BE) and deconvoluted peaks (%) for C1s
of GO.
Peak BE (eV) C1s At. % Functional groups
284.4 59.0 C-C 285.4 16.0 C-OH 286.6 14.0 C-O 287.7 7.0 C= O 289.0 4.0 C(O)O 290.7 2.2 π-π∗
π-π∗: means theπ-bonding orbital and the π∗-antibonding orbital.
Table3: Binding Energies and deconvoluted peaks (%) for C1s of
GO(LiCl).
Peak BE (eV) C1s At. % Functional groups
283.6 23.50 C-C
284.6 36.50 C-OH
285.5 21.70 C-O
main characterization results have been highlighted in Tables 1, 2, and 3. In Table 1, it is possible to recognize that the two kinds of graphene oxide samples were very similar in thickness and number of layers; on the other hand, chem-ically synthesized graphene (GO) had a lower surface area value, if compared with that exhibited by the electrochem-ically synthesized graphene sample (GO(LiCl)). Instead, as regards the content of metals, the microanalysis (EDAX) unequivocally showed that the metal content resulted below the detection limit of the microanalysis technique, indicating that both these GO samples were metal-free graphene-based nanomaterials.
XPS analysis was carried out to study the chemical shift of GO samples. The C1s XPS core level spectrum analysis of GOs with the corresponding quantitative parameters is shown in Table 2 (for GO) and Table 3 (for GO(LiCl)). From Table 2, it is possible to observe that the chemically synthesized graphene oxide sample results are more oxidized, with a greater presence of carbonyl and/or carboxylic functional groups, if compared with those exhibited by the graphene synthesized by the chemical route strategy (see also Table 3). The electro-chemically synthesized graphene sample results in a more reduced C1s chemical shift (i.e., less oxidized if compared to the chemical shift of graphene obtained by chemical synthesis approach).
The functionalization degree and the chemical shift of graphene oxide samples certainly represent very useful
parameters, strictly related to the antibacterial activity and biocompatibility properties. According to the literature [20], the oxygenated functional groups arefirstly responsible for the antibacterial behavior of GO nanosheets. The mech-anism underlying this feature involved the generation of reactive oxygen species (ROS), able to provoke the oxidative stress through an electronic transfer mechanism. Function-alities strictly influence the electronic and/or electron-transfer processes, especially since graphene oxide shows a more insulating profile, when compared with pristine (metallic behavior) and reduced graphene sheets (semicon-ductor-semimetal transitions with reduction). The electro-nic/electron-transfer interaction mechanisms mainly occur between the positively charged Gram-negative E. coli and the negatively charged GO and GO(LiCl), preferentially. In the case of the Gram-positive S. aureus (having negatively charged bacterial walls), the semiconductive properties of GO(LiCl) could provoke a greater electrostatic repulsion (when compared to the insulating GO), because it delivers a greater electron density, toward the negatively charged S. aureus pathogen walls (and the electron-transfer mecha-nism is discussed in detail in Results and Discussion, Section 3 of this paper).
Several authors affirmed that the antibacterial features of nanomaterials are also the result of a complex interac-tion between two main addiinterac-tional factors: size and shape. Liu et al. [21] demonstrated that the antibacterial activity of GO sheets toward E. coli cells is lateral size dependent. Larger GO sheets show stronger antibacterial activity than
smaller ones, and they have different time- and
concentration-dependent antibacterial features. The same authors [21] described that the lateral size-dependent antibacterial properties of GO sheets are caused by nei-ther their aggregation states nor oxidation ability. Large GO sheets more easily cover cells, and cells cannot prolif-erate once fully covered, resulting in the cell viability loss,
experimentally observed in the following
colony-countingtest. In contrast, small GO sheets adhere to the bacterial surfaces, which cannot effectively isolate cells from the environment.
94 96 98 100 102 104 400 800 1200 1600 2000 2400 2800 3200 3600 4000 800 992 1043 1217 1388 1611 2485 2951 3090 3340 T ra n smi tt an ce (%) GO GO(LiCl) Wavenumber (cm−1)
Figure1: FTIR spectra profiles for both GO derivatives.
Table4: Physical properties of the graphene oxide samples.
Sample Weight loss %
(TGA)a Acidic sites (nmol/mg)b Extent of defects (ID/IG)c, Raman GO 0 88 ± 0 23 9 45 ± 0 20 0.42 GO(LiCl) 0 42 ± 0 40 4 02 ± 0 23 0.10
aMean ± SD.bAcidic sites evaluated as described in [29, 30] (Mean ± SD), by volumetric titration.cEvaluated by Raman spectroscopy.
As far as the form is concerned, it is stated in the literature that the geometries/shapes of both nanomaterials and bacteria are fundamental to guarantee the mutual interaction of the two systems. In particular, Akhavan et al. [22] affirmed that the graphene nanoribbons showed much higher cytotoxicity than the graphene sheets. The ROS (Radical Oxygenated Spe-cies) generation and direct contact interaction of the extremely sharp edges of graphene with the membrane of the cells were found as the main mechanisms involved in the cytotoxicity of both shapes of graphene: nanoribbons and nanosheets [22].
Moreover, the shape of the bacteria is also relevant. Hui et al. [23] report about diverse Graphene Quantum Dots (GQDs) with basal planes similar to those of graphene oxide sheets lacking an antibacterial property, which is prepared by rupturing the C60 cage which effectively kills Staphylococcus aureus, including its antibiotic-tolerant persisters, but not Bacillus subtilis, Escherichia coli, or Pseudomonas aeruginosa. The observed activity may correlate with a GQD’s ability to dis-rupt the bacterial cell envelope and is the initial step for cell envelope disruption, suggesting the importance of GQDs’ chemical composition and shapes.
The same parameters (i.e., mainly the functionalization degree, size, and shape/geometries) also influence the bio-compatibility of graphene and GO derivatives. In particular, the functionalization seems to be the required/necessary condition to achieve the highest biocompatibility for nano-materials [24] because they provide oxygenated bridges, very useful in establishing covalent and/or electrostatic interac-tions with biopolymers and biomolecules. This strategy focuses on the fabrication of several different biocompatible coatings; surrounding the nanostructured material surfaces, edges, and sides; and increasing their biocompatibility towards cells and tissues.
There is also a first level of functionalization degree, which is absent in biopolymers and present only in as-deposited GO and GO derivatives (this latter as post-synthesis treated carbon-based graphene materials). In this case, the only presence of the oxygenated func-tional groups on the GO surface mainly provides a better dispersibility in the working medium [25]. A stable nano-dispersion, in liquid phase, offers two important advan-tages during the experiments:
(a) (b)
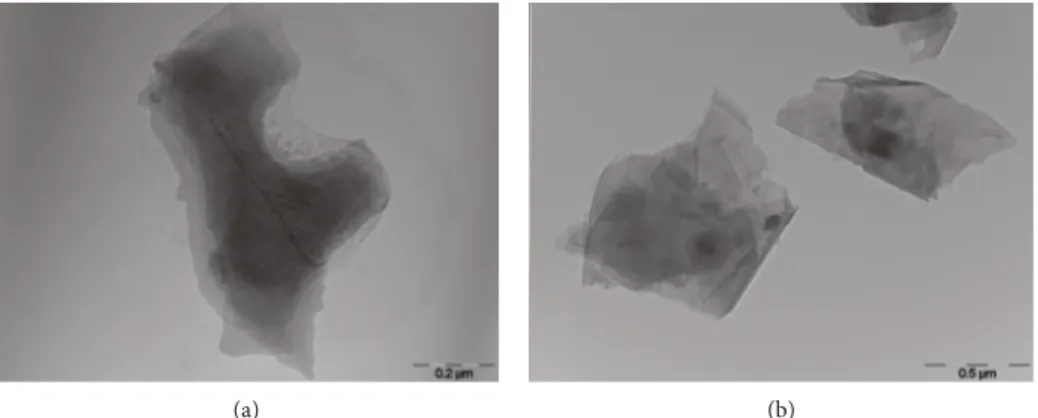
Figure2: TEM micrographs of (a) GO and (b) GO
(LiCl). Control sample GO 2 𝜇/mL GO (2 𝜇g/mL) + S29 (10 𝜇M) S29 10 𝜇M Time (hours) 0 6 12 18 24 30 36 42 48 54 60 66 72 78 1.0 × 10⁵ 8.0 × 10⁴ 6.0 × 10⁴ 4.0 × 10⁴ 2.0 × 10⁴ 0.0 C el l c o u n ts
(1) Graphene nanosheets are more easily distributed in the cellular compartments, avoiding aggregation and their subsequent expulsion by gravimetric settling (2) Graphene nanodispersion phases improve safety
bio-distribution processes [26] into the cells, minimizing the ROS generation mechanisms very well. This is especially due to the establishment of the couple elec-trostatic interactions between the oxygenated func-tional groups (mainly C(=O)OH, C(=O)R, C(=O)H, OH, etc.) and the aqueous working medium. The couple interactions strongly compete with the side reactions, involved in the formation of ROS radicals, since the electrostatic interactions, established with solvent-working medium, thermodynamically stabi-lize the resulting nanodispersion systems [27, 28] According to the main importance of the functionali-zation degree on the GO properties and performances, FTIR spectra profiles (see Figure 1), TG/DTA, and Raman results (these latter reported in Table 4) were also inserte-d/included in the manuscript, in order to confirm the XPS data analysis. Moreover, the acidic site evaluation (nmol/mg), reported in Table 4, mainly quantifies the C(=O)OH functional groups. These latter were also detected by using the Z-potential measurement technique that revealed negative values of -28.7 mV for GO and -32.1 mV for GO(LiCl)(typically achieved when in the presence of the negatively charged carboxylate anions C(=O)O-).
Furthermore, TEM analysis (Figure 2) confirmed the presence of more defective structures in the case of the most oxidized sample, as GO. This latter appeared as a multilayer of graphene oxide (A), while GO(LiCl)showed a more regular shape/geometry of the resulting nanosheets, similar to that exhibited by the pristine single layer of graphene.
3.2. Cytotoxicity: Evaluation of Cellular Proliferation. Cell growth curves in Figure 3 show that there is a decrease in growth rate during exposure to 2μg/mL GO for 24 and 48
hours compared to controls. Cell mortality rate, detected by trypan blue dye, was between 4% and 6%. We had previously established that higher doses of GO (10 and 20μg) were
cyto-toxic for SK-N-BE(2) cells but 2μg/mL GO did not induce
cell damage, so this concentration of GO provided the right concentration for carrying the minimum toxic concentration of S29. Treatment of cells with 10μM S29 and 2 μg/mL GO
started to inhibit cell growth after 24 h of exposure and became significantly different from GO alone or S29 alone at 48 h and 72 h. 10 nM and 100 nM S29 with, respectively, 5.74 ng/mL and 57.4 ng/mL GO failed to induce significant cell growth inhibition after 24 h from addition to cultures, meaning that S29 has a very low cytotoxicity in SK-N-BE(2) cells. In particular, these optimized concentration values for both the nanocarrier and S29 therapeutic agent were the low-est results compared to those declared in literature [31]. Moreover, the same authors [31] do not load drugs but only evaluate the cytotoxicity of the GO-Ag nanocarrier, at the
(a) (b)
(c)
Figure 4: Optical microscopy of SK-N-BE(2) treated with 2.0μg/mL of GO + 10 μM of S29, at (a) 24 h, magnification 20x; (b) 24 h,
highest concentration values in cells. Cell counts with trypan blue exclusion test demonstrated a low rate of cell necrosis even after 72 h of culture with 10μM S29 and 2 μg GO,
mean-ing that the inhibition of cell growth may be probably due to longer cell cycles or induction of apoptosis (the trypan blue data were also confirmed by the LDH assay, carried out as previously reported in reference [12]). Observation of cell cultures (40x inverted microscopy) showed that cells did not change their morphology nor detach from plastic after treatments (Figure 4).
3.3. Antibacterial Activity. Figures 5 and 6 showed the growth curves of GO-treated and GO(LiCl)-treated E. coli and S. aureus bacterial cells, respectively. Both treated bacteria grew following the trend exhibited by the corresponding control samples. When the bacteria cells were incubated with di ffer-ent graphene oxide concffer-entrations, a significant reduction of the OD values was recorded (if compared to the controls, reported in Figures 5(b) and 5(d) and Figures 6(b) and 6(d)). Results indicated that the bacteria cells exhibited a reduction of their growth, proportionally to the GO concen-trations. This agreed with the literature [32] where the lower sizes of GO sheets adhered on the bacteria surfaces, without
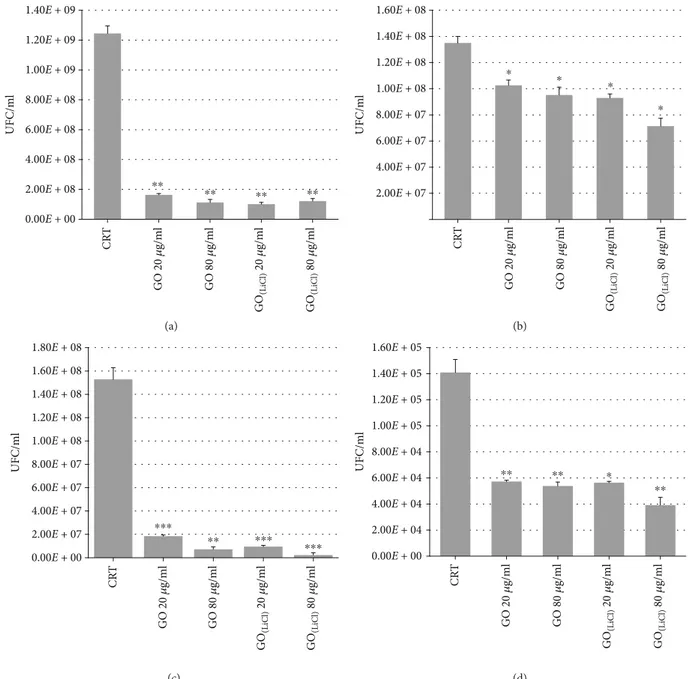
isolating them from the nutrient environment. Increasing the GO concentrations, bacteria cell results were more cov-ered, effectively isolated from the environment and con-demned to die. The bacteria cells, treated with GO(LiCl), exhibited a significant reduction to their growth, already at the lowest concentrations and independent of the GO(LiCl) concentrations. This could be explained considering the larg-est area of GO(LiCl)(Table 1), which was suitable to cover the external surface of the bacteria cells, provoking the indirect toxicity by biologically isolating them from the growth medium. Consequently, the bacterial cells could neither pro-liferate nor consume the nutrients and died. The death rate of the bacteria was determined by the colony-counting method. Figure 7 showed that both GO and GO(LiCl) reduced the growth of the S. aureus and E. coli (over 90%), when bacteria were exposed to different concentrations of graphene oxides, at T1= 4 h. The E. coli control samples at T0 were 1.9 × 10⁸UFC/mL, and after 4 h, the control increased up to 1.25 × 10⁹CFU/mL. After 4 h, the E.coli cells grew up to 1.64 × 10⁸ (at 20μg/mL of GO), 1.13 × 10⁸ (at 80μg/mL
of GO), 1.22 × 10⁸ (at 20μg/mL of GO(LiCl)), and 1.01 × 10⁸CFU/mL (at 80μg/mL of GO(LiCl)). At T0, the con-trol sample for S. aureus was 3.8 × 10⁷CFU/mL, and after 4 h,
0 0.2 0.4 0.6 0.8 1 1.2 1.4 0 1 2 3 4 5 6 O D 600 nm Time (h) CTR GO 20 𝜇g/mL GO 40 𝜇g/mL GO 80 𝜇g/mL (a) 0 10 20 30 40 50 GO 20 𝜇g/mL GO 40 𝜇g/mL GO 80 𝜇g/mL % o f r ed u ct io n i n t u rb id it y a ss ay ⁎ ⁎ ⁎ (b) 0 0.2 0.4 0.6 0.8 1 1.2 1.4 0 1 2 3 4 5 6 O D 600 nm Time (h) CTR GO(LiCl) 20 𝜇g/mL GO(LiCl) 40 𝜇g/mL GO(LiCl) 80 𝜇g/mL (c) 0 10 20 30 40 50
GO(LiCl) 20 𝜇g/mL GO(LiCl) 40 𝜇g/mL GO(LiCl) 80 𝜇g/mL
% o f r ed u ct io n i n t u rb id it y a ss ay ⁎ ⁎ ⁎ (d)
the control increased up to 1.53 × 10⁸UFC/mL. S. aureus-treated cells, at T1, grew up to 7.27 × 10⁶ (at 80μg/mL of
GO), 1.85 × 10⁷(at 20μg/mL of GO), 2.32 × 10⁶(at 80μg/mL
of GO(LiCl)), and 9.64 × 10⁶CFU/mL (at 20μg/mL of
GO(LiCl)). After 24 hours (T2), the experimental results showed that E. coli control increased up to 1.35 × 10⁸. The cells grew up to 9.52 × 10⁷ (at 80μg/mL of GO), reaching
the value of 1.03 × 10⁸(at 20μg/mL of GO). Incubating E. coli
with GO(LiCl), cells grew up to 7.14 × 10⁷ (at 80μg/mL
GO(LiCl)) and reached the values of 9.30 × 10⁷CFU/mL (at 20μg/mL GO(LiCl)). In the case of S. aureus, the control increased up to 1.41 × 10⁵. The treated S. aureus cells grew up to 5.38 × 10⁴(at 80μg/mL of GO), 5.72 × 10⁴(at 20μg/mL
of GO), 3.91 × 10⁴ (at 80μg/mL of GO(LiCl)), and 5.64 × 10⁴CFU/mL (at 20μg/mL of GO(LiCl)). The
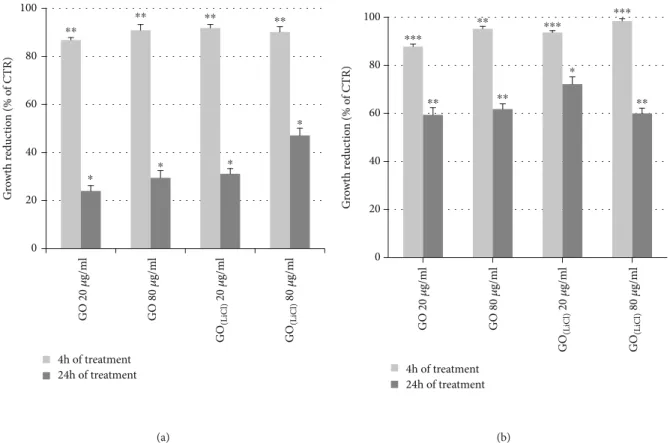
antibacte-rial effects on E. coli were highly evident at 4 hours, with a growth reduction of 90%, for both GO samples. At 24 hours, the antibacterial activity for E. coli in the presence of GO(LiCl) (Figure 8(a)) was superior to GO and also higher if compared with S. aureus. A reasonable explanation could be the pres-ence of a much thinner peptidoglycan wall, in the E. coli structure [31]. For S. aureus, the antibacterial effects were observed at T1= 4 hours, with a bacterial growth reduction
of 95%. At 24 hours, the bacterial cell growth reduction was about 60%, working with GO, and slightly higher (75%) in the presence of GO(LiCl) (Figure 8(b)). After 24 h of GO incubation, S. aureus showed a typical bacteriostatic activity, if compared with E. coli. The experimental results could be explained as a combination of different parame-ters [33], such as the bacteria morphology/structure [34, 35] and the conductivity behavior of the GO [36] (more insulating nanomaterial) and GO(LiCl)[37] (a semiconduc-tive material), these latter being responsible for the electron-transfer interaction between the graphene deriva-tives and the bacteria cells.
To examine whether direct interaction of bacteria and graphene oxide nanosheets could exhibit a key role in the antibacterial activity of graphene oxide (80μg/mL), the
mor-phological changes of both bacterial cells, S. aureus and E. coli, were studied using SEM and TEM analysis, respectively. E. coli control exhibited normal rod-like morphology with regular and intact membranes (Figure 9(a)). E. coli incu-bated with GO exhibited severe membrane deformations, and cell shape was seriously distorted with evident shrinkage effects (Figure 9(b)). These effects could be probably due to a collapse of the internal structure. In some cases, the outer
0 0.2 0.4 0.6 0.8 1 1.2 1.4 1 2 3 4 5 6 7 O D 600 nm Time (h) CTR GO 20 𝜇g/ml GO 40 𝜇g/ml GO 80 𝜇g/ml (a) 0 10 20 30 GO 20 𝜇g/ml GO 40 𝜇g/ml GO 80 𝜇g/ml % o f r ed u ct io n i n t u rb id it y a ss ay ⁎ ⁎ ⁎ (b) 0 0.2 0.4 0.6 0.8 1 1.2 1.4 1 2 3 4 5 6 7 O D 600 nm Time (h) CTR GO(LiCl) 20 𝜇g/ml GO(LiCl) 40 𝜇g/ml GO(LiCl) 80 𝜇g/ml (c) 0 10 20 30
GO(LiCl) 20 𝜇g/ml GO(LiCl) 40 𝜇g/ml GO(LiCl) 80 𝜇g/ml
% o f r ed u ct io n i n t u rb id it y a ss ay ⁎ ⁎ ⁎ (d)
membranes merged with those belonging to the other bacte-ria cells (Figure 9(c)). E. coli, when incubated with GO(LiCl), also exhibited similar behavior (Figures 9(d) and 9(e)). The experimental results could be explained considering a typical electron-transfer process from the positively charged Gram-negative E. coli and the negatively charged GO and GO(LiCl) nanomaterials. The results could be inter-preted considering a synergy of effects such as an electron transfer [38] (from graphene oxide toward the bacterial membranes), the oxidative stress [39], and the mechanical tearing (cutting effect depending on the shape and size of the graphene nanosheets).
In the case of S. aureus cells, SEM micrographs showed a regular sphere shape (Figure 9(f), inset) and a typical grape-like aggregation in the entire control sample
(Figure 9(f), the main image). When S. aureus cells were incubated with 80μg/mL of GO (24 h), they showed a lightly
irregular and shrunken shape (Figure 9(g)). The graphene oxide-bacteria interactions developed strong forces of attrac-tion among cells that induced the formaattrac-tion of numerous spherical bacterial aggregates around graphene oxide nano-sheets (Figure 9(h)), which are completely absent in the case of E. coli, when incubated with the same GO. This result could be explained when considering a strong electrostatic interaction between the Gram-positive S. aureus (with an isoelectric point [40] pI = 2~3, versus pI = 4-5 in the case of E. coli [41]) and the more insulating GO nanomaterial. When inoculated with GO(LiCl), the aggregation effects were also recorded (Figures 9(i) and 9(j)) in S. aureus cells but much less evident than those shown in Figure 9(h), for
0.00E + 00 2.00E + 08 4.00E + 08 6.00E + 08 8.00E + 08 1.00E + 09 1.20E + 09 1.40E + 09 U F C /m l ⁎⁎ ⁎⁎ ⁎⁎ ⁎⁎ CR T GO 20 𝜇 g/ m l GO 80 𝜇 g/ m l GO (L iC l) 20 𝜇 g/ m l GO (L iC l) 80 𝜇 g/ m l (a) 2.00E + 07 4.00E + 07 6.00E + 07 8.00E + 07 1.00E + 08 1.20E + 08 1.40E + 08 1.60E + 08 U F C /m l CR T GO 20 𝜇 g/ m l GO 80 𝜇 g/ m l GO (L iC l) 20 𝜇 g/ m l GO (L iC l) 80 𝜇 g/ m l ⁎ ⁎ ⁎ ⁎ (b) 0.00E + 00 2.00E + 07 4.00E + 07 6.00E + 07 8.00E + 07 1.00E + 08 1.20E + 08 1.40E + 08 1.60E + 08 1.80E + 08 U F C /m l CR T GO 20 𝜇 g/ m l GO 80 𝜇 g/ m l GO (L iC l) 20 𝜇 g/ m l GO (L iC l) 80 𝜇 g/ m l ⁎⁎⁎ ⁎⁎ ⁎⁎⁎ ⁎⁎⁎ (c) 0.00E + 00 2.00E + 04 4.00E + 04 6.00E + 04 8.00E + 04 1.00E + 05 1.20E + 05 1.40E + 05 1.60E + 05 U F C /m l CR T GO 20 𝜇 g/ m l GO 80 𝜇 g/ m l GO (L iC l) 20 𝜇 g/ m l GO (L iC l) 80 𝜇 g/ m l ⁎⁎ ⁎⁎ ⁎⁎ ⁎ (d)
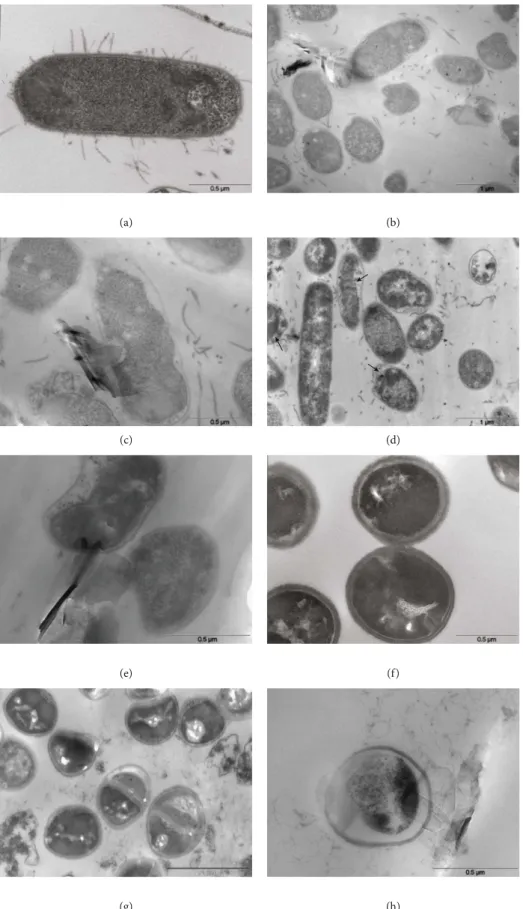
GO. The explanation could be related to the semiconductive properties of GO(LiCl)that could provoke a greater electro-static repulsion, because it delivers more electrons toward the negatively charged bacterial walls, as in the case of the S. aureus pathogen (with the result of decreasing the value of the electrostatic potential membrane ΔE/V). TEM analy-sis confirmed that the direct contact of the graphene oxide nanosheets with bacterial cells induced the loss of the struc-tural integrity, in both bacterial species and the presence of both GO samples. TEM micrographs of E. coli exposed to GO for 24 h showed that the bacterial shrinkage, observed by SEM, was consistent with plasma membrane damage and retraction, leading to the leakage of intracellular mate-rial in the periplasmic space (Figures 10(b) and 10(c) versus Figure 10(a) that is the control). Therefore, it is reasonable to think that an electron-transfer process can be triggered, fol-lowing the breaking of the membrane and consequent leak-age of periplasmic materials. The effective and irreversible damages of the bacterial cells could happen after the elec-tronic transfer processes, in combination with the oxidative stress or additional mechanical tearing processes [42]. In Figure 10(c), the “insertion/cutting mode” interaction between GO and E. coli clearly highlighted a nanosheet while it entered into the phospholipid bilayer, cutting the mem-brane (Figure 10(c)), as reported in literature [43]. Similar profiles were detected incubating E. coli with GO(LiCl)
nano-sheets (Figures 10(d) and 10(e)). S. aureus, incubated with 80μg/mL of GO for 24 h, showed numerous contacts with
GO, with a great number of cells characterized by several
types of plasma membrane damage, having significant con-densation of the intracellular material [44] (Figure 10(g) ver-sus the unaltered control in Figure 10(f)). The initial plasma membrane damage evolved in the leakage of intracellular material and the loss of cell wall integrity (Figure 10(h)), pro-voking the cell death. A similar trend was observed when S. aureus was incubated with GO(LiCl), where the cell damage seemed to be related to the electron diffusion mechanisms, from the graphene nanosheets toward the bacterial plasma membranes, which is especially more significant for the semimetallic graphene (GO(LiCl)) samples (Figures 10(i) and 10(j)). Concerning the antibacterial activity, it is neces-sary to underline that both types of graphene intrinsically exhibited this property [31] without the synergy with a tra-ditional antibacterial agent, such as the silver element.
4. Conclusions
In this study, two different metal-free graphene oxide products were synthesized, by using chemical and electro-chemical procedures. The resulting graphene oxides showed different functionalization degrees (mainly as C(=O)OH groups), which determined different electronic features: a semiconductive behavior in the presence of GO(LiCl)and a more insulating profile in the case of chem-ically synthesized GO. These features could explain the slightly different reactivity, observed working with GO and GO(LiCl) in bacteria and in neuroblastoma cells, respectively. In particular, both graphene oxides (2μg/mL)
0 20 40 60 80 100 G ro wt h r ed uc tio n (% o f CTR) 4h of treatment 24h of treatment GO 20 𝜇 g/ m l GO 80 𝜇 g/ m l GO (L iC l) 20 𝜇 g/ m l GO (L iC l) 80 𝜇 g/ m l ⁎⁎ ⁎⁎ ⁎⁎ ⁎⁎ ⁎ ⁎ ⁎ ⁎ (a) 0 20 40 60 80 100 G ro wt h r ed uc tio n (% o f CTR) 4h of treatment 24h of treatment GO 20 𝜇 g/ m l GO 80 𝜇 g/ m l GO (L iC l) 20 𝜇 g/ m l GO (L iC l) 80 𝜇 g/ m l ⁎⁎ ⁎⁎ ⁎⁎⁎ ⁎⁎⁎ ⁎⁎⁎ ⁎⁎ ⁎ ⁎⁎ (b)
Figure8: Growth reduction (%) of E. coli (a) and S. aureus (b) in the presence of GO or GO
3 𝜇m (a) 3 𝜇m (b) 5 𝜇m (c) 5 𝜇m (d) 1 𝜇m (e) 10 𝜇m 1 𝜇m (f) 2 𝜇m (g) 3 𝜇m (h) 10 𝜇m (i) 2 𝜇m (j)
Figure9: SEM micrographs of antibacterial effect of GO and GO
(LiCl)on E. coli and S. aureus: (a) E. coli control; (b, c) E. coli incubated with
80μg/mL of GO at 24 h; (d, e) E. coli incubated with 80 μg/mL of GO(LiCl)at 24 h; (f) S. aureus control; (g, h) S. aureus incubated with 80μg/mL of GO at 24 h; (i, j) S. aureus incubated with 80 μg/mL of GO(LiCl)at 24 h.
(a) (b)
(c) (d)
(e) (f)
(g) (h)
showed a negligible effect of cytotoxicity, being eligible as a carrier of the S29 compound. Furthermore, both graphene oxides possess an interesting antimicrobial activity, especially GO(LiCl)which resulted in a bactericidal agent, and GO was a bacteriostatic ecofriendly nanomaterial. In particular, this last feature represents an important biocompatibility prop-erty that elects the GO as the new nanovector of anticancer drugs, especially in neuroblastoma cell lines.
Data Availability
The data used to support the findings of this study are included within the article.
Conflicts of Interest
The authors declare no competingfinancial interest.
Acknowledgments
The work was financially supported by the Smart Campus Project (CUP E82I15000980002). The authors also wish to thank Professor Silvia Schenone from the Department of Pharmacy, Università degli Studi di Genova, Viale Benedetto XV, 3, 16132, Genova (IT), for technical support.
References
[1] A. Jafarizad, A. Taghizadehgh-Alehjougi, M. Eskandani et al.,
“PEGylated graphene oxide/Fe3O4nanocomposite: synthesis,
characterization, and evaluation of its performance as de novo drug delivery nanosystem,” Bio-medical Materials and Engi-neering, vol. 29, no. 2, pp. 177–190, 2018.
[2] Kenry, W. C. Lee, K. P. Loh, and C. T. Lim, “When stem cells meet graphene: opportunities and challenges in regenerative medicine,” Biomaterials, vol. 155, pp. 236–250, 2018. [3] Y. Wu, B. Yao, C. Yu, and Y. Rao, “Optical graphene gas
sen-sors based on microfibers: a review,” Sensen-sors, vol. 18, no. 4, pp. 941–957, 2018.
[4] F.-X. Liang, Y. Gao, C. Xie, X.-W. Tong, Z.-J. Li, and L.-B. Luo, “Recent advances in the fabrication of graphene–ZnO
heterojunctions for optoelectronic device applications,” Jour-nal of Materials Chemistry C, vol. 6, no. 15, pp. 3815–3833, 2018.
[5] M. A. Kang, S. Ji, S. Kim et al., “Highly sensitive and wearable gas sensors consisting of chemically functionalized graphene oxide assembled on cotton yarn,” RSC Advances, vol. 8, no. 22, pp. 11991–11996, 2018.
[6] Y. Chyan, R. Ye, Y. Li, S. P. Singh, C. J. Arnusch, and J. M. Tour, “Laser-induced graphene by multiple lasing: toward electronics on cloth, paper, and food,” ACS Nano, vol. 12, no. 3, pp. 2176–2183, 2018.
[7] S. Afsahi, M. B. Lerner, J. M. Goldstein et al., “Novel graphene-based biosensor for early detection of Zika virus infection,” Biosensors and Bioelectronics, vol. 100, pp. 85–88, 2018.
[8] P. Choudhary, T. Parandhaman, B. Ramalingam,
N. Duraipandy, M. S. Kiran, and S. K. Das, “Fabrication of nontoxic reduced graphene oxide protein nanoframework as sustained antimicrobial coating for biomedical application,” ACS Applied Materials & Interfaces, vol. 9, no. 44, pp. 38255–38269, 2017.
[9] S. P. Singh, Y. Li, A. Be’er, Y. Oren, J. M. Tour, and C. J. Arnusch, “Laser-induced graphene layers and electrodes pre-vents microbial fouling and exerts antimicrobial action,” ACS Applied Materials & Interfaces, vol. 9, no. 21, pp. 18238– 18247, 2017.
[10] X. Zhao, Z. Wei, Z. Zhao et al.,“Design and development of
graphene oxide nanoparticle/chitosan hybrids showing pH-sensitive surface charge-reversible ability for efficient intracellular doxorubicin delivery,” ACS Applied Materials & Interfaces, vol. 10, no. 7, pp. 6608–6617, 2018.
[11] J. Sturala, J. Luxa, M. Pumera, and Z. Sofer, “Chemistry of gra-phene derivatives: synthesis, applications, and perspectives,” Chemistry - A European Journal, vol. 24, no. 23, pp. 5992– 6006, 2018.
[12] F. Valentini, E. Mari, A. Zicari et al., “Metal free graphene oxide (GO) nanosheets and pristine-single wall carbon nano-tubes (p-SWCNTs) biocompatibility investigation: a compara-tive study in different human cell lines,” International Journal of Molecular Sciences, vol. 19, no. 5, p. 1316, 2018.
[13] M. Celano, S. Schenone, D. Cosco et al., “Cytotoxic effects of a novel pyrazolopyrimidine derivative entrapped in liposomes in anaplastic thyroid cancer cells in vitro and in xenograft
(i) (j)
Figure10: TEM micrographs of antibacterial effect of GO and GO
(LiCl)on E. coli and S. aureus: (a) E. coli control; (b, c) E. coli incubated with
80μg/mL of GO at 24 h; (d, e) E. coli incubated with 80 μg/mL of GO(LiCl)at 24 h; (f) S. aureus control; (g, h) S. aureus incubated with 80μg/mL of GO at 24 h; (i, j) S. aureus incubated with 80 μg/mL of GO(LiCl)at 24 h.
tumors in vivo,” Endocrine-Related Cancer, vol. 15, no. 2, pp. 499–510, 2008.
[14] A. L. Fallacara, A. Mancini, C. Zamperini et al., “Pyrazo-lo[3,4-d]pyrimidines-loaded human serum albumin (HSA) nanoparticles: preparation, characterization and cytotoxicity evaluation against neuroblastoma cell line,” Bioorganic & Medicinal Chemistry Letters, vol. 27, no. 14, pp. 3196–3200, 2017.
[15] E. Mari, A. Zicari, F. Fico, I. Massimi, L. Martina, and S. Mardente, “Action of HMGB1 on miR-221/222 cluster in neuroblastoma cell lines,” Oncology Letters, vol. 12, no. 3, pp. 2133–2138, 2016.
[16] S. A. Wells Jr and M. Santoro, “Update: the status of clinical trials with kinase inhibitors in thyroid cancer,” The Journal of Clinical Endocrinology & Metabolism, vol. 99, no. 5, pp. 1543–1555, 2014.
[17] S. Martina Ferrari, C. La Motta, S. Sartini et al., “Pyrazolopyr-imidine derivatives as antineoplastic agents: with a special focus on thyroid cancer,” Mini-Reviews in Medicinal Chemis-try, vol. 16, no. 2, pp. 86–93, 2015.
[18] L. Bertuccini, R. Russo, F. Iosi, and F. Superti, “Effects of Lacto-bacillus rhamnosus and LactoLacto-bacillus acidophilus on bacterial vaginal pathogens,” International Journal of Immunopathology and Pharmacology, vol. 30, no. 2, pp. 163–167, 2017.
[19] M. M. Perry and A. B. Gilbert, “Yolk transport in the ovarian follicle of the hen (Gallus domesticus): lipoprotein-like parti-cles at the periphery of the oocyte in the rapid growth phase,” Journal of Cell Science, vol. 39, pp. 257–272, 1979.
[20] S. Bykkam, K. V. Rao, C. H. S. Chakra, and T. Thunugunta, “Synthesis and characterization of graphene oxide and its anti-microbial activity against Klebseilla and Staphylococus,” Inter-national Journal of Advanced Biotechnology and Research, vol. 4, pp. 1005–1009, 2013.
[21] S. Liu, M. Hu, T. H. Zeng et al., “Lateral dimension-dependent antibacterial activity of graphene oxide sheets,” Langmuir, vol. 28, no. 33, pp. 12364–12372, 2012.
[22] O. Akhavan, E. Ghaderi, H. Emamy, and F. Akhavan, “Geno-toxicity of graphene nanoribbons in human mesenchymal stem cells,” Carbon, vol. 54, pp. 419–431, 2013.
[23] L. Hui, J. Huang, G. Chen, Y. Zhu, and L. Yang, “Antibacterial property of graphene quantum dots (both source material and bacterial shape matter),” ACS Applied Materials & Interfaces, vol. 8, no. 1, pp. 20–25, 2016.
[24] K. Yang, Y. Li, X. Tan, R. Peng, and Z. Liu, “Behavior and tox-icity of graphene and its functionalized derivatives in biologi-cal systems,” Small, vol. 9, no. 9-10, pp. 1492–1503, 2013. [25] D. Konatham and A. Striolo, “Molecular design of stable
gra-phene nanosheets dispersions,” Nano Letters, vol. 8, no. 12, pp. 4630–4641, 2008.
[26] X. Zhang, J. Yin, C. Peng et al., “Distribution and biocom-patibility studies of graphene oxide in mice after intrave-nous administration,” Carbon, vol. 49, no. 3, pp. 986–995, 2011.
[27] S. Vesaratchanon, A. Nikolov, and D. T. Wasan, “Sedimenta-tion in nano-colloidal dispersions: effects of collective interac-tions and particle charge,” Advances in Colloid and Interface Science, vol. 134-135, pp. 268–278, 2007.
[28] T. Kuila, S. Bose, A. K. Mishra, P. Khanra, N. H. Kim, and J. H. Lee, “Chemical functionalization of graphene and its applica-tions,” Progress in Materials Science, vol. 57, no. 7, pp. 1061– 1105, 2012.
[29] Y. S. Kim and C. R. Park, “One-pot titration methodology for the characterization of surface acidic groups on functionalized carbon nanotubes,” Carbon, vol. 96, pp. 729–741, 2016. [30] S. Visentin, N. Barbero, S. Musso et al., “Sensitive and practical
fluorimetric test for CNT acidic site determination,” Chemical Communications, vol. 46, pp. 1443–1445, 2010.
[31] W. Shao, X. Liu, H. Min, G. Dong, Q. Feng, and S. Zuo, “Prep-aration, characterization, and antibacterial activity of silver nanoparticle-decorated graphene oxide nanocomposite,” ACS Applied Materials & Interfaces, vol. 7, no. 12, pp. 6966–6973, 2015.
[32] S. Jaworski, M. Wierzbicki, E. Sawosz et al., “Graphene oxide-based nanocomposites decorated with silver nanoparti-cles as an antibacterial agent,” Nanoscale Research Letters, vol. 13, no. 1, p. 116, 2018.
[33] S. R.-V. Castrillón, F. Perreault, A. F. de Faria, and M. Elimelech, “Interaction of graphene oxide with bacterial cell membranes: insights from force spectroscopy,” Environ-mental Science & Technology Letters, vol. 2, no. 4, pp. 112– 117, 2015.
[34] J. Li, G. Wang, H. Zhu et al., “Antibacterial activity of
large-area monolayer graphene film manipulated by charge
transfer,” Scientific Reports, vol. 4, no. 1, 2015.
[35] J. Chen, H. Peng, X. Wang, F. Shao, Z. Yuan, and H. Han, “Graphene oxide exhibits broad-spectrum antimicrobial activ-ity against bacterial phytopathogens and fungal conidia by intertwining and membrane perturbation,” Nanoscale, vol. 6, no. 3, pp. 1879–1889, 2014.
[36] S. Saxena, T. A. Tyson, S. Shukla, E. Negusse, H. Chen, and J. Bai, “Investigation of structural and electronic properties of graphene oxide,” Applied Physics Letters, vol. 99, no. 1, pp. 13104–13107, 2011.
[37] C. Gómez-Navarro, R. T. Weitz, A. M. Bittner et al., “Elec-tronic transport properties of individual chemically reduced graphene oxide sheets,” Nano Letters, vol. 7, no. 11, pp. 3499–3503, 2007.
[38] O. Akhavan and E. Ghaderi, “Escherichia coli bacteria reduce graphene oxide to bactericidal graphene in a self-limiting manner,” Carbon, vol. 50, no. 5, pp. 1853–1860, 2012. [39] S. Gurunathan, J. Woong Han, A. Abdal Daye, V. Eppakayala,
and J.-h. Kim, “Oxidative stress-mediated antibacterial activity of graphene oxide and reduced graphene oxide in Pseudomo-nas aeruginosa,” International Journal of Nanomedicine, vol. 7, pp. 5901–5914, 2012.
[40] M. Moldovan, D. Prodan, C. Sarosi et al., “Synthesis, morpho-structural properties and antibacterial effect of silicate based composites containing graphene oxide/hydroxyapatite,” Materials Chemistry and Physics, vol. 217, pp. 48–53, 2018. [41] K. Prasad, G. S. Lekshmi, K. Ostrikov et al., “Synergic
bacteri-cidal effects of reduced graphene oxide and silver nanoparti-cles against Gram-positive and Gram-negative bacteria,” Scientific Reports, vol. 7, no. 1, pp. 1591–1602, 2017.
[42] A. Al-Jumaili, S. Alancherry, K. Bazaka, and M. Jacob,“Review
on the antimicrobial properties of carbon nanostructures,” Materials, vol. 10, no. 9, 2017.
[43] V. T. H. Pham, V. K. Truong, M. D. J. Quinn et al., “Graphene induces formation of pores that kill spherical and rod-shaped bacteria,” ACS Nano, vol. 9, no. 8, pp. 8458–8467, 2015. [44] X. Zou, L. Zhang, Z. Wang, and Y. Luo, “Mechanisms of the
antimicrobial activities of graphene materials,” Journal of the American Chemical Society, vol. 138, no. 7, pp. 2064–2077, 2016.