DEPARTMENT OF
AGRICULTURE, FORESTRY, NATURE AND ENERGY
Agricultural and Forestry Engineering
HEAT TRANSFER SIMULATION BY MEANS OF FEM AND FDM
(Scientific disciplinary sector:
PhD candidate:
Elena Allegrini
Course Coordinator:
Prof. Massimo Cecchini
TUSCIA UNIVERSITY
EPARTMENT OF SCIENCES AND TECHNOLOGY FOR AGRICULTURE, FORESTRY, NATURE AND ENERGY
PhD course in
Agricultural and Forestry Engineering - XXVII Cycle
HEAT TRANSFER SIMULATION IN ENERGY - EFFICIENT SOLUTIONS BY MEANS OF FEM AND FDM: AN APPLICATION TO
DIFFERENT CASE STUDIES
Scientific disciplinary sector: ING-IND/09)
Tutor
Prof. Maurizio Carlini
Date of dissertation defence May 4, 2015
SCIENCES AND TECHNOLOGY FOR AGRICULTURE, FORESTRY, NATURE AND ENERGY
XXVII Cycle
EFFICIENT SOLUTIONS TO THREE
IND/09)
Tutor:
2
Contents
Nomenclature ... 5
Abstract ... 9
Introduction ... 11
1. Aims and motivation of the research ... 11
2. Structure of the thesis ... 11
3. Published papers during the PhD studies ... 12
CHAPTER 1 ... 15
Theoretical background ... 15
1.1 Introduction ... 15
1.2 Modes of heat transfer ... 15
1.3 Conduction ... 17
1.4 Convection ...19
1.5 Thermal radiation ... 20
1.6 Solution of heat transfer equations: FEM and FDM ... 21
1.6.1 Comsol Multiphysics ... 26
1.6.1.1 General description ... 26
1.6.2 Fire Dynamic Simulator ... 32
1.6.2.1 General description ... 32
1.6.2.2 Boundary conditions in FDS ... 33
1.6.2.3 Procedure to run an FDS calculation ... 34
1.6.2.4 Thermal boundary conditions ... 38
CHAPTER 2 ... 41
Case study 1: Heat transfer in a downhole heat exchanger ... 41
3
2.2 Introduction ... 42
2.3 Materials and methods ... 45
2.4 Results and discussion ... 50
2.5 Conclusion ... 53
CHAPTER 3 ... 54
Case study 2: Thermal behaviour of external opaque enclosures in existing buildings ... 54
3.1 Aim of the investigation ... 54
3.2 Introduction ... 55
3.3 Material and methods ... 56
3.3.1 Physical models to simulate building thermal behaviour ... 56
3.3.2 Description of the case study ... 58
3.3.3 The simulation in Comsol Multiphysics ... 65
3.4 Results and discussion ... 69
3.5 Conclusion ...77
CHAPTER 4 ... 78
Case study 3: IR thermography For glasses thermal behaviour ... 78
4.1 Aim of the investigation ... 78
4.2 Introduction: fundamentals on infrared thermal imaging ... 79
4.3 Materials and methods ... 83
4.3.1 Description of the IR camera FLIR P640 ... 83
4.3.2 The IR images postprocessing: ThermaCAM ... 87
4.3.3 Description of the heater device and glasses ... 89
4.3.4 The first experimental set-up and preliminary results ... 93
4.3.5 The second experimental set-up ... 98
4
4.4 Results and discussion ...123
4.5 Conclusion ... 129
Conclusion ... 130
5
NOMENCLATURE
Roman letters
A Overall heat exchange area (m2)
Af Area of the frame (m2)
Ag Area of the glass (m2)
[B] Matrix for temperature gradients interpolation
C Conductivity of non homogeneous materials (W/m2/K)
cp Specific heat capacity [J/ (kg x K)]
dext External diameter of the pipe (m)
dint Internal diameter of the pipe (m)
dT/dx Temperature gradient (K/m)
EPDHW Total primary energy consumption for domestic hot water
(kWh/m3/year) or (kWh/m2/year)
EPGL Global primary energy consumption (kWh/m3/year) or
(kWh/m2/year)
EPW Global energy performance indicator for winter heating
(kWh/m3/year) or (kWh/m2/year)
{f} Global load vector
{f}e Load vector for the individual element e
g Acceleration of gravity (m/s2)
G Heat generated in the control volume (W/m3)
Gλ Spectral irradiation (W/m2)
Gλ,abs Absorbed radiation (W/ m2)
Gλ,ref Reflected radiation (W/ m2)
Gλ,tr Transmitted radiation (W/ m2)
Gr Grashof number (dimensionless)
h Convection heat transfer coefficient (W/m2)
hi0 Heat transfer coefficient inside the pipe (W/m2/K)
he0 Heat transfer coefficient in the groundwater basin (W/m2/K)
Ig Perimeter of the glass (m)
6
Iφ,R1 Solar radiation at the lower latitude if compared to φ (W/m2)
Iφ,R2 Solar radiation at the higher latitude if compared to φ (W/m2)
k Thermal conductivity [W/(m x K)]
[K] Global Left Side Hand matrix
[K]e Left Side Hand matrix for the element e
l Length of a one-dimensional linear element
L Characteristic length (m)
m Flow rate (m3/s)
n Time step
n Spatial coordinate pointing into the solid
nnorm Outward direction normal to the surface
{n} Outer normal to the surface of the body
[N] Matrix of shape functions
Ni Shape function
Nm Number of material components forming the solid
Nu Nusselt number (dimensionless)
p Pressure (Pa)
P Perimeter (m)
Pr Prandtl number (dimensionless)
qr Incoming heat flux (W/m2)
qs Specified heat flux (W/m2)
qtr Power transmitted through the wall (W/m2)
qx Heat flux in the x direction (W/m2)
qy Heat flux in the y direction (W/m2)
qz Heat flux in the z direction (W/m2)
qconv Convective heat flux (W/m2)
qrad Radiative heat flux (W/m2)
Q Withdrawable heat (W)
R Fouling factor (dimensionless)
Ra Thermal resistance of gap (m2K/W)
Ra Rayleigh number (dimensionless)
Re Reynolds number (dimensionless)
Rsi Internal resistance (m2K/W)
7
si Thickness of the layer within the wall (m)
S1 Surface where Ts is specified
S2 Surface where qs is given
S3 Surface where the convection boundary condition occurs
S4 Surface where the radiation boundary condition occurs
t Time (s)
T Temperature (K)
{T} Global unknown vector of temperature
Te Known environmental temperature (K)
Text Water temperature inside the well (K)
Tf Temperature of the fluid (K)
Tg Gas temperature in the centre of the first gas phase cell (K)
Tin Water temperature at the beginning of the pipe (K)
T0 Prescribed temperature on the boundary surface (K)
Ts Unknown surface temperature (K)
Ts, ½ Surface temperature, defined as the average of Ts,0 and Ts,1 (K)
Tw Temperature of the wall surface (K)
ui Fluid velocity in the xi direction (m/s)
U Bulk velocity (m/s)
Uatm Theoretical camera output voltage for a blackbody of
temperature Tatm according to the calibration (V)
UD Overall heat transfer coefficient (W/m2/K)
Uf Thermal transmittance of the window frame (W/m2/K)
Ug Thermal transmittance of the glass (W/m2/K)
Uobj Calculated camera output voltage for a blackbody of
temperature Tobj (V)
Urefl Theoretical camera output voltage for a blackbody of
temperature Trefl according to the calibration (V)
Utot Measured camera output voltage for the actual case (V)
Utr Thermal transmittance (W/m2/K)
Uw Thermal transmittance of the window (W/m2/K)
Uwall Thermal transmittance of the wall (W/m2/K)
v Air speed (m/s)
8
Watm Total energy depending on the presence of atmosphere
Wrefl Total energy depending on other sources standing around the
measurement
Wtot Total energy that hits the camera when the object to be
analysed is focused
x x coordinate
Xα Volume fraction component
y y coordinate
z z coordinate
Greek symbols
α Thermal diffusivity (m2/s)
αsurf Surface absorption coefficient
β Thermal expansion (1/K)
δn Normal grid spacing
∆T Temperature difference outdoor - indoor (K)
∆TLM Logarithmic mean temperature difference (K)
Γ Boundary surface
ε Emissivity
µ Dynamic viscosity (Pa x s)
ν Kinematic viscosity (m2/s)
ρ Density (kg/m3)
ρs,α Component density (kg/m3)
σ Stefan-Boltzmann constant equal to 5,669 x 10-8 [W/( m2 x
K4)]
φ Latitude (°)
φR1 Lower latitude if compared to φ (°)
φR2 Higher latitude if compared to φ (°)
9
ABSTRACT
(Italian)L'efficienza energetica occupa un posto di rilevante importanza nel complesso delle misure e delle azioni necessarie a rafforzare l’approvvigionamento energetico e contemporaneamente a ridurre le emissioni di gas climalteranti in atmosfera. Tale ruolo di spicco è stato ulteriormente sottolineato dai recenti documenti programmatici sia a livello comunitario sia all’interno della Strategia Energetica Nazionale. Se si considera che circa il 40% del consumo finale di energia negli Stati Membri è attribuibile direttamente al settore terziario e residenziale (case, uffici pubblici e privati, negozi e altre categorie di edifici), si evince immediatamente che il potenziale di risparmio in tale settore è estremamente elevato. In base all'analisi condotta dall'Energy Efficiency Report, realizzato dall’Energy & Strategy Group del Politecnico di Milano, gli interventi di miglioramento dell'efficienza energetica devono riguardare l'involucro edilizio, sia chiusure opache che trasparenti, la produzione e distribuzione di energia termica ed elettrica, ed i servizi generali (ad esempio illuminazione, aria compressa, refrigerazione).
L'attività di ricerca ha pertanto riguardato l'analisi dello scambio termico di alcune soluzioni energeticamente efficienti -attraverso il metodo degli elementi finiti e delle differenze finite- al fine di valutare l'effettivo miglioramento della scelta proposta. La tesi comprende:
• caso studio 1: utilizzo di uno scambiatore di calore geotermico per la fornitura di energia termica presso il Vivaio Daniel Plants (Viterbo);
• caso studio 2: analisi del comportamento termico di una superficie opaca in presenza ed assenza di cappotto esterno, in condizioni invernali ed estive, nella Caserma del Corpo Forestale dello Stato di Sabaudia (Latina);
• caso studio 3: utilizzo della termografia IR attiva nell'analisi del comportamento termico degli infissi, sia in fase di riscaldamento che di raffreddamento.
10
(English)
Energy efficiency is increasingly becoming a relevant issue both in the European and national regulations, which are aimed at reducing greenhouses gas emissions and to strengthen fossil fuels independence.
Since buildings of tertiary sector and residential structures account for approximately 40% of the total energy consumption, it is important to immediately act. According to the Energy Efficiency Report, the most effective interventions should involve opaque and transparent enclosures, thermal and electrical energy production and distribution, and general services (lighting, refrigeration).
Hence, the present Doctoral thesis is addressed to investigate the thermal behaviour of some energy-efficient solutions and to evaluate the improvement which may be reached. It concerns the use of the Finite Element and Finite Difference Methods in order to solve the differential equations describing the specific phenomenon. The following examples will be investigated:
• case study 1: use of a Downhole Heat Exchanger for heating in the Province of Viterbo;
• case study 2: thermal behaviour of the external opaque enclosures in
a public building in Sabaudia (Latina), both in winter and summer conditions;
• case study 3: use of active IR thermography for glasses thermal behaviour, during the heating and cooling phases.
11
INTRODUCTION
1.
Aims and motivation of the researchAccording to recent national and European regulations, ambitious targets need to be achieved by reducing greenhouses gases emissions, producing energy from renewable sources and improving the energy efficiency.
Since buildings account for approximately 40% of energy consumption in the European Union, their energy efficiency retrofitting is increasingly becoming a relevant environmental issue to still work on, both in industry and academic research. According to the Energy Efficiency Report published in 2013 by the Politecnico di Milano (Italy), the following technologies should be implemented to ensure energy efficiency: interventions on opaque enclosures and glasses, thermal energy production by means of renewable sources, use of the uninterruptible power supply in the electrical system and distribution, and building automation systems.
Thus, the aim of the present thesis is to investigate the thermal behaviour of some energy-efficient technologies and the improvement which may be reached with specific interventions. Since the solution of the heat transfer differential equations is required, the analysis will be carried out by means of two software products which are based on the Finite Element and Finite Difference Methods.
2.
Structure of the thesisThe present Doctoral thesis consists of 4 chapters:
• Chapter 1 briefly describes the theoretical background of heat
transfer, paying attention on basic principles and fundamental equations. After a short theory recall, an explanation of the numerical solutions of heat differential equations is given, namely Finite Element and Finite Difference Methods, which are implemented by the two software products I used, Comsol Multiphysics and Fire Dynamic Simulator respectively.
• Chapters 2, 3, and 4 describe three different case studies, according
12 introduction to the problem, materials and methods (distinguished in several sub-paragraphs describing the steps of the adopted methodology), results and discussion, and conclusion. In more detail, Chapter 2 involves the analysis of the thermal behaviour of a Downhole Heat Exchanger for heating in the Province of Viterbo. Chapter 3 concerns the thermal behaviour of the external opaque enclosures and thermal bridges in a public building in Sabaudia (Latina, Central Italy), with regard to winter and summer conditions. Chapter 4, which is the most extensive part and the core of the whole work, investigates the thermal behaviour of five glasses. This research was carried out in collaboration with the Polytechnic University of Valencia (Spain).
3.
Published papers during the PhD studiesThe present Doctoral thesis includes some of the papers published during my PhD studies, which are mentioned at the beginning of each case study (Chapters 2 and 3). However, other scientific articles were published in International Journals or as Conference Papers. Here is the full list of the manuscripts:
1. Boubaker K, de Franchi M, Colantoni A, MonarcaD, Cecchini M, Longo L,
Allegrini E, Di Giacinto S, Biondi P, Menghini G. Prospective for hazelnut cultivation small energetic plants outcome in Turkey: Optimization and inspiration from an Italian model (2015) Renewable Energy, 74, pp. 523-527.
2. Carlini M, Allegrini E, Zilli D, Castellucci S. Simulating heat transfers through the building envelope: A useful tool in the economical assessment (2014) Energy Procedia, 45, pp. 395-404.
3. Carlini M, Castellucci S, Allegrini E, Giannone B, Ferrelli S, Quadraroli E, Marcantoni D, Saurini MT. Ceramic flaws: Laboratory tests and analysis using Scanning Electron Microscope to identify surface defects (2014) Journal of the European Ceramic Society, 34 (11), pp. 2655-2662.
13
4. Boubaker K, Colantoni A, Allegrini E, Longo L, Di Giacinto S, Monarca D,
Cecchini M. A model for musculoskeletal disorder-related fatigue in upper limb manipulation during industrial vegetables sorting (2014) International Journal of Industrial Ergonomics, 44 (4), pp. 601-605.
5. Allegrini E, Cocchi S, Carlini M, Castellucci S. Economic feasibility of energy-efficient solutions: an Italian case study towards green engineering.
4TH VALENCIA GLOBAL 2014, 19-20 June 2014, Valencia, Spain.
6. Carlini M, Castellucci S, Cocchi S, Allegrini E. Slaughterhouse wastes: A review on regulations and current technologies for biogas production (2014) Advanced Materials Research, 827, pp. 91-98.
7. Boubaker K, Colantoni A, Longo L, Menghini G, Baciotti B, Allegrini E, Cecchini M. Optimizing the energy conversion process: An application to a biomass gasifier-Stirling engine coupling system (2013) Applied Mathematical Sciences, 7 (137-140), pp. 6931-6944.
8. Carlini M, Castellucci S, Cocchi S, Allegrini E, Li M. Italian residential buildings: Economic assessments for biomass boilers plants (2013) Mathematical Problems in Engineering, 2013, art. no. 823851.
9. Cecchini M, Cossio F, Marucci A, Monarca D, Colantoni A, Petrelli M, Allegrini E. Survey on the status of enforcement of European directives on health and safety at work in some Italian farms (2013) Journal of Food, Agriculture and Environment, 11 (3-4), pp. 595-600.
10.Boubaker K, ColantoniA, Allegrini E, Longo L, Di Giacinto S, Biondi P. Short-Term perspectives for hybrid wind/solar/geothermal renewable energy (2013) International Journal of Renewable Energy Research, 3 (2), pp. 436-440.
11. Carlini M, Castellucci S, Allegrini E, Cocchi S. Heat transfers through the building envelope: a simulation for a private dwelling in Central Italy. 7th
14 International Image Processing & Wavelet on Real World Applications Conference IWW 2013, 5-6 September 2013, Valencia, Spain.
12.Colantoni A, Allegrini E, Boubaker K, Longo L, Di Giacinto S, Biondi P. New
insights for renewable energy hybrid photovoltaic/wind installations in Tunisia through a mathematical model (2013) Energy Conversion and Management, 75, pp. 398-401.
13.Mosconi EM, Carlini M, Castellucci S, Allegrini E, Mizzelli L, Arezzo Di Trifiletti M. Economical assessment of large-scale photovoltaic plants: An Italian case study (2013) Lecture Notes in Computer Science (including subseries Lecture Notes in Artificial Intelligence and Lecture Notes in Bioinformatics), 7972 LNCS (PART 2), pp. 160-175.
14.Marucci A, Monarca D, Cecchini M, Colantoni A, Allegrini E, Cappuccini A.
Use of semi-transparent photovoltaic films as shadowing systems in mediterranean greenhouses (2013) Lecture Notes in Computer Science (including subseries Lecture Notes in Artificial Intelligence and Lecture Notes in Bioinformatics), 7972 LNCS (PART 2), pp. 231-241.
15.Colantoni A, Allegrini E, Recanatesi F, Romagnoli M, Biondi P, Boubaker K.
Mathematical analysis of gasification process using Boubaker polynomials expansion scheme (2013) Lecture Notes in Computer Science (including subseries Lecture Notes in Artificial Intelligence and Lecture Notes in Bioinformatics), 7972 LNCS (PART 2), pp. 288-298.
16.Petroselli A, Arcangeletti E, Allegrini E, Nunzio R, Grimaldi S. The influence of the net rainfall mixed Curve Number – Green Ampt procedure in flood hazard mapping: a case study in Central Italy, AIIA Conference, September 2013.
17.Carlini M, Castellucci S, Allegrini E, Tucci A. Down-hole heat exchangers: Modelling of a low-enthalpy geothermal system for district heating (2012) Mathematical Problems in Engineering, 2012, art. no. 845192.
15
CHAPTER 1
THEORETICAL BACKGROUND
1.1
IntroductionIn order to describe natural phenomena, scientific computing encompasses a three-stage process: modelling of the problem by means of appropriate equations, computing the solution by an adequate software, and presenting the result generated by the software output [Pentenrieder, 2005].
According to this approach, the present chapter is aimed at describing the theoretical background of the scientific computing adopted in the research project. It briefly defines the different modes of heat transfer and the solution of the governing equations by means of the Finite Element Method (FEM) and Finite Difference Method (FDM). This is to better understand how the two software products I used implement and solve heat transfer equations. Then, attention will be focused on describing the software itself, namely Comsol Multiphysics and Fire Dynamic Simulator.
1.2
Modes of heat transferIf a system interacts with the surroundings, energy can be transferred in terms of work and heat. Broadly speaking, heat transfer is meant as the thermal energy in transit due to a spatial difference of temperature or gradient: consequently, whenever a temperature difference exists, heat transfer occurs. By definition, heat flows from the higher to the lower level of temperature, without performing work [Pentenrieder, 2005; Incropera et al., 2007].
To some extent, the amount of transferred heat (flow) is given by the multiplication of the transport coefficient by the potential gradient, where the former depends on the particular mode of heat transfer, while the second represents a derivative or some difference expression. The term flow may be related to heat flux -i.e. energy per time and area- or heat transfer rate -i.e. energy per time passing though a fixed reference area [Pentenrieder, 2005].
16 The modes of heat transfer processes can be distinguished as follows [Lewis
et al., 2004; Incropera et al., 2007]:
conduction, to refer the heat transfer occurring through the medium because of an exchange of energy from one molecule to another without the actual motion, or because of the motion of free electrons;
convection, which occurs between a moving fluid and a surface at different temperatures. The transfer occurs from one region to another because of macroscopic motion in a liquid or gas. It may be free, forced or mixed; thermal radiation: all bodies emit thermal radiation at all temperature which propagates by means of electromagnetic waves from the body surface. When these waves strike other bodies, a part of the radiation is transmitted, a part is reflected, and the remaining part is absorbed.
A real physical problem presents all modes of heat transfer in different and varying degrees: in order to correctly solve heat transfer problems, the most significant mode needs to be identified, deciding whether one of the others may be neglected [Lewis et al., 2004].
In heat transfer analysis, the amount of energy per unit time is a fundamental aspect and is given by the rate equations. For 1D heat conduction, the rate equation is expressed by Fourier's Law (Eq. 1.1). Newton's Law of cooling gives the rate equation for convective heat transfer (Eq. 1.2): the solution of heat conduction in solids often uses the convection heat transfer coefficient as a boundary condition. The maximum flux emitted by a radiating black surface is expressed by Stefan-Boltzmann Law (Eq. 1.3). Since a real surface emits less heat flux than that of a black surface, the radiative property -referred to as the emissivity of the material- is considered, as shown in Eq. 1.4 [Lewis et al., 2004; Incropera et al., 2007]. x dT q k dx = − ⋅ (1.1)
(
)
conv w f q = ⋅h T −T (1.2) 4 rad w q = ⋅σ
T (1.3) 4 rad w q = ⋅ ⋅ε σ
T (1.4)17
1.3
ConductionThe aim of a conduction analysis is to determine the temperature field in a medium resulting from conditions imposed on its boundaries: the temperature distribution is a function of space at steady state and as a function of time in transient conditions. Once it is known, the conduction heat flux at any point may be computed by Eq. 1.1 [Lewis et al., 2004; Incropera et al., 2007].
The conduction equation in Cartesian coordinates is derived by applying the energy conservation law to the differential control volume as shown in figure 1 (left). Thus, the transient heat conduction equation in anisotropic materials is expressed by: x y z p T T T T k k k G c x x y y z z
ρ
t ∂ ∂ ∂ ∂ ∂ ∂ ∂ + + + = ∂ ∂ ∂ ∂ ∂ ∂ ∂ (1.5)Eq. 1.5 is often referred to as the heat diffusion equation, provides the basic tool for heat conduction analysis, and describes an important physical condition, that is conservation energy. Its solution leads to determine the temperature distribution T(x, y, z) as a function of time. Hence, this equation states that at any point in the medium the net rate energy transfer due to conduction into a unit volume plus the volumetric rate of thermal energy generation must equal the rate of change of thermal energy stored within the volume. The heat diffusion equation may be also expressed both in cylindrical and spherical coordinates. Simplifications may be introduced in Eq. 1.5:
If thermal conductivity is
constant, introducing the thermal diffusivity α=k/ρ x cp: 2 2 2 2 2 2
1
T
T
T
G
T
x
y
z
k
α
t
∂
+
∂
+
∂
+ =
∂
∂
∂
∂
∂
(1.6)Under state-steady and
anisotropic conditions: x k Tx y k Ty z k Tz G 0 ∂ ∂ ∂ ∂ ∂ ∂ + + + = ∂ ∂ ∂ ∂ ∂ ∂ (1.7)
If the heat transfer is one-dimensional (e.g. in the x
direction) and no energy
generation occurs: 0 d dT k dx dx = (1.8)
18 The solution of Eq. 1.5 depends on the physical conditions existing at the boundaries of the medium and on conditions existing in the medium at some initial time if the problem is time dependent. The boundary conditions for conduction equation can be distinguished into two common types, namely constant surface temperature and constant heat flux (figure 1, right). While the former is often referred to as Dirichlet condition, in which the temperature on the boundaries is known:
0 T
T
=
T on
Γ
(1.9)in the latter condition, which is usually referred to as Neumann condition, the heat flux is imposed and is expressed as:
qf T q k h on n ∂ = − = Γ ∂ (1.10) If h is equal to zero, the insulated or adiabatic condition occurs. It should be noted that Eq. 1.5 has second-order terms and thus two boundary conditions are required. Moreover, since time appears as a first-order term, only one initial value is needed:
0 0
T
=
T all over the domain
Ω
at t
=
t
(1.11)The temperature is a scalar and makes easy to implement the constant or variable temperature conditions [Lewis et al., 2004; Incropera et al., 2007].
Figure 1: A differential control volume for heat conduction analysis (left); Boundary conditions (right) [Lewis et al., 2004].
19
1.4
ConvectionConvection can be divided into natural and forced convection: while in the former case, buoyancy force –induced by temperature differences and the thermal expansion of the fluid- drives the flow, the latter is created by an external force, for example a pump.
Flow with a higher inlet velocity will transport heat at higher rate: the flow rate is often described by a dimensionless parameter, called the Reynolds number. The Reynolds number represents the ratio of the inertia to viscous force: if it is small, inertia forces are insignificant relative to viscous forces. The disturbances are then dissipated and the flow remains laminar. For higher values and above its critical value, the inertia forces can be sufficient to amply the triggering mechanism so that a transition to turbulence occurs [Lewis et al., 2004; Incropera
et al., 2007; Comsol Multiphysics, 2o13].
Figure 2: Laminar and turbulent flow [Comsol Multiphysics, 2o13].
The mathematical model is governed by the Navier-Stokes equations, which conserve mass, momentum, and energy, as it is shown in the indicial forms of Eq. 1.12, 1.13, and 1.14 [Lewis et al., 2004]:
( )
i 0 i u t xρ
ρ
∂ ∂ + = ∂ ∂ (1.12) 2 2 i i i j j i i u u p u u t x x xρ
∂ + ∂ = −∂ +µ
∂ ∂ ∂ ∂ ∂ (1.13) 2 2 i i i T T T u t xα
x ∂ + ∂ = ∂ ∂ ∂ ∂ (1.14)20 In many heat transfer applications, data may be generated by non-dimensionalizing the Eq. 1.12, 1.13, and 1.14 using appropriate non-dimensional scales. These equations depend on the following dimensionless parameters [Lewis
et al., 2004; Incropera et al., 2007; Comsol Multiphysics, 2o13].
Re
ρ
U Lµ
⋅ ⋅ = (1.15) Pr cp kµ
⋅ = (1.16)(
)
3 2 s g T T L Grβ
ν
∞ ⋅ ⋅ − ⋅ = (1.17)(
)
3 Pr g Ts T L Ra Grβ
να
∞ ⋅ ⋅ − ⋅ = ⋅ = (1.18)1.5
Thermal radiationThermal radiation is associated with the rate at which energy is emitted by matter due to its finite temperature. As a matter of fact, at this moment it is being emitted by all the surrounding matter, such as the furniture and walls of the room for indoor conditions or by the ground, buildings, and the atmosphere and sun if you are outside [Incropera et al., 2007].
The mechanism of emission is related to energy released as a result of oscillations or transitions of the electrons that constitute matter and can be seen as a surface phenomenon. The spectral distribution varies with the nature and temperature of the emitting surface. In addition to the spectral nature, directionality is the second feature to consider: a surface may emit preferentially in certain directions, creating a directional distribution of the emitted radiation.
Since radiation that leaves a surface can propagate in all possible directions, radiation incident upon a surface may come from different directions, and the manner in which the surface responds depends on the direction. Such effect can be important in determining the net radiative heat transfer rate and may be treated by introducing the concept of radiation intensity [Incropera et al., 2007].
For a spectral component of the irradiation, portions of this radiation may be reflected, absorbed and transmitted, and from a radiation balance on the medium, it follows that:
21
,ref ,abs ,tr Gλ =Gλ +Gλ +Gλ
(1.19)
Figure 3: Absorption, reflection and transmission processes associated with a semitransparent medium [Comsol Multiphysics, 2o13].
Usually, the calculation of these components is complex, depending on the upper and lower surface conditions, the wavelength of the radiation, and the composition and thickness of the medium. Since in most engineering applications the medium is opaque, Gλ.tr is equal to zero. The absorption and reflection processes may be treated as surface phenomena and it is interesting to note that they are responsible of our perception of colour.
The absorptivity determines the fraction of the irradiation absorbed by a surface. The reflectivity is a property that determines the fraction of the incident radiation reflected by a surface. It depends on the direction of the incident and reflected radiation [Incropera et al., 2007; Comsol Multiphysics, 2o13].
1.6
Solution of heat transfer equations: FEM and FDMSince analytical solutions to many heat transfer problems are not often possible because of the geometry or boundary conditions complexity, a numerical solution is required in such situations. The Finite Element (FEM), Finite Difference (FDM) and Finite Volume Method (FVM) are the most commonly employed numerical techniques [Lewis et al., 2004; Nikishov, 2004].
While an analytical solution leads to the temperature determination at any point of the medium, a numerical solution is referred to discrete points in which the temperature distribution is given. As a consequence, the first step is
22 represented by selecting these points simply dividing the region of interest into a number of smaller sub-regions [Lewis et al., 2004].
The FEM is a numerical tool for calculating approximate solutions of many engineering problems. According to this approach, the solution region encompasses many small and interconnected elements and gives a piece-wise approximation to the governing equations. Therefore, the complex Partial Differential Equations (PDEs) are reduced to either linear or nonlinear simultaneous equations. Thank to the finite element discretization , the continuum problem, having an infinite number of unknowns, is reduced to one with a finite number of unknowns at specified points, called nodes [Hughes 2000; Zienkiewicz and Taylor, 2000; Lewis et al., 2004].
According to the FEM technique, the solution of a continuum problem is approximated by the following step-by-step procedure, as shown in figure 4 [Lewis et al., 2004]:
• discretization of the continuum: divide the solution region into
non-overlapping elements. A variety of elements shape -e.g. triangles or quadrilaterals- is allowed;
• selection of the shape functions: it is to choose the type of interpolation that represents the variation of the field variable over the element;
• formulation of the element equations: this step creates the matrix equations which express the properties of the individual elements by forming a Left Hand Side (LHS) matrix and a load vector:
[ ]
e 11 11 Ak K l − = − (1.20){ }
i e j Q f Q = (1.21)• assembling the element equations to obtain a system of simultaneous
equations: this is to obtain a resulting matrix which represents the behaviour of the entire solution region of the problem:
[ ]
K T
{ } { }
=
f
23
• solving the system of equations: Eq. 1.22 may be solved to obtain the
nodes values of the field variable, for example temperature;
• calculation of the secondary quantities from the nodal values, such as
the space heat flux.
Figure 4: Numerical model for heat transfer calculations [Lewis et al., 2004].
The physical formulation can be transformed into its finite element discrete analogue by following several approaches. If the former is a Partial Differential Equation, the Galerkin method is chosen, as in the present research project. According to this technique, the domain is divided into finite elements connected at nodes and shape functions Ni are introduced for interpolating the temperature inside a finite element:
[ ]
{ }
T
=
N T
(1.23)
[ ] [
N
=
N N
1 2...
]
(1.24){ } {
T
=
T T
1 2...
}
(1.25)By differentiating the temperature interpolation equation given by (1.23), it follows:
{ }
[ ]
{ }
1 2 1 2 1 2 / / / ... / / / ... / / / ... T x N x N x T y N y N y T B T T z N z N z ∂ ∂ ∂ ∂ ∂ ∂ ∂ ∂ = ∂ ∂ ∂ ∂ = ∂ ∂ ∂ ∂ ∂ ∂ (1.26)24 Thus, using the Galerkin method and considering Eq. 1.1, Eq. 1.5 can be written as: 0 y x z p i V q q q T G c N dV x y z ρ τ ∂ ∂ ∂ ∂ + + − + = ∂ ∂ ∂ ∂
∫
(1.27)Applying the divergence method to the first three terms in Eq. 1.27 and inserting the boundary conditions, the discretized finite element equations for heat transfer problems in an isotropic body is given by [Nikishov, 2004]:
[ ]
C T{ }
& +(
[ ] [ ] [ ]
Kc + Kh + Kr)
{ } { }
T = RT +{ } { }
RQ + Rq +{ } { }
Rh + Rr (1.28) where:[ ]
[ ] [ ]
T p V C =∫
ρ
c N N dV (1.29)[ ]
[ ] [ ]
T c V K =∫
k B B dV (1.30)[ ]
[ ] [ ]
3 T h S K =∫
h B B dV (1.31)[ ]
{ }
4[ ]
4 r S K T =∫
σε
T N dS (1.32)[ ]
{ } { }
[ ]
1 T T T S R = −∫
q n N dS (1.33)[ ]
T Q V R Q N dV = − ∫
(1.34)[ ]
2 T q s S R q N dS = − ∫
(1.35)[ ]
[ ]
3 T h e S R = −∫
hT N dS (1.36)[ ]
[ ]
4 T r surf r S R = −∫
α q N dS (1.37)In order to solve partial differential equations of heat transfer, the software Comsol Multiphysics implements FEM.
25 The FDM is based on replacing differential equations by algebraic equations, where derivatives are substituted by differences. According to this approach, problems can be distinguished into explicit or implicit methods. While the former yields the temperature at a given time level directly from the previously computed values, the latter solves a simultaneous system of algebraic equations at each time step. The explicit technique provides a simple and effective algorithm, although stability constraints impose a maximum limit on the length of time steps (Wang, 1995; Agarwal, 2010).
If the calculations are performed over a large period of time, a high number of steps is required. The implicit method has no restriction on the size of the time step and this goal is successfully reached by the so called Crank-Nicholson approach. This scheme is a combination of the forward Euler method at n and the backward Euler method at (n+1) (Özisik, 1994). The software Fire Dynamic Simulator is based on this approach, updating the temperature at the centre of each solid cell Ts,i in time. The discretization indexing system is shown in figure 5.
Figure 5: Crank-Nicolson’s discretization scheme.
Hence the terms in Eq. 1.5 becomes:
(
)
(
)
, 1 , n n s i s i s s s s s i T T T c c t tρ
ρ
δ
+ − ∂ ⋅ = ⋅ ⋅ ∂ (1.38)(
)
(
)
(
)
(
)
, 1/2 , 1 , , 1/ 2 , , 1 2 1 1 1 1 , 1/ 2 , 1 , , 1/ 2 , , 1 1 2 n n n n s i s i s i s i s i s i s s n n n n s i s i s i s i s i s i k T T k T T T k x xδ
x k T T k T T + + − − + + + + + + − − ⋅ − − ⋅ − + ∂ ∂ = ∂ ∂ + ⋅ − − ⋅ − (1.39) The temperatures at the front and back surface are determined from the boundary conditions. The boundary conditions at the front surface are given by:1 1 ,1 ,0 ,1 2 n n s s s conv rad T T k q q x
δ
+ − + − = + (1.40)26 The convective heat flux is calculated as:
(
1)
g ,1/2 ,1/2 1 h T 2 n n conv s s q = − T +T + (1.41)The radiative heat flux is expressed by:
( )
1 4 , T,1/2n rad rad IN s
q =q −
εσ
+ (1.42)Introducing Taylor series expansion for Eq. (1.42), the front boundary condition becomes:
(
)
(
)
(
)
1 1 ,1 ,0 ,1 2 3 4 1 1 g ,1/ 2 ,1/ 2 , ,1/ 2 ,1/2 ,1/ 2 1 h T 4 3 2 n n s s s n n n n n s s rad IN s s s T T k x T T q T T Tδ
εσ
εσ
+ + + + − − ≈ − + + − ⋅ + (1.43)Similar considerations occur for the back boundary conditions [McGrattan
et al., 2013].
1.6.1 Comsol Multiphysics
1.6.1.1 General description
Comsol Multiphysics is a powerful interactive environment for modelling and solving a huge variety of scientific and engineering problems, extending conventional models for one type of physics into multiphysics models that solve coupled physics phenomena simultaneously. When solving the models, the software runs the finite element analysis together with adaptive meshing (if selected) and error control using a variety of numerical solvers [Comsol Multiphysics, 2o13].
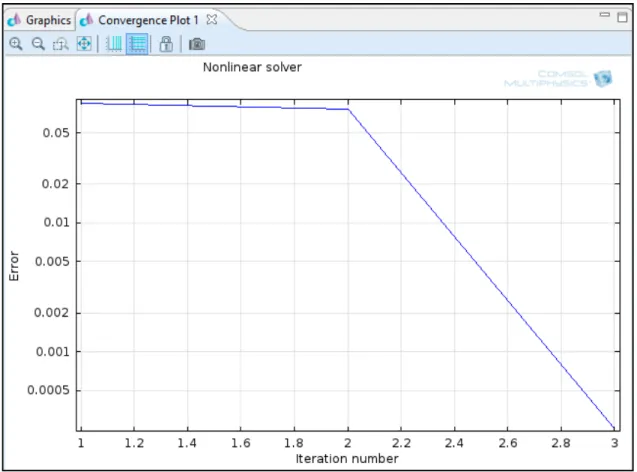
The Comsol Multiphysics environment is completely controlled by the Comsol Desktop, consisting of the Model Builder, node settings, Graphics windows, and other dockable windows. They can be opened, closed, and placed according to the modelling settings you need to access and the Graphical User Interface (GUI) configuration you want to work in. At the top of every window is the main menu and toolbar, which has a drop down menu and standard buttons for frequently used actions. At the right bottom corner of the Desktop is the Messages, Progress and Numerical results window (figure 6) [Comsol Multiphysics, 2o13].
27 When COMSOL Multiphysics is first opened, or when you start creating a new model, the GUI displays the Model Builder, Model Wizard, and Graphics windows (figure 7). The modelling procedure is controlled by the following steps: geometry or drawing phase, selection of the physics, meshing, solving, and postprocessing (figure 8).
Figure 6: The Comsol Desktop with its major windows in a widescreen layout [Comsol Multiphysics, 2o13].
Figure 7: Model Builder, Model Wizard, and Graphics window when launching the software.
28 The Model Wizard window contains a series of pages to help the user in starting to build a model (figure 9) [Comsol Multiphysics, 2o13]:
• Select Space Dimension, namely 3D, 2D axisymmetric, 2D, 1D
axisymmetric, 1D, or 0D. 0D is used for physics interfaces modelling spatially homogeneous systems such as chemical reacting systems and electrical circuits;
• Select Physics, e.g. heat transfer in solids;
• Select Study Type depending on the set of physics and mathematics
interfaces included in the model. The user can select the study type from one of the following branches:
Preset Studies for Selected Physics: the study types applicable to all of the interfaces which you have chosen to solve for (Stationary, Time Dependent, Eigenfrequency, Eigenvalue and Frequency Domain);
Custom Studies: this branch contains study types for which not all physics solved for can generate suitable equations.
Figure 9: The three pages in the Model Wizard window [Comsol Multiphysics, 2o13].
The Model Builder window includes a model tree with all the functionality and operations for building and solving models and displaying the results. These are introduced to your modelling procedure by adding a branch, such as the
29 Geometry branch. Branches can have further nodes that relate to their parent node. A leaf is considered to be the final node in a branching structure (tree) and usually has a number of attributes with their own settings that are characteristic to it. Branches and sub-branches can also contain attributes and settings.
The user can proceed through the Model Builder by selecting the branches in the order suggested by their default positions, from the top down, or selecting and defining each branch as needed. The main
branches include Global Definitions, Model, Study, and Result (figure 10).
The Global Definitions branch
collects parameters, variables, and functions accessible at all levels in the Model Builder.
The Model branch encompasses Definitions (D), Geometry (G), Materials (Ma), the selected Physics (P), and Mesh (Me). The D branch (one per Model) collects the definitions of variables, functions, and other objects whose geometric scope is restricted to a single model. The G branch is the drawing phase where the user can build the chosen geometry in the Model Wizard by using geometrical operations or importing CAD data. The Ma branch is where all the material properties are given: the Material Browser, namely a database, is available for rapidly adding a material. The P branch is the selected physics in the Model Wizard, containing the governing equations of the phenomenon and the required boundary
conditions for solving the problem (figure 11). The Me branch contains the sequence of operations that defines the computational meshes for the model, and enables the discretization of the geometry model into small units of simple shapes, referred to as mesh elements (triangles, quadrilaterals, or tetrahedral, hexahedral, prism, or pyramid mesh elements).
Figure 10: The Model Builder branches and sub-branches [Comsol Multiphysics, 2o13].
30 The Study branch is where the user can set up study steps and solver configurations for solving a model using one or more study types for different analyses.
The Results branch is for presenting and analysing the results [Comsol Multiphysics, 2o13].
Figure 11: Boundary conditions [Comsol Multiphysics, 2o13].
The Graphicswindow presents a graphical view of the geometry, mesh, and
results of the model. Furthermore, it has useful tools for changing the view and selecting multiple entities—geometry objects as well as domains, boundaries, edges, and points for defining the physics or selecting geometric entities.
The Graphics toolbar at the top of the Graphics window contains a set of tools for changing the visualization (for example, to zoom in or out or to add transparency) and making selections.
Plot windows are closable graphics windows. They are automatically generated for displaying results while solving. The Messages window contains information useful to the user after an operation is performed, namely the number of mesh elements and degrees of freedom in your model. The Progress window displays the progress of the solver or mesher during the process, including a progress bar and progress information for each solver or mesher. The Log window
31 contains information from previous solver runs. A horizontal divider
(===============) indicates the start of a new solver progress log. To differentiate
logs from different models, the log contains a horizontal divider displaying the name of the Model MPH-file each time a model is opened (figure 12) [Comsol Multiphysics, 2o13].
There are three COMSOL Multiphysics model file formats: MPH-files, Model Java-files, and Model M-files. The default standard file with the extension .mph, containing contains both binary and text data. The mesh and solution data are stored as binary data, while all other information is stored as plain text. All the models in the COMSOL Multiphysics Model Library and the model libraries in the add-on modules are MPH-files. Model M-files are editable script files, similar to the Model Java-files, for use with MATLAB ) [Comsol Multiphysics, 2o13].
Figure 12: Graphics, Messages, Progress, and Log window.
Several add-on products are available for COMSOL Multiphysics, as it is shown in figure 13. The present research investigates the use of the Heat Transfer module. The Heat Transfer interfaces model heat transfer by conduction and convection. Surface-to-ambient radiation effects around edges and boundaries can also be included. The interfaces are suitable for modelling heat transfer in solids and fluids. The interfaces are available in 1D, 2D, and 3D and for axisymmetric models with cylindrical coordinates in 1D and 2D. The default dependent variable is the temperature, T [Comsol Multiphysics, 2o13].
32
Figure 13: Suitable modules in Comsol Multiphysics [Comsol Multiphysics, 2o13].
1.6.2 Fire Dynamic Simulator
1.6.2.1 General description
Fire Dynamic Simulator (FDS) is a computational fluid dynamics (CFD) modelling software for describing fire-driven fluid flows. FDS numerically solves a form of the Navier-Stokes equations appropriate for low-speed, that is Ma<0, 3, thermally-driven flow emphasising the presence of smoke and heat transport. The software has been validated and verified. Smokeview is a separate visualization program that is used to display the results of an FDS simulation [McGrattan et al., 2013].
FDS and Smokeview are free and open-source software tools provided by the National Institute of Standards and Technology (NIST) of the United States Department of Commerce. Furthermore, this software is not subject to copyright protection and is in the public domain [McGrattan et al., 2013].
Since it is a Fortran program, the software reads input parameters from a text file and writes user-specified output data to files. FDS approximates the governing equations on a rectilinear mesh: all the rectangular obstructions are required to conform to the underlying mesh. All solid surfaces have thermal boundary conditions and heat and mass transfer to and from solid surfaces is usually handled by empirical correlations [McGrattan et al., 2013].
The work described in chapter 4 is based on the use of FDS 6, which was released in 2013.
33
1.6.2.2 Boundary conditions in FDS
In FDS the solid surfaces are considered as multiple layers of multiple material components: heat conduction is assumed to occur normally to the surface. The boundary condition on the front surface of a solid obstruction is given by:
( )
0, s s conv rad T k t q q x ∂ = + ∂ (1.44)If the radiation is assumed to penetrate in depth, the surface radiation term is set to zero.
On the back surface, there are two possible boundary conditions: if the back surface is assumed to be open to an ambient void or to another part of the computational domain, the back side boundary is similar to that of the front side; or if the back side is assumed to be perfectly insulated, an adiabatic condition is used [McGrattan et al, 2013]:
0 s s T k x ∂ − = ∂ (1.45)
If the thermal radiation from the surroundings is assumed to be absorbed within an infinitely thin layer at the surface of the solid obstruction, the net radiative heat flux is given by the sum of incoming and outgoing components:
,IN , rad rad rad OUT
q =q −q (1.46)
where qrad,IN depends on the intensity of the wall and its emissivity and qrad,OUT is calculated according to Stefan-Boltzmann’s law. In this formulation, the surface emissivity and the internal absorption are assumed to be constant.
The calculation of the convective heat flux depends on whether a Direct Numerical Simulation (DNS) or a Large Eddy Simulation (LES) is chosen. In the former, it is obtained directly from the gas temperature gradient at the boundary:
/ 2 w g conv T T T q k k n δn − ∂ = − = − ∂ (1.47)
In an LES calculation, the convective heat flux takes into account the convective heat transfer coefficient, which is based on a combination of natural and forced convection correlations:
(
)
conv g w q =h T −T
34 where h is given by:
1/3 max | g w| ,k h C T T Nu L = − ⋅ (1.49)
The thermal conductivity and volumetric heat capacity of a solid are defined as follows: , 1 m N s s k X kα α α = =
∑
(1.50) , , 1 m N s sc sαcsα α ρ ρ = =∑
(1.51)1.6.2.3 Procedure to run an FDS calculation
FDS can be run from the command prompt on a single or multiple computers (figure 14). Input files are typically given names in order to easily identify the particular case, followed by the suffix .fds. The operation of FDS is based on a single ASCII (American Standard Code for Information Interchange) text file, which contains parameters organize into namelist groups. The latter consists of a Fortran input record. Parameters are specified within an input file by using namelist formatted records, beginning with the ampersand character & followed by the name of the namelist group, a coma-delimited list of input parameters, and a forward slash / [McGrattan et al., 2013].
Figure 14: Command prompt to run an FDS simulation.
FDS reads the entire input file which is between:
& _ /
& /
HEAD CHID job name
TAIL
=
35 When writing an input file, a general rule is to add parameters which differ from the default value: this is a good way to easily distinguish what you want and FDS wants. Moreover, when setting up an input file, the first thing to do is to give the project a name. The namelist group HEAD encompasses such information by means of two parameters as shown in the example below:
&H E A D C H ID = 'W T C _ 05 ', T IT L E ='T E S T _ 01 '/ (1.53)
CHID is a string of 3o characters as maximum number and is used to tag the output files. TITLE is a string containing the maximum number of 60 characters and is simply a brief descriptive text [McGrattan et al., 2013].
TIME is the name of a group of parameters, defining the time duration of the simulation and the initial time step used to advance the solution of the discretized equations. The simulation time is set by the parameter T_END, which is equal to 1 second by default. If we want to instruct FDS to run a simulation for 5400 seconds, the following line is required:
&T IM E T _E N D = 540 0 / (1.54)
Moreover, if the time line to start is a number other than zero, the parameter T_BEGIN can be used in order to specify the time written to file for the first time step. This is useful for matching time lines coming from experimental data or video recordings [McGrattan et al., 2013].
A domain is required in order to perform an FDS calculation: this goal is achieved by creating meshes. A mesh is divided into rectangular cells, whose number depends on the desired resolution of the flow dynamics. The computational domain is defined by the namelist MESH. The origin point of a mesh is defined the first, third and fifth values of the real number sextuplet, XB, while the second, fourth and sixth values refer to the opposite corner. An example is given below:
&M E SH IJK =10, 20, 30, X B=0.0,1.0, 0.0, 2.0, 0.0, 3.0 / (1.55)
The line defines a mesh whose volume extends from the origin (0, 0, 0) up to 1 m in the positive x direction, 2 m in the positive y direction, and 3 m in the positive z direction. The parameter IJK subdivides the mesh into uniform cells: in the present examples, it is made of 10 cm-cubes. Broadly speaking, mesh cells should resemble cubes, that is their length, width, and height ought to be roughly the same. Moreover, if obstructions or vents extend beyond the mesh boundary,
36 they will be cut off at the boundary and will not appear in Smokeview [McGrattan
et al., 2013].
The second and third dimensions of the mesh, J and K, should be of the form 2l 3m 5n, where l, m, and n are integers, since part of the calculation uses a Poisson solver based on Fast Fourier Transforms (FFTs). This requirement is not needed for the first number of mesh cell divisions, i.e. the I in the IJK, because it does not use FFTs. Figure 15 shows list of numbers between 1 and 1024 which can be factored down to 2’s, 3’s and 5’s [McGrattan et al., 2013]:
Figure 15: List of numbers that can be factored down to 2’s, 3’s and 5’s [McGrattan et al., 2013].
MISC is the namelist group of global miscellaneous input parameters. Only one MISC line should be entered in the data file. The MISC parameters vary in scope and importance. An example is given by the following line:
&M ISC T M P A= 25 / (1.56)
which sets the ambient temperature within the computational domain at 25ºC (by default it is equal to 20ºC) [McGrattan et al., 2013].
An FDS simulation usually begins at time t = 0 with ambient conditions: the air temperature is assumed to be constant with height, and its density and pressure decrease with height (z direction). If the user wants to modify the local initial temperature, the following line can be added:
&IN IT X B =0.0, 0 .1, 0.0, 0 .02 5, 0.0, 0.1, T E M P E R A T U R E=6 0 / (1.57)
This is to indicate that the temperature is equal to 60ºC instead of the ambient within the bounds given by the sextuplet XB [McGrattan et al., 2013].
The geometry into an FDS model is described in terms of rectangular obstructions and vents: both need to be assigned a boundary condition describing its thermal properties. The bounding surfaces consist of the characteristics which are defined by the solid surfaces of a smooth inert wall with the temperature fixed at TMPA, referred to as ‘INERT’. Any SURF lines do not need to be added if only this boundary condition is required. Each SURF line consists of an identification
37 string ID = ‘…’: this is to allow references to it by an obstruction or vent. Hence, the character string SURF_ID = ‘…’ on each obstruction or vents indicates the ID of the SURF line containing the desired boundary condition parameters [McGrattan
et al., 2013].
The geometry is described in terms of rectangular obstructions defined by the parameters in the namelist group OBST. The entire model is made up of rectangular solids, each one introduced on a single line in the input file. Each OBST line contains the coordinates of a rectangular solid within the flow domain: its position and geometry are defined by two points, (x1, y1, z1) and (x2, y2, z2), that are entered on the OBST line in terms of a sextuplet XB. In addition to the coordinates, the parameter SURF_ID can be used to specify a boundary condition. If different properties occur for the top, sides and bottom of an obstruction, SURF_IDS can be used instead of one SURF_ID. SURF_IDS is an array of three character strings specifying the boundary condition IDs for the top, sides, and bottom respectively [McGrattan et al., 2013].
The VENT group is used to prescribe planes adjacent to obstructions or external walls and are defined by a sextuplet XB denoting a plane abutting a solid surface.. XB can be replaced by MB (Mesh Boundary) to easily specify an entire external wall. MB is a character string, whose value is one of the following: ‘XMAX’, ‘XMIN’, ‘YMAX’, ‘YMIN’, ‘ZMAX’, ‘ZMIN’, denoting x = XMAX, x = XMIN, y = YMAX, y = YMIN, z = ZMAX, and z = ZMIN respectively. The boundary condition of a vent is expressed by means of SURF_ID. No SURF_ID needs to be set if the default boundary condition is desired. A VENT may have three different SURF_IDs [McGrattan et al., 2013]:
namelist group SURF. The default boundary condition is ‘OPEN’, which is used only if the VENT is applied to the exterior boundary of the computational domain. By default, FDS assumes that the exterior boundary of the control volume, namely the XBs on the MESH line, is a solid wall. In order to create a totally or partially open domain, OPEN vents can be used on the exterior mesh boundaries;
‘MIRROR’, which is used to denote a symmetry plane, corresponding to a no-flux, free-slip boundary. It can be applied only to any exterior boundary of the computational domain;
38 In order to clearly visualize the results of a simulation, colouring obstruction or vents is useful. Colours can be prescribed into two ways: a triplet of integer colour values, RGB, or a character string, COLOR.
The three RGB integers range from 0 to 255, depending on the amount of Red, Green or Blue that make up the colour. Colour parameters can be specified on a SURF line. The word COLOR needs to be typed exactly as it is listed in the colour tables (figure 16) [McGrattan et al., 2013].
Figure 16: Colour definitions (RGB) [McGrattan et al., 2013].
1.6.2.4 Thermal boundary conditions
Thermal boundary conditions are often used where there is a few information about the properties of the solid materials. If they are known, it is better to specify these properties and let the model compute the heat flux and temperatures of walls and other solid surfaces. The thermal properties of a solid boundary are specified by means of MATL namelist [McGrattan et al., 2013].
39 A solid boundary may consist of multiple layers of different materials, and each layer can consist of multiple material components. By default, the maximum number of material layers is 20 and the maximum number of material components is 20. Material layers and components are defined by the SURF line via the array MATL_ID (IL, IC). IL is an integer indicating the layer index, starting at 1 (layer at the exterior boundary), while IC is an integer indicating the component index. For instance, MATL_ID (2, 3) = ‘BRICK’ indicates that the third material component of the second layer is BRICK [McGrattan et al., 2013].
Without arguments, the parameter MATL_ID is assumed to be list of the materials in multiple layers, where each layer consists of only a single material
component. Thermal CONDUCTIVITY [W/(m x K)], DENSITY (kg/m3),
SPECIFIC_HEAT [kJ/ (kg x K)], and EMISSIVITY (0,9 by default) can be specified for any solid material. Moreover, both CONDUCTIVITY and SPECIFIC_HEAT can be functions of temperature, while DENSITY and EMISSIVITY cannot. Temperature-dependence is specified by using the RAMP convention: in this case, the RAMP parameter T means temperature, and F is the value of either the specific heat or conductivity. An ABSORPTION_COEFFICIENT (1/m) can be also assigned to the solid material, allowing the radiation to penetrate and absorbing into the solid [McGrattan et al., 2013].
The layers of a solid boundary are listed in order from the surface. By default, this inner layer is assumed to be in direct contact with an air gap at ambient temperature. However, there are other back side boundary conditions: for example, one considers that the wall backs up to an insulated material in which case no heat is lost to the backing material. In this case, BACKING = ‘INSULATED’ must be added in the SURF line: this condition means that no other properties of the inner insulating material need to be specified because it is considered as perfectly insulated [McGrattan et al, 2013].
In order to calculate the heat transfer through the wall into the space behind the wall when the latter is assumed to back up to the room on the other side of the wall, BACKING = ‘EXPOSED’ needs to be listed on the SURF line [McGrattan et
al., 2013].
However, sometimes a fixed temperature boundary condition may be useful and TMP_FRONT can be set up in the model (by default it is given in °C). If the convective heat transfer needs to be specified, a constant value
40
HEAT_TRANSFER_COEFFICIENT [W/(m2 x K)] on the SURF line can be added.
Furthermore, instead of altering the convective heat transfer coefficient, a fixed heat flux can be specified. To do that, the NET_HEAT_FLUX (kW/m2) can be defined: when this parameter is specified, FDS will compute the surface temperature required to ensure that the combined radiative and convective heat flux from the surfaces is equal to the given NET_HEAT_FLUX [McGrattan et al., 2013].
![Figure 3: Absorption, reflection and transmission processes associated with a semitransparent medium [Comsol Multiphysics, 2o13]](https://thumb-eu.123doks.com/thumbv2/123dokorg/2778522.1445/21.892.281.641.110.434/figure-absorption-reflection-transmission-processes-associated-semitransparent-multiphysics.webp)

![Table 2: Data of the main thermal springs in the province of Viterbo [ Piscopo et al., 2006]](https://thumb-eu.123doks.com/thumbv2/123dokorg/2778522.1445/45.892.128.796.472.730/table-data-main-thermal-springs-province-viterbo-piscopo.webp)

![Figure 27: Share of losses and gains in the private buildings, public bodies' buildings and industry [Mazzarella and Piterà, 2013]](https://thumb-eu.123doks.com/thumbv2/123dokorg/2778522.1445/56.892.225.687.233.464/figure-share-private-buildings-buildings-industry-mazzarella-pitera.webp)
![Figure 30: View of the building F from Via Vittorio Emanuele II [Google Maps].](https://thumb-eu.123doks.com/thumbv2/123dokorg/2778522.1445/58.892.159.766.819.1074/figure-view-building-vittorio-emanuele-ii-google-maps.webp)