R E S E A R C H A R T I C L E
Open Access
A new chronobiological approach to discriminate
between acute and chronic depression using
peripheral temperature, rest-activity, and light
exposure parameters
Cláudia Ávila Moraes
1, Trinitat Cambras
2, Antoni Diez-Noguera
2, Regina Schimitt
1, Giovana Dantas
1,
Rosa Levandovski
1and Maria Paz Hidalgo
1,3,4*Abstract
Background: Circadian theories for major depressive disorder have suggested that the rhythm of the circadian
pacemaker is misaligned. Stable phase relationships between internal rhythms, such as temperature and rest/activity, and the external day-night cycle, are considered to be crucial for adapting to life in the external environmental. Therefore, the relationship and possible alterations among (i) light exposure, (ii) activity rhythm, and (iii) temperature rhythm could be important factors in clinical depression. This study aimed to investigate the rhythmic alterations in depression and evaluate the ability of chronobiological parameters to discriminate between healthy subjects and depressed patients. Methods: Thirty female subjects, including healthy subjects, depressed patients in the first episode, and major recurrent depression patients. Symptoms were assessed using Hamilton Depression Scale, Beck Depression Inventory and Montgomery-Äsberg Scale. Motor activity, temperature, and light values were determined for 7 days by actigraph, and circadian rhythms were calculated.
Results: Depressed groups showed a lower amplitude in the circadian rhythm of activity and light exposure, but a higher amplitude in the rhythm of peripheral temperature. The correlation between temperature and activity values was different in the day and night among the control and depressed groups. For the same level of activity, depressed patients had lowest temperature values during the day. The amplitudes of temperature and activity were the highest discriminant parameters.
Conclusions: These results indicate that the study of rhythms is useful for diagnosis and therapy for depressive mood disorders.
Keywords: Depression, Temperature, Activity, Light, Circadian rhythm Background
Depression is among the most prevalent, debilitating, and potentially fatal mental disorders [1,2]. The onset of symptoms is sex-dependent, with the highest prevalence in females. Experimental evidence suggests that during development, alterations in the medial amygdala cause
sexual dimorphism in the expression level of an evolu-tionarily conserved pathway that affects mitochondrial and circadian clock function [3]. Mitochondrial and circadian clock function are associated with mood disorders [4].
The brain's primary circadian pacemaker is the supra-chiasmatic nucleus (SCN), which is synchronized by light input from melanopsin-containing retinal ganglion cells, and consecutively its system synchronizes subsidiary oscil-lators [4,5]. Changes in SCN-dependent rhythms have been observed in patients with mood disorders [6]. There-fore, depressive symptoms can be a consequence of an
* Correspondence:[email protected]
1Laboratório de Cronobiologia do Hospital de Clínicas de Porto Alegre (HCPA), da Universidade Federal do Rio Grande do Sul (UFRGS), Ramiro Barcelos, 2350 sala 12107, Porto Alegre, RS 90035-003, Brazil
3
Programa de Pós-Graduação em Ciências Médicas: Psiquiatria, UFRGS, Porto Alegre, Brazil
Full list of author information is available at the end of the article
© 2013 Moraes et al.; licensee BioMed Central Ltd. This is an Open Access article distributed under the terms of the Creative Commons Attribution License (http://creativecommons.org/licenses/by/2.0), which permits unrestricted use, distribution, and reproduction in any medium, provided the original work is properly cited.
altered response to input of environmental cues, such as light exposure [7].
Depressive symptoms improve after light therapy [8]. The efficacy of bright light therapy as an adjuvant treat-ment to antidepressant pharmacotherapy in nonseasonal depression has also been demonstrated [9]. Studies sug-gest that bright light therapy alone is more efficacious for seasonal affective disorder than it is for nonseasonal de-pression [9], probably because there are different levels of SCN involvement in the aetiology of depressive mood.
In depressive patients, changes in the time of light ex-posure and social life show greater variability and are prone to desynchronization in rest-activity and tem-perature [10]. One of the first circadian theories for major depressive disorder suggested that the circadian pacemaker is misaligned with respect to the timing of sleep, as well as to the activity-rest rhythm [11,12]. This evidence combined with the clinical observation that al-tered physical activity has long been recognized as a fea-ture of depression [13], indicate that this variable could be one of the main parameters involved in mood disor-ders [14].
Other characteristics of patients with depressive episodes include the presence of daytime mood variations, and al-terations in the circadian secretion of cortisol and adreno-corticotropic hormone [6]. Exogenous administration of human corticotropin-releasing hormone provokes signifi-cant phase-advancements in body temperature [15], one of the most robust circadian rhythms [16]. Abnormal body temperature variation, which has been observed in de-pressed patients, could be considered as a functional dis-turbance located at the level of circadian organization [17]. Stable phase relationships between internal rhythms, such as temperature and rest/activity, and the external day-night cycle, are considered important for adapting to life in the external environmental [18,19]. Therefore, the relationship and possible alterations among (i) light expos-ure, (ii) activity rhythm, and (iii) temperature rhythm could be important factors in clinical depression. We hy-pothesized that these three variables are disrupted in de-pression and that they might be important for the evaluation of clinical depression. Therefore, we designed a cross-sectional study to examine this chronodisruption in depression, and to evaluate the capacity of chronobiotic parameters to discriminate between healthy subjects, de-pressed patients in their first episode without previous treatment, and patients with major recurrent depression.
Methods
Sample characteristics
The investigation followed a cross-sectional design and was conducted in the city of Porto Alegre, which is lo-cated in the extreme south of Brazil (30° 05' South and 51° 10' West). This study was performed according to
international ethical standards [20] and was conducted in accordance with the Declaration of Helsinki. The study protocol (number 06-268 GPPG/HCPA) was ap-proved by the Ethics Committee at the Hospital de Clínicas de Porto Alegre (HCPA), and all participants signed an informed consent form.
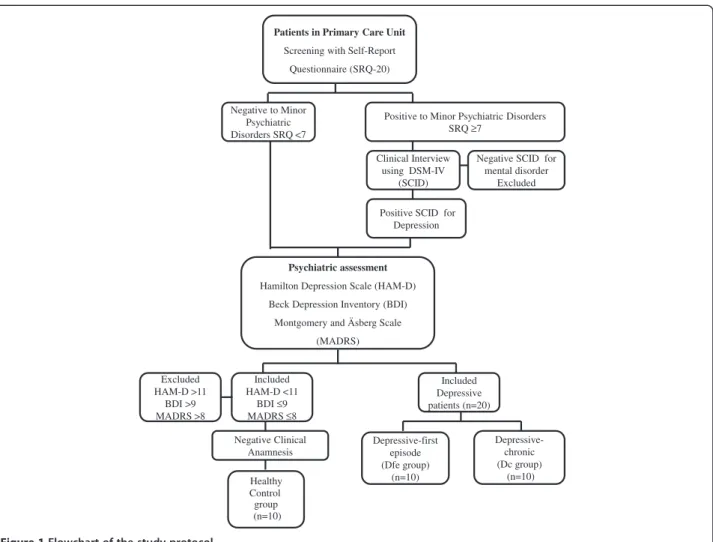
The flowchart of the study protocol is shown in Figure 1. Thirty female patients aged between 18 and 60 -years (10 controls and 20 depressed patients) were se-lected using the Self-Report Questionnaire (SRQ-20), which was used to assess minor psychiatric disorders at the municipal primary health care units. The volunteers were referred for an additional assessment by psychia-trists in the psychiatric outpatient clinic at the hospital (HCPA). The Structured Clinical Interview for DSM-IV (SCID) was conducted to diagnose depression.
Ten patients met the criteria for a first depressive epi-sode; they had not used antidepressants previously (de-pressive-first episode: Dfe group). Ten patients were
diagnosed with major recurrent depression (mean num-ber of episodes = 3) and were using antidepressants (de-pressive-chronic: Dcgroup).
The subjects in the control group (10 healthy subjects) were matched by age with those in the depressive groups. All the exclusion criteria for the depressive groups were applied to the control group. Moreover, ex-clusion criteria for the control group also included the presence of symptoms meeting criteria for diagnosis of a mood disorder, the presence of greater than mild symp-toms on any depression scale, and the use of psycho-pharmacological drugs.
None of the patients had performed shift work or had transmeridian travel during the month preceding the study. Exclusion criteria were the use of beta-blockers or diuretics, the presence of severe psychiatric co-morbidity, and the following standard exclusion criteria for clinical trials: pregnancy, chronic clinical disorder, and alcohol or illicit drug abuse.
To avoid bias in measurements, trained interviewers assessed depressive symptoms using the following ques-tionnaires validated in Brazil: the Hamilton Depression Scale (HAM-D) [21,22], the Beck Depression Inventory (BDI) [23,24], and the Montgomery-Äsberg Scale (MADRS) [25]. The participants were blinded to the ob-jective of the study.
Instruments
Assessment of minor psychiatric disorders
Minor psychiatric disorders were assessed with the SRQ-20, adapted by Mari and Williams [2]. The presence of minor psychiatric disorders was defined by an SRQ-20 score≥7 for women. Using these cut-off values, the sen-sitivity of the method to detect minor psychiatric disor-ders is 83.5%, and the specificity is 80% [2].
Assessment of depression
The HAM-D scale includes 21 questions, with the final score ranging from 0 to 62 [21]. Patients with HAM-D scores of 11 to17 were classified as having mild depres-sion, 18 to 25 as moderate depresdepres-sion, and >25 as having a severe depressive episode [22].
The BDI is a self-report scale that can be used as a screening questionnaire to assess the cognitive, affective [23], and somatic symptoms of depression [24]. The BDI includes 21 items; each response is assigned a score ranging from 0 (no symptoms of depression) to 3 (severe symptoms of depression). The total score ranges from 0 to 63. Total scores from 0 to 9 points indicate no or minimal depressive symptoms, 10 to 16 points indicate mild depressive symptoms, 17 to 29 points indicate moderate depressive symptoms, and 30 to 63 points indicate severe depressive symptoms, as described previ-ously [24].
The MADRS scale contains 10 questions that are each scored from 0 to 6 points. The final score ranges from 0 to 60 points [25] An intra-class correlation coefficient of 0.96 was observed for the agreement between the
different evaluators. Individuals with scores <7 were classified as being without depressive symptoms.
Assessment of temperature, activity, and light rhythms
The rhythm variables were assessed by continuous actigraphy monitoring with light sensors in all patients over 7 days. The actigraph model used in this study was a TempatilumeW (Cebrasil, Inc. Brazil), which measures activity, peripheral temperature, and ambient light ex-posure. The Tempatilume is an activity monitor designed for the long term monitoring of activity in hu-man subjects. This monitor contains an accelerometer that is capable of sensing any motion with a minimal re-sultant force of 0.01 g. All communication with the actigraph is accomplished using a Tempatilume readerW (Cebrasil, Inc.) that is connected to a computer via a USB port. The epoch length was 1 minute. The software used was Tempatilume Rhythm AnalysisW (Cebrasil, Inc.). The data were converted into ASCII files that could be processed by the chronobiology program “El Temps”. The subjects wore wrist actigraphs with light sensors for 7 days.
Patients in Primary Care Unit
Screening with Self-Report Questionnaire (SRQ-20)
Psychiatric assessment
Hamilton Depression Scale (HAM-D) Beck Depression Inventory (BDI)
Montgomery and Äsberg Scale (MADRS) Healthy Control group (n=10) Clinical Interview using DSM-IV (SCID)
Positive SCID for Depression Included Depressive patients (n=20) Included HAM-D <11 BDI ≤9 MADRS ≤8 Negative Clinical Anamnesis Excluded HAM-D >11 BDI >9 MADRS >8
Positive to Minor Psychiatric Disorders SRQ ≥7
Negative SCID for mental disorder Excluded Negative to Minor Psychiatric Disorders SRQ <7 Depressive-first episode (Dfe group) (n=10) Depressive-chronic (Dc group) (n=10)
Data processing and analysis
Motor activity and peripheral temperature data were first visually inspected by double-plotted graphs. The cir-cadian rhythm was examined by the periodogram of Sokolove and Bushell [26], which provides the period of the most significant rhythm and the percentage of vari-ance (PV) explained by this rhythm. PV was used as a marker of the stability and prominence of the rhythm. Periods and PV were considered significant at a level of p < 0.05. Moreover, for each patient, data were fitted to a cosinusoidal curve of a 24-hour rhythm (cosinor ana-lysis). This analysis provided the amplitude, mesor, and acrophase of the adjusted rhythm. The mean and stand-ard errors of the daily acrophases were calculated. The stability of the daily phases of each individual circadian rhythm was calculated by the Rayleigh z test. The resulting vector angle indicated the mean peak time for each individual rhythm, and the magnitude of the vector (r) indicated the phase coherence. Therefore, the higher the r, the more coherent the phase of the rhythm was for this individual. To study the phase tendencies of each group, Rayleigh z tests were used in relation to the indi-vidual vectors, as described above, to obtain the mean vector of each group.
The mean daily profiles of the rhythm of each variable and for each patient were calculated. From these pro-files, we calculated the mean daily values of motor activ-ity, peripheral temperature, and light, as well as the diurnal and nocturnal mean values of each of the three variables. We also calculated the time that the variable was above the mean.
In addition, to study the relationship between tem-perature and activity rhythms in each subject, the activity data were transformed into percentiles for each individual (10 levels were calculated based on the maximum activity of each individual), and the temperature values corre-sponding to each activity level were determined. The rela-tionships between activity and temperature were plotted separately for day and night. This methodology has been described elsewhere [27,28].
Statistical analysis
Data are expressed as the mean ± SEM. The calculated variables were tested using one-way analysis of variance
(ANOVA). We also estimated statistic partial Eta squared to measure the effect size 0.04 a medium effect and 0.1 a large effect size, where 0.01 constitutes a small effect, 0.04 a medium effect and 0.1 a large effect. All post-hoc comparisons were Bonferroni corrected. The rhythm variables derived from the cosinor analysis, amplitude (difference between the mesor and peak), and acrophase (clock time of the peak value), were also eval-uated by discriminant analysis to estimate which vari-able (light, activity, or temperature rhythm) presented higher coefficients to discriminate patients in the Dc
group from those in the Dfe group, and the control
group from both depressive groups. For all analyses, the statistical significance was set at p < 0.05, with a two-tailed hypothesis. When only two means were compared, data were tested by independent Student’s t-tests. Data were analysed using SPSS version 16.0 (SPSS, Chicago, IL, USA).
Results
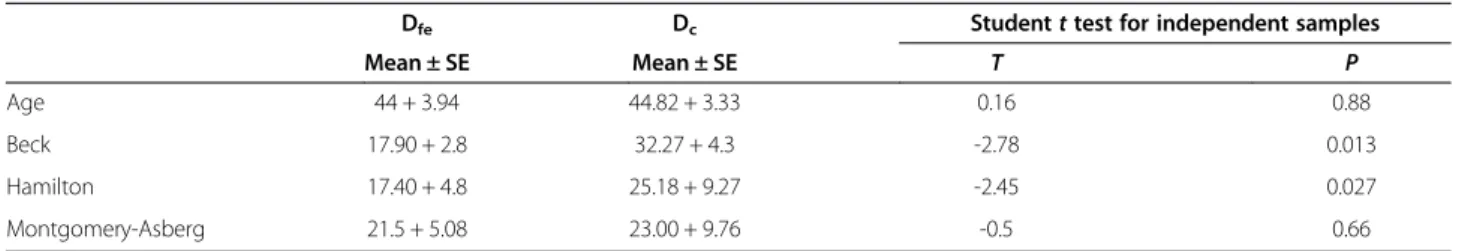
Demographic characteristics among the depressive pa-tient groups are shown in Table 1. Although the papa-tients were taking medication, the Dcgroup had higher scores
than those in the Dfegroup in the BDI and HAM-D, but
not with the MADRS instrument. Also, there was no significant age difference among groups (F (df ) = 0.17(2); P > 0.05).
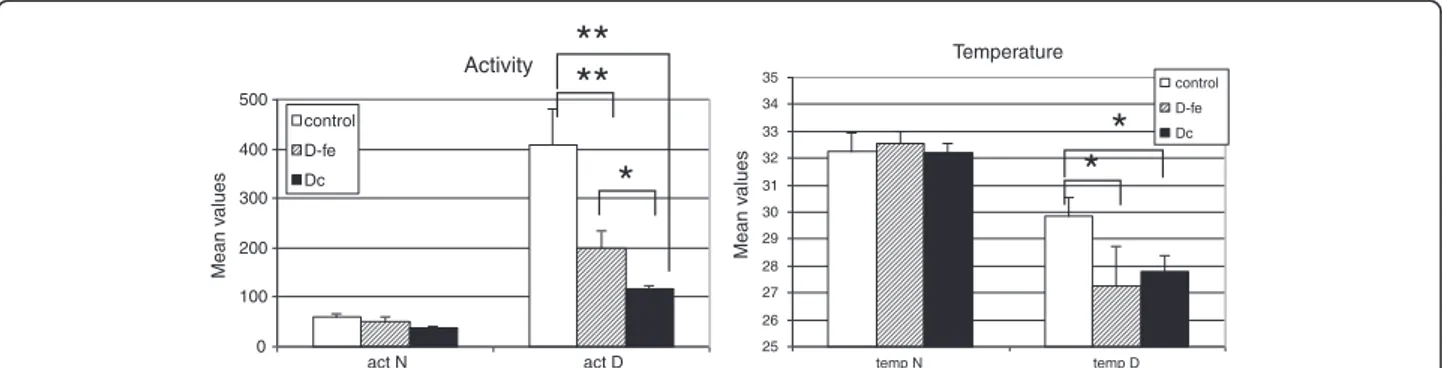
When the mean values for motor activity and tem-perature for day and night were calculated for the three groups (Figure 2), motor activity had the highest values during the day, and peripheral temperature had the highest values during the night, as expected. For motor activity and temperature, differences between the groups were found in diurnal values, but not in nocturnal values. Diurnal activity was significantly higher in the control group than in the depressive groups (ANOVA, F (df ) = 23.63(2); p < 0.001; eta-squared = 0.673). Post-hoc analysis showed that differences were greater between control and Dfe (p < 0.0001) than under control and Dc
(p < 0.01), and also that diurnal activiy was higher in Dfe
than in Dc (p < 0.05). With regard to peripheral
temperature, although diurnal values appeared signifi-cantly higher in the control group than in the depressive groups, ANOVA did not show statistically significant
Table 1 Differences in demographic characteristics between the depressive disorder groups
Dfe Dc Student t test for independent samples
Mean ± SE Mean ± SE T P
Age 44 + 3.94 44.82 + 3.33 0.16 0.88
Beck 17.90 + 2.8 32.27 + 4.3 -2.78 0.013
Hamilton 17.40 + 4.8 25.18 + 9.27 -2.45 0.027
Montgomery-Asberg 21.5 + 5.08 23.00 + 9.76 -0.5 0.66
differences, probably due to the high dispersion in the values of Dfe group; nevertheless, Student’s t test show
differences between control and Dc(Student’s t test, t =
2.346, p < 0.05).
Study of the amplitude of the rhythm, obtained by cosinor analysis (Figure 3A1, B1, C1), showed that the amplitude values for activity were significantly higher in the control group than in either of the depressive groups (ANOVA, F(df ) = 23.72(2); p < 0.001; eta-squared = 0.673). Post-hoc tests also indicate that amplitude values
for activity in the Dfegroup compared with those in the
Dcgroup were close to significance (p = 0.08). The
amp-litude of the temperature rhythm was not different between the groups. The amplitude of the light intensity was higher in control than in depressive groups (ANOVA, F(df ) = 3.729(2); p < 0.05; eta-squared = 0.245). No dif-ferences were found in light intensity in the depres-sive groups.
The PV of activity and temperature values explained by the circadian rhythm were not different between the Activity 0 100 200 300 400 500 act N act D Mean v alues control D-fe Dc Temperature 25 26 27 28 29 30 31 32 33 34 35 temp N temp D Mean v a lues control D-fe Dc
**
*
*
**
*
Figure 2 Mean levels of motor activity and peripheral temperature during the day (D) and night (N) for each group (Dfe:
depressive-first episode, Dc: depressive-chronic). **p < 0.001; *p < 0.05.
activity 0 50 100 150 200 control Dfe Dc AMPL IT U D E light 0 100 200 300 400 500 control Dfe Dc A M P L IT UDE temperature 0 1 2 3 4 5 control Dfe Dc AMPL IT U D E activity 30 32 34 36 38 40 42 control Dfe Dc PV light 0 2 4 6 8 10 control Dfe Dc PV temperature 0 2 4 6 8 10 12 14 16 18 control Dfe Dc PV A1 B1 B2 C2 C1 A2
**
*
**
*
Figure 3 Amplitude values (left) and PV explained by the 24 h rhythm obtained by the Sokolove and Bushell periodogram (right). Standard errors for the activity, peripheral temperature, and light exposure of each group (Dfe: depressive-first episode; Dc: depressive-chronic; PV:
groups (Figure 3A2, B2, C2), although in the control group, temperature tended to be slightly lower than in the depressive groups (ANOVA, F(df ) = 2.697(2); p = 0.088; eta-squared = 0.183). The PV of light intensity values was higher in the control group (ANOVA, F(df ) = 6.69(2); p < 0.01; eta-squared = 0.358) than in either of the depressive groups, indicating more stability and higher values of this variable in the controls.
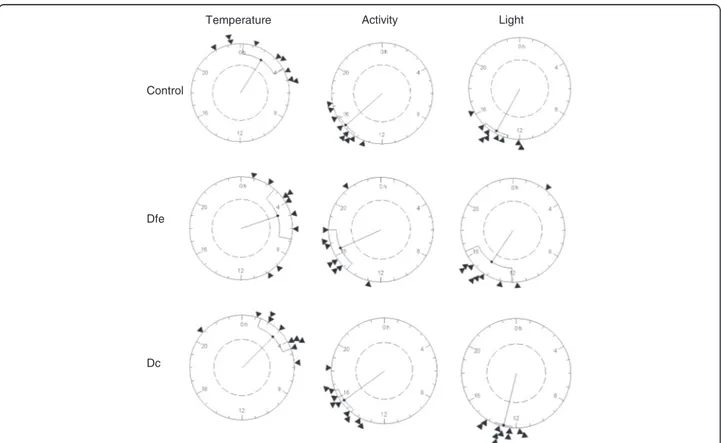
To determine if there were differences in acrophase values of the three variables among the three groups, comparison of acrophases (expressed in radians) was conducted by Rayleigh analysis (Figure 4). No differences were observed in acrophase among the groups for temperature, activity, or light. As expected, light expos-ure and activity rhythms had similar acrophase values, which were opposite to the acrophase value for periph-eral temperature.
Analysis of the daily profile indicated that the time when temperature was above the mean was shorter in the control group than in the depressive groups (mean, control: 8 h and 15 min ±26 min; Dfe: 9 h and 36 min ±
47 min; Dc: 10 h and 16 min ± 27 min), although
signifi-cant differences were only found between the control
and Dcgroups (Student’s t-test, p < 0.05). No differences
were found in the time above the mean for light and activity.
The relationships between temperature and the level of activity for each individual differed from day to night. In the day and at night, peripheral temperature de-creased as activity inde-creased (Figure 5). However, for the same level of activity, nocturnal temperatures were higher than those obtained during the day, reflecting the circadian rhythm. It is worth noting that the healthy subjects showed less contrast in temperature values be-tween day and night than did the depressive patients. There were no differences between the two groups of depressive patients (Figure 5).
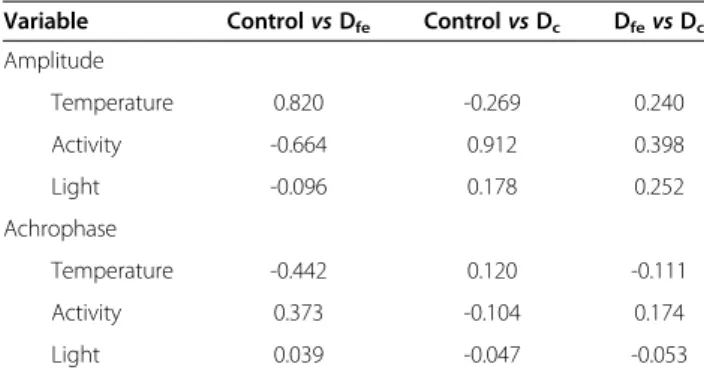
The results of the discriminate analyses are shown in Table 2. The high discriminant coefficients (> 0.3) were branched. The control group could be discriminated from the Dfe group by high coefficients of the
ampli-tudes and acrophases of temperature and activity, with the amplitude of temperature as the highest discrimin-ant parameter. The chronic depression group was differ-entiated from the control and the Dfe groups by the
activity amplitude.
Temperature Activity Light
Control
Dfe
Dc
Figure 4 Rayleigh z tests for activity, peripheral temperature, and light exposure. Each circle represents 24 hours, and each triangle indicates the position of the mean acrophase of each individual in the group. The black point of the inside vector represents the mean
acrophase, and the fiducial limits are also indicated. The size of the vector indicates the grouping of the acrophases. The internal circle indicates a significant level of p = 0.05.
Discussion
In our study, we demonstrated differences in rest-activity, peripheral temperature, and light intensity rhythms in depressive patients compared with healthy subjects. Additionally, we described the capacity of chronobiologi-cal variables to discriminate among the different stages (acute and chronic) of a depressive disorder.
With regard to the rest-activity rhythm, we observed that patients in their first depressive episode showed a decrease in amplitude compared with the control group. The amplitude was also reduced in patients with chronic depression. The differences in amplitude might have been due to the subjects’ different activity levels because these differences were reduced according to the severity
of the illness [29]. Because this variable was found to be a high coefficient for discriminating chronic depressive pa-tients, it could be an important tool in clinical practice to evaluate the stage and prognosis of major depressive disorder. The increased circadian amplitude in the rest-activity rhythm of healthy subjects could also be explained by the increased entrainment to external Zeitgebers, most likely by the maintenance of robust social and biological Zeitgebers that are essential for life [30].
In the current study, we found that the duration of time that the temperature remained above the mean was higher in the depressive groups than in the control group, suggesting that this variable is a good indicator of the time that subjects might have been in bed or had a low activity level. Activity level is decreased with the se-verity of the pathology. Several hypotheses have been proposed attempting to relate circadian differences with mood disorders [31], including the phase advance hy-pothesis, and reduced amplitudes in depressed patients. Findings from previous studies on the amplitude of the temperature rhythm in depressed patients have been in-consistent, perhaps reflecting differences in the samples of depressed patients studied due to differences in the stage or aetiology of the disorder. Therefore, an elevated nocturnal temperature has been reported by some au-thors [32,33], whereas a blunted or unchanged tempe-rature rhythm has been observed by others [34].
In our study, the amplitude of the activity rhythm was capable of discriminating healthy people from acutely depressed patients. This result might be a marker of the beginning of the disorder because the coefficient of the amplitude of activity presented as the highest discrimin-ant value (0.8). However, the amplitude of peripheral temperature was insufficient to identify differences among groups, although the PV of the temperature rhythm had a tendency to increase with the severity of the pathology, suggesting a more stable rhythm in per-ipheral temperature values of depressed patients.
Depressive (chronic) 27 28 29 30 31 32 33 34 0.00 0.10 0.20 0.30 0.40 0.50 0.60 0.70 0.80 0.90 1.00 activity (percentage) temperature Diurnal Nocturnal
Depressive (first episode)
27 28 29 30 31 32 33 34 0.00 0.20 0.40 0.60 0.80 1.00 activity (percentage) temperature Diurnal Nocturnal Control 27 28 29 30 31 32 33 34 0.00 0.20 0.40 0.60 0.80 1.00 activity (percentage) temperature Diurnal Nocturnal Diurnal Nocturnal Diurnal Nocturnal Diurnal Nocturnal
Figure 5 Mean levels of peripheral temperature (diurnal and nocturnal) expressed as a function of activity level (expressed as the percentage of the maximum activity for each group).
Table 2 Discriminate analysis of rhythm parameters (amplitude and acrophase) among the control group and
the depressive groups (Dfeand Dc)
Variable Control vs Dfe Control vs Dc Dfevs Dc Amplitude Temperature 0.820 -0.269 0.240 Activity -0.664 0.912 0.398 Light -0.096 0.178 0.252 Achrophase Temperature -0.442 0.120 -0.111 Activity 0.373 -0.104 0.174 Light 0.039 -0.047 -0.053
DfeDepressives-first episode,DcDepressives-chronic, Amplitude: difference between mesor and peak; Acrophase: clock time of the peak value.
Peripheral temperature can be influenced by activity. However, in our study, we observed that there were differ-ences between day and night for temperature values for the same relative level of activity. This observation sug-gests that peripheral temperature followed a real endogen-ous rhythm independent of activity. Healthy subjects demonstrated fewer differences between temperature values during the day and night, which is consistent with lower amplitude values in this variable. This suggested that high activity in healthy people might have masked the temperature rhythm. However, this suggestion is not com-pletely valid, because for all levels of activity, the differ-ences between nocturnal and diurnal values were lowest in the control group (Figure 5).
The peripheral temperature rhythm is partly the result of alternate balances between parasympathetic (vasodila-tation) and sympathetic (vasoconstriction) actions in the peripheral skin vessels, which are driven by the SCN [35,36]. Therefore, the lower levels of peripheral tem-perature during the day in depressed patients could be attributable to higher activity of the sympathetic system. This relationship supports the idea that, in depres-sion, there might be an imbalance in the autonomic system, which could be due to abnormalities in circadian system regulation [37].
Additionally, the results of intrinsic biological rhythms must be interpreted by examining the external rhythms induced by light exposure. The fit of the amplitude of light was highest in the control, indicating that these subjects were exposed to higher levels of light intensity. The ampli-tude and stability of the light rhythms were lower in the depressive groups than in the control group, which indi-cated that light may have had less influence on endogen-ous rhythms in depressed patients than in controls. Our results demonstrated that although the amplitude of light intensity was not different among the groups, the PV of light intensity values was higher in the control group than in the depressive groups, indicating more stability of this variable in the control group. Some studies have demon-strated a relationship between light intensity and seasonal depression [38,39]. One hypothesis that may help explain abnormalities in the regulation of circadian rhythms has suggested that changes in the length of the endogenous period leads to changes in the phase angle of light syn-chronisation [40]. Therefore, the intensity and period when the subject is exposed are important, as well as the phase and the spectrum.
The simultaneous assessment of light, activity, and temperature rhythms in the current study was essential because all three variables provided information on the functioning of the circadian pacemaker, as well as possible masking due to light exposure, and its effects on the pace-maker. Discriminant analysis provided important informa-tion about the capability of chronobiotic parameters to be
considered as a tool for the diagnosis and prognosis of de-pression. The next step in future research is to perform a prospective study to evaluate the sensitivity, specificity, and predictive value of these parameters .
One alternative explanation for our findings related to the changes in chronobiological parameters may be re-lated to the antidepressant treatment used in the chronic-ally depressed patients. One study using an agonist at MT (1)/MT(2) melatonin receptors and an antagonist at 5-HT (2C) serotonin receptors showed a significant difference in the relative amplitude of the circadian rest-activity cycle [41]. Additionally, antidepressant treatments, including tricyclic medications, increase the circadian amplitude of temperature [42]. In our study, the effect of medication could not be clearly considered. Notably, the Dc patients
were chronic patients who had received medication. How-ever, in spite of their treatment, they scored higher on the depressive scales than did the Dfepatients. Therefore, we
conclude that, in the current study, alterations in circadian rhythms were due to severity of the pathology and not ne-cessarily to the medication itself.
Limitations due to the design of the study are as follows: (i) this was a cross-sectional study, and therefore, we could not establish a direct cause-consequence relationship; (ii) depressive subjects with more intense symptoms were under treatment; therefore, we could not affirm that the changes in rhythm were due only to the effect of the se-verity of the symptoms; and (iii) in this study, we assessed the intensity but not the quality of the light.
Finally, this study raises some hypotheses to be tested in longitudinal studies. First, it suggests that in subjects with diseases, there is a shift in circadian rhythm to adapt and maintain the energy needed for survival. Sec-ond, the results in this study underscore the theory that the lack of synchronisation between rhythms can be decoded by physiological systems as a stressor. This chronodisruption is capable of starting, accelerating, per-petuating, and exacerbating neuropsychiatric symptoms because the rhythms are integrated into basic cellular endocrine rhythms that build rhythmic, structural, and functional networks.
Conclusions
In conclusion, we show that the amplitude and stability of circadian rhythms are influenced by depressive states. This result correlates with the severity of the clinical manifestation of depression may be an important tool to be used in clinical set.
Abbreviations
BDI: Beck Depression Inventory; 5-HT(2C): 5-hydroxytryptamine (serotonin) receptor 2C; HAM-D: Hamilton Depression Scale; HCPA: Hospital de Clínicas de Porto Alegre; MT: Melatonin Receptor; MADRS: Montgomery-Äsberg Scale; PV: Percentage of variance; SRQ-20: Self-Report Questionnaire;
SCN: Suprachiasmatic nucleus; Dfe: Depressive-first episode group; Dc: Depressive-chronic group.
Competing interests
The authors declare that they have no competing interests.
Authors’ contributions
TC, ADN, RL and MPLH designed the study, wrote the protocol, and managed the literature searches and analyses. TC and MPLH wrote the first draft of the manuscript. CM, RS, GD, data collection and literature revision and RL, TC, MPLH make the final revision of the manuscript. All authors contributed to and have approved the final manuscript.
Acknowledgements
MPH received financial support from CNPq (Conselho Nacional de Desenvolvimento Científico e Tecnológico) and FAPERGS (Fundação de Amparo à Pesquisa do Estado do Rio Grande do Sul). GD and RL received financial support from PNPD/CAPES (Coordenação de Aperfeiçoamento de Pessoal de Nível Superior) - Brazil. TC and ADN received financial support from the Ministerio de Educación y Ciencia (Spain) (project: BFU2008-00199). Author details
1
Laboratório de Cronobiologia do Hospital de Clínicas de Porto Alegre (HCPA), da Universidade Federal do Rio Grande do Sul (UFRGS), Ramiro Barcelos, 2350 sala 12107, Porto Alegre, RS 90035-003, Brazil.2Departament de Fisiologia, Facultat de Farmàcia, Universitat de Barcelona, Avinguda de Joan XXIIIs/n, Barcelona 08028, Spain.3Programa de Pós-Graduação em Ciências Médicas: Psiquiatria, UFRGS, Porto Alegre, Brazil.4Departamento de Psiquiatria e Medicina Legal da Faculdade de Medicina, da Universidade Federal do Rio Grande do Sul, Porto Alegre, Brazil.
Received: 29 October 2012 Accepted: 5 March 2013 Published: 9 March 2013
References
1. Patten SB: An animated depiction of major depression epidemiology. BMC Psychiatr 2007, 7:23.
2. Mari JJ, Williams P: A validity study of a psychiatric screening questionnaire (SRQ-20) in primary care in the city of Sao Paulo. Br J Psychiatry 1986, 148:23–26.
3. Lin LC, Lewis DA, Sibille E: A human-mouse conserved sex bias in amygdala gene expression related to circadian clock and energy metabolism. Mol Brain 2011, 4:18.
4. McCarthy MJ, Welsh DK: Cellular circadian clocks in mood disorders. J Biol Rhythms 2012, 27:339–352.
5. Ecker JL, Dumitrescu ON, Wong KY, Alam NM, Chen SK, LeGates T, Renna JM, Prusky GT, Berson DM, Hattar S: Melanopsin-expressing retinal ganglion-cell photoreceptors: cellular diversity and role in pattern vision. Neuron 2010, 67:49–60.
6. Soria V, Urretavizcaya M: Circadian rhythms and depression. Actas Esp Psiquiatr 2009, 37:222–232.
7. Lewy AJ, Sack RL, Miller LS, Hoban TM: Antidepressant and circadian phase-shifting effects of light. Science 1987, 235:352–354.
8. Reeves GM, Nijjar GV, Langenberg P, Johnson MA, Khabazghazvini B, Sleemi A, Vaswani D, Lapidus M, Manalai P, Tariq M, Acharya M, Cabassa J, Snitker S, Postolache TT: Improvement in depression scores after 1 hour of light therapy treatment in patients with seasonal affective disorder. J Nerv Ment Dis 2012, 200:51–55.
9. Even C, Schröder CM, Friedman S, Rouillon F: Efficacy of light therapy in nonseasonal depression: a systematic review. J Affect Disord 2008, 108:11–23.
10. Wirz-Justice A: Diurnal variation of depressive symptoms. Dialogues Clin Neurosci 2008, 10:337–343.
11. Kripke DF, Mullaney DJ, Atkinson M, Wolf S: Circadian rhythm disorders in manic-depressives. Biol Psychiatry 1978, 13:335–351.
12. Wehr TA, Wirz-Justice A, Goodwin FK, Duncan W, Gillin JC: Phase advance of the circadian sleep-wake cycle as an antidepressant. Science 1979, 206:710–713.
13. Parker G, Brotchie H: Psychomotor change as a feature of depressive disorders: an historical overview. Aust N Z J Psychiatr 1992, 26:146–155. 14. Burton C, McKinstry B, Szentagotai Tătar A, Serrano-Blanco A, Pagliari C,
Wolters M: Activity monitoring in patients with depression: A systematic review. J Affect Disord 2013, 15:21–8.
15. Tsuchiyama Y, Uchimura N, Sakamoto T, Maeda H, Kotorii T: Effects of hCRH on sleep and body temperature rhythms. Psychiatr Clin Neurosci 1995, 49:299–304. 16. Aschoff J: Circadian Rhythms in man. Science 1965, 148:1427–1432. 17. Souêtre E, Salvati E, Wehr TA, Sack DA, Krebs B, Darcourt G:
Twenty-four-hour profiles of body temperature and plasma TSH in bipolar patients during depression and during remission and in normal control subjects. Am J Psychiatry 1988, 145:1133–1137.
18. Hiddinga AE, Beersma DG, Van den Hoofdakker RH: Endogenous and exogenous components in the circadian variation of core body temperature in humans. J Sleep Res 1997, 6:156–163.
19. Erren TC, Reiter RJ: Defining chronodisruption. J Pineal Res 2009, 46:245–247. 20. Portaluppi F, Smolensky MH, Touitou Y: Ethics and methods for biological
rhythm research on animals and human beings. Chronobiol Int 2010, 27:1911–1929.
21. Hamilton M: A rating scale for depression. J Neurol Neurosurg Psychiatry 1960, 23:56–62.
22. Paykel ES: Use of the Hamilton Depression Scale in general practice. Psychopharmacol Ser 1990, 9:40–47.
23. Beck AT, Steer RA, Ball R, Ranieri W: Comparison of Beck Depression Inventories -IA and -II in psychiatric outpatients. J Pers Assess 1996, 67:588–597.
24. Lasa L, Ayuso-Mateos JL, Vázquez-Barquero JL, Díez-Manrique FJ, Dowrick CF: The use of the Beck Depression Inventory to screen for depression in the general population: a preliminary analysis. J Affect Disord 2000, 57:261–265. 25. Dratcu L, Ribeiro LC, Calil HM: Depression assessment in Brazil. Br J
Psychiatry 1987, 150:797–800.
26. Sokolove PG, Bushell WN: The chi square periodogram: its utility for analysis of circadian rhythms. J Theor Biol 1978, 72:131–160.
27. Refinetti R: Relationship between the daily rhythms of locomotor activity and body temperature in eight mammalian species. Am J Physiol 1999, 277:1493–1500.
28. Cambras T, Weller JR, Anglès-Pujoràs M, Lee ML, Christopher A, Díez-Noguera A, Krueger JM, de la Iglesia HO: Circadian desynchronization of core body temperature and sleep stages in the rat. Proc Natl Acad Sci USA 2007, 104:7634–7639.
29. Long AC, Palermo TM, Manees AM: Brief report: using actigraphy to compare physical activity levels in adolescents with chronic pain and healthy adolescents. J Pediatr Psychol 2008, 33:660–665.
30. Aschoff J, Pohl H: Phase relations between a circadian rhythm and its zeitgeber within the range of entrainment. Naturwissenschaften 1978, 65:80–84. 31. Martinez-Nicolas A, Ortiz-Tudela E, Madrid JA, Rol MA: Crosstalk between
environmental light and internal time in humans. Chronobiol Int 2011, 28:617–629.
32. Szuba MP, Guze BH, Baxter LR Jr: Electroconvulsive therapy increases circadian amplitude and lowers core body temperature in depressed subjects. Biol Psychiatry 1997, 42:1130–1137.
33. Schwartz PJ, Rosenthal NE, Turner EH, Drake CL, Liberty V, Wehr TA: Seasonal variation in core temperature regulation during sleep in patients with winter seasonal affective disorder. Biol Psychiatry 1997, 42:122–131. 34. Buysse DJ, Monk TH, Kupfer DJ, Frank E, Stapf D: Circadian patterns of
unintended sleep episodes during a constant routine in remitted depressed patients. J Psychiatr Res 1995, 29:407–416.
35. Kräuchi K: The thermophysiological cascade leading to sleep initiation in relation to phase of entrainment. Sleep Med Rev 2007, 11:439–451. 36. Lack LC, Gradisar M, Van Someren EJ, Wright HR, Lushington K: The
relationship between insomnia and body temperatures. Sleep Med Rev 2008, 12:307–317.
37. Kalsbeek A, Scheer FA, Perreau-Lenz S, La Fleur SE, Yi CX, Fliers E, Buijs RM: Circadian disruption and SCN control of energy metabolism. FEBS Lett 2011, 585:1412–1426.
38. Rosenthal NE, Sack DA, Gillin JC, Lewy AJ, Goodwin FK, Davenport Y, Mueller PS, Newsome DA, Wehr TA: Seasonal affective disorder. A description of the syndrome and preliminary findings with light therapy. Arch Gen Psychiatry 1984, 41:72–80.
39. Wirz-Justice A, Bader A, Frisch U, Stieglitz RD, Alder J, Bitzer J, Hösli I, Jazbec S, Benedetti F, Terman M, Wisner KL, Riecher-Rössler A: A randomized, double-blind, placebo-controlled study of light therapy for antepartum depression. J Clin Psychiatry 2011, 72:986–993.
40. Martin-Tryon EL, Harmer SL: XAP5 CIRCADIAN TIMEKEEPER coordinates light signals for proper timing of photomorphogenesis and the circadian clock in Arabidopsis. Plant Cell 2008, 20:1244–1259.
41. Kasper S, Hajak G, Wulff K, Hoogendijk WJ, Montejo AL, Smeraldi E, Rybakowski JK, Quera-Salva MA, Wirz-Justice AM, Picarel-Blanchot F, Baylé FJ: Efficacy of the novel antidepressant agomelatine on the circadian rest-activity cycle and depressive and anxiety symptoms in patients with major depressive disorder: a randomized, double-blind comparison with sertraline. J Clin Psychiatr 2010, 71:109–120.
42. Goetze U, Tölle R: Circadian rhythm of free urinary cortisol, temperature and heart rate in endogenous depressives and under antidepressant therapy. Neuropsychobiology 1987, 18:175–184.
doi:10.1186/1471-244X-13-77
Cite this article as: Moraes et al.: A new chronobiological approach to discriminate between acute and chronic depression using peripheral temperature, rest-activity, and light exposure parameters. BMC Psychiatry 2013 13:77.
Submit your next manuscript to BioMed Central and take full advantage of:
• Convenient online submission
• Thorough peer review
• No space constraints or color figure charges
• Immediate publication on acceptance
• Inclusion in PubMed, CAS, Scopus and Google Scholar
• Research which is freely available for redistribution
Submit your manuscript at www.biomedcentral.com/submit