A eutectic salt high temperature phase change material: Thermal
1stability and corrosion of SS316 with respect to thermal cycling
2Ming Liua,*, Stuart Bellb, Mercè Segarrac, N.H. Steven Taya,d, Geoffrey Willb, Wasim Samana, Frank
3
Brunoa
4
a Barbara Hardy Institute, School of Engineering, University of South Australia, Mawson Lakes
5
Boulevard, Mawson Lakes, SA5095 Australia. 6
b Energy and Process Engineering, Chemistry, Physics, Mechanical Engineering, Science and
7
Engineering Faculty, Queensland University of Technology, Brisbane 4001, QLD Australia. 8
c DIOPMA, Dept. Materials Science and Physical Chemistry, Universitat de Barcelona, Marti i
9
Franques,1, 08028 Barcelona, Spain. 10
d Newcastle University Singapore, 172A Ang Mo Kio Avenue 8, #05-01, SIT Building@Nanyang
11
Polytechnic, Singapore 567739, Singapore. 12
13
Abstract 14
Thermal energy storage (TES) is a critical component in a concentrated solar power (CSP) plant 15
since it is able to provide dispatchability and increase the capacity factor of the plant. Recently 16
the Brayton power cycle using supercritical carbon dioxide (s-CO2) has attracted considerable 17
attention as it allows a higher thermal to electric power conversion efficiency compared to 18
the conventional Rankine cycle using subcritical steam. However, no commercial TES has yet 19
been developed for integration with a s-CO2 based plant. One reason is the lack of a suitable 20
storage material. This work explores the use of a eutectic NaCl-Na2CO3 salt as a reliable high 21
temperature phase change material (PCM). The PCM has been thermally cycled up to 1000 22
times. Its thermo-physical properties have been measured before and after it has been 23
subjected to the thermal cycling and its corrosion behavior has been investigated. This 24
eutectic salt shows good thermal stability without degradation after cycling 1000 times 25
between 600 and 650 ᵒC. The corrosion rate on stainless steel 316 (SS316) increases linearly 26
up to 350 cycles, and thereafter it stabilizes at 70 mg/cm2. 27
28
Key words: phase change material; thermal storage; thermal stability; dynamic gravimetric 29
analysis; corrosion; containment material. 30
1. Introduction 31
Concentrated solar power (CSP) technology converts the sunlight to heat by using mirrors or 32
lenses and a receiver, and the heat generated is used to produce electricity or process heat 33
for industrial use. The integration of thermal energy storage (TES) solves the time mismatch 34
between the solar energy supply and electricity/heat demand and also reduces the levelized 35
cost of CSP-generated electricity. Sensible TES in a two-tank molten salt system has been 36
deployed in commercial CSP plants. Latent TES using phase change material (PCM) is 37
believed to be a cost effective alternative as it offers higher energy storage density and 38
isothermal behavior during the phase transformation. It has been extensively investigated 39
over the last few years and is currently experiencing the transition from research to 40
industrial application via pilot-scale demonstration. 41
42
Due to the high temperature requirements for CSP systems, inorganic salts/salt eutectics 43
and metals/metal alloys with melting points over 300 ᵒC are being considered as promising 44
PCM candidates and have been reviewed [1-4]. In order to build efficient and reliable PCM-45
TES systems, the appropriate PCMs should possess suitable phase change temperature, high 46
latent heat of fusion, good thermal and chemical stability and acceptable corrosion on the 47
containment material at high temperatures and after repeated thermal cycles. It is also 48
critical to experimentally verify the thermo-physical properties of the PCM as calculated 49
values, sometimes used in the literature show significant discrepancy [5, 6]. In addition, 50
limited information exists on the stability and corrosion issues of high temperature PCMs 51
under thermal cycling. 52
53
Corrosion mechanisms in molten salt are complex and highly dependent upon impurities, 54
temperature, alloying elements and oxidant availability. Corrosion in molten salts generally 55
proceeds in five steps: (1) oxidant dissolving into melt, (2) oxidant transport in melt, (3) 56
corrosion reactions at salt/metal surface, (4) oxide scale dissolution into melt, and (5) 57
preferential dissolution of soluble products [7].The majority of high temperature corrosion 58
tests have focused on steel in the presence of molten nitrate salt and the effect of 59
impurities under isothermal conditions [8-10]. 60
61
Sodium nitrate (NaNO3) has been found to be a suitable PCM for direct steam generation 62
and detailed analysis of fundamental material aspects has been carried out in [11-13]. No 63
degradation was detected after 172 thermal cycles [12]. A 1 MWh pilot-scale TES system 64
combining sensible and latent thermal storage with 14 tons of NaNO3 was installed and will 65
be tested in Spain under real steam conditions [14]. Possible degradation of nitrate will lead 66
to increasing concentration of nitrite and it will decrease the storage material’s melting 67
temperature and latent heat of fusion [15]. BaCO3-47.8Na2CO3 (wt. %) has shown good 68
thermal stability after 36 cycles [16]. After evaluating six eutectic salts by thermal cycling up 69
to 100 cycles, Li2CO3–35K2CO3–33Na2CO3 (wt. %) and MgCl2–48NaCl (wt. %) were identified 70
as promising high temperature PCMs [6]. Al-34%Mg-6%Zn (wt.%) alloy has a good thermal 71
reliability after 1000 thermal cycles and SS304L can be considered as a containment 72
material [17]. An X-750 alloy container was dissolved by molten aluminum under repeated 73
thermal cycles in a vacuum condition [18]. 74
75
A eutectic salt composed of NaCl-Na2CO3 was explored as a high temperature PCM by Jiang 76
et al. [19]. The PCM showed no decomposition under CO2 atmosphere and little 77
decomposition (0.15% weight loss) under N2 atmosphere up to 700 ᵒC. Also, it showed good 78
thermal properties and stability after 100 thermal cycles. This preliminary test proved its 79
potential as a PCM. However, the corrosion issues of this PCM have not been investigated. 80
Previous research on corrosion of molten chloride salt showed that lower nobility transition 81
metals such as chromium and iron tend to be more susceptible to corrosion and dissolution 82
than higher nobility metals such as nickel [20]. Passive oxide scale on the surface of a metal 83
in a chloride salt has been found to slow ion dissolution from the metal, and its stability can 84
be improved by the introduction of carbonate ions [21]. However, the formation of passive 85
oxide films is difficult and depends upon specific conditions which may not be easily 86
maintained, causing the oxide to be removed by fluxing [22]. 87
88
This paper presents work on the long-term thermal stability of eutectic NaCl-Na2CO3 by 89
measuring the thermo-physical properties of the PCM after repeated thermal cycles of 90
heating/cooling up to 1000 times. The corrosion behavior of a common containment 91
material (SS316) in the presence of eutectic NaCl-Na2CO3 salt with respect to thermal cycling 92
was also explored. The mass-loss corrosion rate of steel coupons with increasing number of 93
cycles was determined by the dynamic gravimetric analysis. The microstructure of the 94
corrosion product was evaluated by examining the cross sections of the metal coupons. 95
2. Experimental Methods 96
2.1 Sample preparation 97
The sodium chloride (NaCl) and sodium carbonate (Na2CO3) were supplied by ACE Chemicals 98
(Australia). They were technical grade with a purity of min. 99.4% and min. 99.2%, 99
respectively. The major impurities in NaCl are magnesium (mix. 0.05 %), calcium (mix. 0.1 %) 100
and sulphate (max. 0.25 %). The major impurities in Na2CO3 are NaCl (max. 0.5 %), Fe2O3 101
(max. 0.005 %), CaO (max. 0.007 %) and MgO (max. 0.006 %). The salts were not further 102
purified since the process is complicated and will increase the cost for industrial 103
applications. The single salts were placed in a furnace at 120 ᵒC for 24 hours to exclude 104
moisture. The PCM was prepared by mixing NaCl and Na2CO3 in the weight proportion of 105
40.55 and 59.45 and the mixture was melted at 650 ᵒC in a porcelain crucible and 106
maintained for 2 hours at atmospheric pressure in air. Afterwards, the salt was pulverized to 107
powder using a pestle and mortar and stored in sealed containers. 108
109
Ten SS316 coupons with dimensions of approx. 20mm×10mm×1.5mm were cut from a sheet 110
of stainless steel. The nominal composition of the SS316 is presented in Table 1. The 111
maximum service temperatures of SS316, which is the highest temperature at which it can 112
be used for an extended period without significant problems (e.g. oxidation and decrease of 113
mechanical properties), are 870 ᵒC and 925 ᵒC for intermittent and continuous service in air, 114
respectively [23]. The coupons were progressively polished using SiC abrasive papers of 400, 115
800 and 1200 grit, cleaned with acetone in an ultrasonic bath, further cleaned in deionized 116
water and weighed. All the coupons’ weights and dimensions were recorded. 117
118
Table 1. Nominal elemental composition of stainless steel 316.
119
Element C Cr Mo Ni Si (max.) Mn (max.) P (max.) S (max.) Fe wt. % 0.07 17-18.5 2-2.5 10.5-13.5 1.0 2.0 0.045 0.030 Balance 120
2.2 Thermal cycling test 121
The PCM samples (each approx. 50 g) were placed into alumina crucibles as this material has 122
shown corrosion resistance to the investigated salt system. The SS coupons were inserted 123
into and fully submerged in PCM samples. Type K omegaTM thermocouples with an accuracy 124
of ±0.75%, were used. They were covered with alumina sheaths to protect the 125
thermocouple from the corrosion. The sheathed thermocouples were inserted into one PCM 126
sample to record the sample temperature. Then, all the samples were covered by lids and 127
placed in a furnace. The temperature of the furnace was programed to cycle between 128
600 ᵒC and 650 ᵒC, including a heating process to 650 ᵒC with a heating rate of 10 K/min, an 129
isothermal process at 650 ᵒC for 2 hrs, a cooling process to 600 ᵒC with natural cooling of 130
furnace and an isothermal process at 600 ᵒC for 2 hrs. The temperatures inside the PCM 131
sample and the furnace were recorded every 10 seconds by using a data acquisition system. 132
133
One crucible with salt only as the sample was removed from the furnace after 200, 500, 650 134
and 1000 thermal cycles for thermo-physical property characterization, respectively. Two 135
crucibles with salt and SS coupons were removed from the furnace after 50, 100, 150, 350 136
and 500 cycles, respectively. One coupon was prepared for dynamic gravimetric analysis to 137
determine the corrosion rate and the other for microstructural analysis. The SS coupons 138
were preliminarily cleaned by washing off the salt using warm water and followed by 139
deionized water. 140
141
2.3 PCM characterization (differential scanning calorimetry) 142
A high temperature differential scanning calorimeter (DSC 404 F1 Pegasus®, Netzsch) was 143
used to measure the phase change temperature and phase change enthalpy of the fresh 144
and cycled PCM samples. The samples were pulverized to powder after removal from the 145
furnace and dried in a furnace at 120 ᵒC for 2 hours before the measurement. Six specimens 146
(15±1 mg each) were taken from each sample and the average values were obtained. The 147
eutectic NaCl-Na2CO3 was shown to decompose at temperatures beyond 638 ᵒC under air 148
atmosphere [24]. Therefore, the specimen was obtained from at least 10 mm below the top 149
surface. In the real storage tank, a CO2 atmosphere should be applied, under which the salt 150
remains stable to 700 ᵒC [19]. The specimen was loaded into the 85 μl Pt/Rh crucible with an 151
alumina liner and it was subject to two heating and cooling cycles with a heating/cooling 152
rate of 10 K/min in nitrogen atmosphere. 153
154
The software Proteus® from Netzsch was used to evaluate the heat flux signals. The baseline 155
onset temperature during heating and cooling was regarded as the melting and 156
solidification temperature, respectively. The phase change enthalpy was estimated by the 157
integration of the heat flux under phase transformation. 158
159 160
2.4 Containment material characterization 161
2.4.1 Dynamic Gravimetric Analysis (DGA) 162
The effect of corrosion was determined by measuring the amount of corrosion products 163
formed on the surface of the SS316 sample, by using the dynamic gravimetric analysis (DGA) 164
[8]. The traditional methods proposed by the ASTM Standard G1-03 [25] requires intensive 165
sample manipulation, while the DGA technique reduces human handling when determining 166
the corrosion rate, and improves the accuracy of results. 167
168
Initially, the residual salts adhered to the SS surface were removed by submerging the SS 169
coupons into 10 % v/v sulphuric acid solution for 15 mins. Sulphuric acid at low 170
concentrations also makes the oxide layer become less compact and thus facilitates the 171
oxide descaling process without removing the corrosion layer itself. Following this 172
procedure [8], the coupon was then hung from an analytical balance (Ohaus Explorer) with 173
an accuracy of ± 0.1 mg and submerged in the cleaning solution, allowing the dissolution of 174
the formed scales. The balance was connected to a computer (software RealTerm: Serial 175
Capture Programme 2.0.0.43) which recorded the weight of the coupon every second, 176
providing a real-time weight loss of the descaling process. 177
178
The cleaning solution used in this work was defined in the ASTM Standard G1-03 and it 179
consists of 100ml 69% v/v HN03, 20 ml 48% v/v HF and distilled water up to 1L [25]. Each 180
studied SS coupon was immersed in the solution for 50 minutes following the DGA 181
procedure. This duration was experimentally determined to ensure that the oxide layer was 182
completely removed. Finally, the samples were cleaned with distilled water, dried with 183
absorbent paper, and weighed. 184
From the data captured by the software, a curve of weight loss versus time can be depicted. 185
This curve depends on the amount of oxide formed on the surface of the SS coupon, and 186
therefore, it can be related to the corrosion resistance. From the curve, the thickness xM of
187
corroded steel can be calculated by Eq. (1) 188
𝑥𝑀 =
𝑤𝑖𝑎𝑖𝑟−[𝑤𝑓𝑎𝑖𝑟+ (𝑤𝑜𝑥𝑐𝑠− 𝑤𝑓𝑐𝑠)×𝐵]
𝑆 𝜌𝑀 (1)
189
where 𝑤𝑖𝑎𝑖𝑟 and 𝑤𝑓𝑎𝑖𝑟 are the initial and final weights of the SS coupon in air before and 190
after the DGA test, 𝑤𝑜𝑥𝑐𝑠 is the weight of the SS coupon inside the cleaning solution when all 191
the oxide layer has been removed (the point on the graph in which the slope changes [8]), 192
𝑤𝑓𝑐𝑠 is the final weight of the SS coupon inside the cleaning solution, S is the surface area, 193
and ρM is the density of the steel (7.85 g/cm3). B is the experimental buoyancy of cleaning 194
solution, which can be determined by the ratio of weight loss in air (∆𝑤𝑎𝑖𝑟) and weight loss 195
inside the cleaning solution (∆𝑤𝑐𝑠) as shown in Eq. (2). 196
𝐵 =∆𝑤∆𝑤𝑎𝑖𝑟𝑐𝑠 =𝑤𝑓𝑎𝑖𝑟−𝑤𝑖𝑎𝑖𝑟
𝑤𝑓𝑐𝑠−𝑤𝑖𝑐𝑠 (2)
197
where 𝑤𝑖𝑐𝑠 is the initial weight of the SS coupon inside the cleaning solution before the DGA 198
test. 199
Although the plates were cut as precisely as possible, they were not identical in weight and 200
surface area. Thus for comparative purposes, the weight loss per unit area, 𝑤𝑙𝑜𝑠𝑠 (mg/cm2), 201
is calculated by multiplying the thickness of corroded steel (xM) by its density (ρM). 202
On the other hand, the thickness of the oxide layer (xoxide) can also be calculated from the 203
thickness of corroded steel, taking into account the stoichiometry of the iron oxide (for 204
example, FexOy), its molecular weight (Moxide), and its density (ρoxide), by Eq. (3). 205
𝑥𝑜𝑥𝑖𝑑𝑒 = 𝑛𝑥𝑀 𝜌𝑀 𝑀𝑜𝑥𝑖𝑑𝑒
𝐹𝑒 𝜌𝑜𝑥𝑖𝑑𝑒 𝐴𝐹𝑒 (3)
206
nFe being the number of iron atoms per mole of oxide, and AFe the atomic weight of iron. 207
208
2.4.2 Microstructural characterization 209
Microstructural characterization was undertaken using a Zeiss Sigma Field Emission 210
Scanning Electron Microscope (SEM) and an Oxford XMax 50 Silicon Drift (SDD) EDS detector 211
provided Energy Dispersive X-ray Spectroscopy (EDS) mapping. Samples were cross 212
sectioned, mounted in resin and polished via the following procedure: 213
1. SiC Foil 320 grit, with water lubricant for 1 minute at 30N per sample.
214
2. MD Largo, with DiaPro Allegro/Largo lubricant/suspension for 3 minutes at 20N per
215
sample. 216
3. MD Mol, with DiaPro Mol B3 lubricant/suspension for 3 minutes at 20N per sample.
217
4. MD Nap, with DiaPro Nap B1 lubricant/suspension for 2 minutes at 20N per sample.
218
5. MD Chem with OP-U colloidal silica lubricant/suspension for 1 minute at 10N per
219
sample. 220
Both surface and cross-section areas were examined. 221
222
3. Results and discussion 223
3.1 Thermal stability of PCM 224
The onset melting and solidification temperatures and phase change enthalpy was 225
evaluated for six specimens for each fresh and cycled PCM sample. The results obtained 226
from the second freezing process were not included as a result of the salt creeping after two 227
melting processes. The experimental difficulty with molten salt creeping has been reported 228
previously [6, 13, 26]. A thin film of molten salt forms on the surface, which will wet the 229
crucible material and creep up the crucible wall and even out of the crucible. The maximum 230
and minimum values for each specimen were excluded from the calculation and the average 231
value and its standard deviation was calculated based on the remaining four values. The 232
average phase change temperature, sub-cooling and enthalpy during melting and 233
solidification, together with their standard deviations, at various numbers of thermal cycles 234
are listed in Table 2. The low standard deviation confirms that the four value points are 235
close to the average value and the error (σ, standard deviation divided by average value) for 236
all the measurement is below 3.64 %, which is within the measurement error of the DSC. 237
Table 2. Phase change temperature and enthalpy of PCM samples measured by DSC.
238
Cycle no.
1st Melting Process 1st Solidification Process 2nd Melting Process Sub-cooling
(K)
Storage efficiency
(%) Tonset (ᵒC) ΔHm(J/g) Tonset (ᵒC) ΔHm(J/g) Tonset (ᵒC) ΔHm(J/g)
Fresh 642.6±0.7 322.8±3.9 633.6±0.2 308.8±1.1 635.0±0.7 311.6±1.0 1.4 99.1 200 642.1±3.7 323.4±4.1 631.9±0.6 305.4±1.1 634.9±1.4 313.6±4.6 3.0 97.4 500 636.2±1.1 324.4±3.9 632.0±0.1 310.7±4.8 632.6±0.3 313.3±3.4 0.6 99.2 650 638.1±3.2 320.3±11.7 631.9±0.7 305.7±2.4 633.9±1.4 311.1±2.1 2.0 98.3 1000 639.5±3.5 319.4±8.8 632.2±0.5 304.6±6.5 634.1±1.1 310.2±3.7 1.9 98.2 σ 0.58 % 3.64 % 0.10 % 1.53 % 0.22 % 1.48 %
Tonset: onset temperature; ΔHm: phase change enthalpy. 239
Generally, the melting temperature, phase change enthalpy and their variations amongst 240
specimens in the first melting process were higher than those in the succeeding 241
solidification and the melting processes. The difference is between 3.7 ᵒC and 7.7 ᵒC for 242
melting temperature and between 9.2 J/g and 11.2 J/g for the phase change enthalpy, 243
respectively. A similar trend was observed by Shukla et al. [27] and Liu and Chung [28]. This 244
discrepancy is likely due to the high thermal contact resistance between the salt and the 245
crucible pan in the initial melt. The contact is improved in the second melt as space is 246
eliminated between the salt and pan due to the initial melt. The phase change temperature 247
during the second melting process was regarded as the melting temperature of the sample 248
as discussed below. 249
The melting temperature and the phase change enthalpy measured in this work along with 250
their theoretical values calculated using FactSage 6.4 and the data reported in previous 251
literature are listed in Table 3. It shows that the differences of melting temperature 252
between the theoretical and measured values are small, the maximum difference being 5 K 253
(0.8 %). The phase change enthalpy measured in this work and another study [19] is 16.73 254
J/g (5.7 %) higher and 11.6 J/g (3.9 %) lower than the calculated value in FactSage 6.4, 255
respectively, which is acceptable as the discrepancy. However, values obtained in [29] are 256
around two thirds less than the other three values. This could be due to the impurities in the 257
salt, salt creeping, salt decomposition or improper calibration of the DSC as insufficient 258
information is given in [29]. 259
260
Table 3. A comparison between the melting temperature and phase change enthalpy of eutectic NaCl-Na2CO3 from the
261
present work and other sources.
262
Source Melting temperature (ᵒC) Phase change enthalpy (J/g)
FactSage 6.4 [19] 632.0 294.9
Jiang et al. [19] 637.0 283.3
Ye et al. [29] 635.85 101.12
this work 635.0 311.6
263
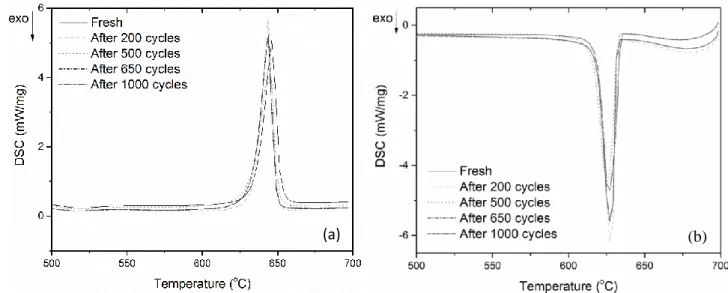
Figure 1 provides the typical DSC curves of the fresh PCM sample and the samples after 200, 264
500, 650 and 1000 thermal cycles. This PCM has a sharp endothermic peak (during melting) 265
and exothermic peak (during solidification), which indicates this PCM has good energy 266
storage and release characteristics. The melting temperature is between 632.6 ᵒC and 267
635.0 ᵒC and phase change enthalpy is between 310.2 J/g and 313.6 J/g. As seen in Table 2 268
and Figure 1, the change in phase change temperature and enthalpy with increasing number 269
of cycles is not significant, indicating its good thermal stability over 1000 thermal cycles. 270
271
Figure 1. DSC curves of eutectic NaCl-Na2CO3 after various numbers of thermal cycles: (a) melting process and (b) freezing
272
process.
273 274
The solidification temperatures of the PCM were determined as 631.9– 633.6 ᵒC over 275
cycling, which is 0.6 – 3.0 ᵒC lower than its melting temperature as a result of subcooling. 276
Due to the subcooling phenomenon, the phase change enthalpy obtained from the 277
solidification process is lower than obtained from the melting process. The energy storage 278
efficiency is calculated by dividing the phase change enthalpy during the solidification 279
process by the phase change enthalpy during the melting process. The minimum storage 280
efficiency is 97.4% and it means that 97.4% of the stored energy can be recovered during 281
the solidification, indicating a good energy recovery of the PCM. 282
283
3.2 Mass-loss corrosion rate 284
Corrosion rate measurements as a function of the number of cycles, for the studied salt 285
mixture are shown in Figure 2. The assessment of the corrosion data is based on purely 286
uniform corrosion. As can be observed from Figure 2, initially, the mass loss increases with 287
the number of cycles, and the increase is nearly linear. Then it reaches around 70 mg/cm2 288
until 350 cycles. Further cycles up to 500 do not influence the corrosion rate, thus indicating 289
that a passivation layer could be formed that prevents further corrosion. 290
291
Figure 2. Mass loss as a function of the number of cycles, obtained from the DGA methodology.
292 293
Using Eq. (3) the total thicknesses of oxide layer can be determined with this technique. If 294
we consider the oxide formed as pure and compact iron oxide (Fe2O3, with a theoretical 295
density of 5.26 g/cm3), the calculated thicknesses of the oxide layer become: 28, 56, 197, 296
and 192 µm, for 50, 100, 350, and 500 cycles, respectively. Unfortunately, as will be later 297
explained, EDS analysis of the corroded surfaces indicate that the composition of scales are 298
far from being pure and compact iron oxide and thus these values should be considered as 299
an order of magnitude . 300
301
3.3 Microstructure of containment material 302
A typical SEM image with EDS analysis on the surface of the submerged coupon that 303
underwent 100 cycles is presented in Figure 3. There are four distinct corrosion products as 304
shown in Figure 3: sodium iron oxide (dark region in lower left), iron oxide in lower right, 305
iron nickel chromium oxide on the top and base metal (bright central section). 306
307
Backscatter SEM images with EDS insets of cross-sectioned samples are shown in Error! 308
Reference source not found.a-d. These were undertaken for the SS coupons that have been
309
subject to 50, 100, 350 and 500 thermal cycles submerged in the salt. The corrosion 310
products were studied and the thickness of the products was measured and summarized in 311
Table 4. 312
The 50-cycle sample shows a two layered corrosion film, a thicker outer layer of primarily 314
iron oxide and a thinner inner layer which includes chromium and nickel. Three to four 315
layers exist in the 100-cycle sample, an inner iron chromium nickel oxide of approximately 316
10 μm thickness, an intermediate iron oxide layer also 10 μm thick and a very thin 317
(approximately 5 μm) sodium iron oxide layer. There is also an outer iron chromium nickel 318
oxide layer present in some sections. 319
320 321
322
Figure 3. Electron Backscatter image with EDX plots and compositions for 4 different products.
323 324
Table 4. Cross-section corrosion layer thickness with number of thermal cycles.
325
Sample Total oxide layer thickness (μm) Thickness of iron nickel chromium oxide, outer (μm) Thickness of sodium iron oxide (μm) Thickness of iron oxide (μm) Thickness of iron nickel chromium oxide, inner (μm) 50 cycles 25 – 30 - - 15-20 10-15 100 cycles 35 – 45 ~10 ~5 ~10 10-15 350 cycle 90 – 110 - ~20 25-30 50-60 500 cycles 80 - 85 - ~20 5-10 50-60 326
Three distinct layers are evident in the well-developed corrosion layers of the samples 327
subject to 350 and 500 cycles. A sodium iron oxide layer with a thickness of approximately 328
20 μm is present at the salt/corrosion interface. An intermediate layer of primarily iron 329
oxide 25-30 μm thick in the 350 cycles sample is reduced to 5-10 μm in the 500-cycle 330
sample. The inner layer in both samples is a 50-60 μm thick iron chromium nickel oxide in 331
contact with the bulk metal. 332
333
The corrosion layer in the 50-cycles sample has not yet formed the sodium iron oxide outer 334
layer which appears to be developing in the 100 cycles sample and it is significant in the 335
longer term test samples. It is likely that the iron oxide layer is formed when the chromium 336
oxide present on the surface is dissolved by the salt. Optical Emission Spectroscopy (OES) 337
tests performed on the salts after testing reveals the presence of both iron and chromium. 338
The higher chromium and nickel concentration in the oxide at the metal surface is likely due 339
to the growth of the oxide layer into the bulk metal and the outer iron oxide layer inhibiting 340
chromium migration into the salt. When the iron oxide layer gains enough thickness, it 341
prevents chromium migration into the salt. This is evident in the 350- and 500-cycle samples 342
with thick iron chromium nickel layers. The nickel in this layer forms a metal lattice as nickel 343
is less reactive to oxidization than iron and chromium. Both the presence of an alkali metal 344
anion/iron oxide outer layer, and chromium depletion from bulk metal and oxide layers 345
have been identified previously in the literature [7, 30, 31]. 346
347
Finally, it is noted that the 500-cycle sample has a reduced total oxide layer thickness 348
compared with the 350-cycle sample. This reduction appears to be related to the 349
intermediate iron oxide layer which has shrunk considerably. The sodium iron oxide layer 350
has been previously identified as non-protective under similar conditions [32]. This layer is 351
likely to be removed during cycling, but retains its thickness as it progressively transforms 352
the iron oxide layer. 353
354
355
Figure 4. Electron Backscatter and EDX images of the composition of a) 50 cycles, b) 100 cycles, c) 350 cycles and d) 500
356
cycles corrosion layers – sodium iron oxide, iron oxide and iron, chromium, nickel oxide (labels represent the presence of
357
indicated elements).
358
4. Conclusion 359
A long-term stability test has been conducted on a eutectic NaCl-Na2CO3 PCM. The 360
measured thermo-physical properties of this PCM did not vary significantly over 1000 361
thermal cycles. This verifies the potential of this material as a candidate PCM due to its 362
ability to maintain its thermal energy storage capacity. 363
The oxide film remaining on the surface of the test coupons grew to a thickness of 90 – 364
110 μm and developed from a primarily iron oxide layer into three distinct layers, an inner 365
iron chromium nickel oxide layer at the metal surface, an intermediate iron oxide layer and 366
a sodium iron oxide layer at the salt interface. This oxide film appears to have prevented 367
significant chromium depletion and damage to the samples submerged under that salt. 368
During the experiments, some of the formed scales are dissolved or fall into the melted 369
salts. Therefore, the thickness of the outer scale layer determined by SEM could not include 370
them. From DGA, the corrosion rate can be calculated more precisely as it takes into 371
account those scales lost during experiments and handling. For this reason, results obtained 372
for thicknesses are greater than those observed by SEM. The mass loss increases linearly 373
with the number of cycles, reaching around 70 mg/cm2 at 350 cycles. From SEM results it 374
can be observed that the first oxide layer on the steel (mainly formed by chromium, iron 375
and nickel oxides), has approximately the same thickness at 350 and 500 cycles, which could 376
indicate the stable passivation layer formation. 377
To identify the full potential use of SS316 as the containment material for the developed 378
PCM, longer term thermal cycling testing has to be performed to: (1) verify the no/slow 379
growth of this passivation layer after 350 cycles and (2) examine the stability of this 380
passivation layer after 500 cycles. 381
Acknowledgements 382
This research was performed as part of the Australian Solar Thermal Research Initiative 383
(ASTRI), a project supported by the Australian Government, through the Australian 384
Renewable Energy Agency (ARENA). The authors also acknowledge the South Australian 385
Department of State Development who have funded this research through the Premier’s 386
Research Industry Fund - International Research Grant Program (IRGP 33). Authors also wish 387
to thank the European Union's Seventh Framework Programme (FP7/2007-2013) that under 388
the Grant Agreement PIRSES-GA-2013-610692 (INNOSTORAGE) has facilitated the 389
development of this research activity.This work has also been partially funded by the 390
Spanish government (ENE2015-64117-C5-2-R (MINECO/FEDER)). 391
392
References 393
[1] M. Liu, W. Saman, F. Bruno, Review on storage materials and thermal performance enhancement 394
techniques for high temperature phase change thermal storage systems, Renewable and Sustainable 395
Energy Reviews, 16 (2012) 2118-2132. 396
[2] M. Liu, N.H. Steven Tay, S. Bell, M. Belusko, R. Jacob, G. Will, W. Saman, F. Bruno, Review on 397
concentrating solar power plants and new developments in high temperature thermal energy 398
storage technologies, Renewable and Sustainable Energy Reviews, 53 (2016) 1411-1432. 399
[3] M.M. Kenisarin, High-temperature phase change materials for thermal energy storage, 400
Renewable and Sustainable Energy Reviews, 14 (2010) 955-970. 401
[4] B. Zalba, J.M. Marín, L.F. Cabeza, H. Mehling, Review on thermal energy storage with phase 402
change: materials, heat transfer analysis and applications, Applied Thermal Engineering, 23 (2003) 403
251-283. 404
[5] J. Gomez, G.C. Glatzmaier, A. Starace, C. Turchi, J. Ortega, High temperature phase change 405
materials for thermal energy storage applications, in: SolarPACES, Granada, Spain, 2011. 406
[6] M. Liu, J.C. Gomez, C.S. Turchi, N.H.S. Tay, W. Saman, F. Bruno, Determination of thermo-physical 407
properties and stability testing of high-temperature phase-change materials for CSP applications, 408
Solar Energy Materials and Solar Cells, 139 (2015) 81-87. 409
[7] A.M. Kruizenga, Corrosion mechanisms in chloride and carbonate salts, in, Sandia National 410
Laboratories: Albuquerque, New Mexico, 2012. 411
[8] C. Prieto, J. Gallardo-González, F.J. Ruiz-Cabañas, C. Barreneche, M. Martínez, M. Segarra, A.I. 412
Fernández, Study of corrosion by Dynamic Gravimetric Analysis (DGA) methodology. Influence of 413
chloride content in solar salt, Solar Energy Materials and Solar Cells, 157 (2016) 526-532. 414
[9] Á.G. Fernández, J.C. Gomez-Vidal, Thermophysical properties of low cost lithium nitrate salts 415
produced in northern Chile for thermal energy storage, Renewable Energy, 101 (2017) 120-125. 416
[10] R.W. Bradshaw, W.M. Clift, Effect of chloride content of molten nitrate salt on corrosion of A516 417
carbon steel, in, Sandia National Laboratories, 2010. 418
[11] W.-D. Steinmann, D. Laing, R. Tamme, Development of PCM storage for process heat and power 419
generation, Journal of Solar Energy Engineering, 131 (2009) 041009. 420
[12] D. Laing, T. Bauer, W.D. Steinmann, D. Lehmann, Advanced high temperature latent heat 421
storage system - Design and test results, in: The 11th International Conference on Thermal Energy 422
Storage – Effstock, Stockholm, Sweden, 2009. 423
[13] T. Bauer, D. Laing, R. Tamme, Characterization of Sodium Nitrate as Phase Change Material, 424
International Journal of Thermophysics, 33 (2012) 91-104. 425
[14] D. Laing, C. Bahl, T. Bauer, D. Lehmann, W.-D. Steinmann, Thermal energy storage for direct 426
steam generation, Solar Energy, 85 (2011) 627-633. 427
[15] A. Lomonaco, D. Haillot, E. Pernot, E. Franquet, J.-P. Bédécarrats, Sodium nitrate thermal 428
behavior in latent heat thermal energy storage: A study of the impact of sodium nitrite on melting 429
temperature and enthalpy, Solar Energy Materials and Solar Cells, 149 (2016) 81-87. 430
[16] R.J. Petri, T.D. Claar, L.G. Marianowski, Evaluation of molten carbonates as latent heat thermal 431
energy storage materials, in: 14 th Intersociety Energy Conversion Conference, Boston, MA, USA, 432
1979. 433
[17] J.Q. Sun, R.Y. Zhang, Z.P. Liu, G.H. Lu, Thermal reliability test of Al-34%Mg-6%Zn alloy as latent 434
heat storage material and corrosion of metal with respect to thermal cycling, Energy Conversion and 435
Management, 48 (2007) 619-624. 436
[18] C.C. Leiby, T.G. Ryan, Thermo-physical properties of thermal energy storage materials – 437
Aluminum, in, 1973. 438
[19] Y. Jiang, Y. Sun, M. Liu, F. Bruno, S. Li, Eutectic Na2CO3–NaCl salt: A new phase change material 439
for high temperature thermal storage, Solar Energy Materials and Solar Cells, 152 (2016) 155-160. 440
[20] C. Edeleanu, R. Littlewood, Thermodynamics of corrosion in fused chlorides, Electrochimica 441
Acta, 3 (1960) 195-207. 442
[21] H.A.A. El-Rahman, A. Baraka, S.A.A. El-Gwad, Effect of oxide ion donors on the corrosion and 443
dechromization of stainless steels in KCl–NaCl–BaCl2 melt, Journal of Applied Electrochemistry, 29 444
(1999) 1205-1210. 445
[22] K. Sridharan, T.R. Allen, Chapter 12 - Corrosion in Molten Salts, in: F. Lantelme, H. Groult (Eds.) 446
Molten Salts Chemistry, Elsevier, 2013. 447
[23] American Iron and Steel Institute, High temperature characteristics of stainless steel - A 448
designers' Handbook Series No.9004, in, Nickel Development Institute. 449
[24] L. Ye, C. Tang, Y. Chen, S. Yang, J. Yang, W. Zhang, One-step extraction of antimony from low-450
grade stibnite in Sodium Carbonate – Sodium Chloride binary molten salt, Journal of Cleaner 451
Production, 93 (2015) 134-139. 452
[25] A. International, ASTM G1-03(2011), Standard Practice for Preparing, Cleaning, and Evaluating 453
Corrosion Test Specimens, in, West Conshohocken, PA, 2011. 454
[26] C.M. Kramer, Z.A. Munir, J.V. Volponi, Differential scanning calorimetry of sodium and 455
potassium nitrates and nitrites, Thermochimica Acta, 55 (1982) 11-17. 456
[27] A. Shukla, D. Buddhi, R.L. Sawhney, Thermal cycling test of few selected inorganic and organic 457
phase change materials, Renewable Energy, 33 (2008) 2606-2614. 458
[28] Z. Liu, D.D.L. Chung, Calorimetric evaluation of phase change materials for use as thermal 459
interface materials, Thermochimica Acta, 366 (2001) 135-147. 460
[29] L. Ye, C. Tang, Y. Chen, S. Yang, M. Tang, The thermal physical properties and stability of the 461
eutectic composition in a Na2CO3–NaCl binary system, Thermochimica Acta, 596 (2014) 14-20. 462
[30] T.-H. Lim, E.R. Hwang, H.Y. Ha, S.W. Nam, I.-H. Oh, S.-A. Hong, Effects of temperature and partial 463
pressure of CO2/O2 on corrosion behaviour of stainless-steel in molten Li/Na carbonate salt, Journal
464
of Power Sources, 89 (2000) 1-6. 465
[31] S. Frangini, Corrosion of metallic stack components in molten carbonates: Critical issues and 466
recent findings, Journal of Power Sources, 182 (2008) 462-468. 467
[32] R.W. Bradshaw, D.H. Goods, Corrosion of alloys and metals by molten nitrates, in: C.A.C. 468
Sequeira (Ed.) High Temperature Corrosion in Molten Salts, Trans Tech Publications Ltd, 2003. 469