Report
Perception Experiment
Gerhard Kremer
May 21, 2009
1 Introduction
Intending to explore if some semantic relations are cognitively more salient than others, a property generation experiment had been carried out. Depending on (broad) concept classes, differing patterns of significantly over- and under-represented types of semantic relations were found, when compared to the overall distribution of semantic relation types. This results indicate that there are concept-class specific relation types that are more salient than others for that class.
The behavioural experiment described here addresses the question if the differences in cognitive salience found in the production experiment can be confirmed when testing the participants’ perception performances. If so, the evidence for sets of concept-specific salient relation types would be stronger and invite further investigation in that direction. If, on the other hand, the first results are contradicted by the findings in the second experiment, they should be reinterpreted and considered with limitations.
2 Method
We conducted a feature verification experiment (see, e. g., Cree et al., 2006). In line with the preceding production experiment the target languages were German and Italian.
2.1 Stimuli
A set of 5 German concept words for each of the 10 concept classes used in the production experiment was chosen and additionally translated into Italian.
For each concept six semantically related words were chosen, one for each of the six relation types analysed in the first experiment. They were collected from a list of
associated words which was generated by extracting from the German WaCky Corpus1 the concept words and all those words in a 5-word window around the concept words and within sentences. Both single word frequencies and the frequencies of the words appearing together were determined, and association measures were calculated using the
UCS framework2. Finally, this list was sorted according to the association measures of the
log-likelihood statistic implemented in UCS. Appropriate words with the highest possible association measures were collected manually. The described procedure was applied under the assumption that word associates in a large text corpus are well overlapping with concepts associated by humans.
To create the non-valid stimuli set, for the same concept words relation types words were chosen with no valid relation to the concept word. Again, the word pairs were chosen from a list ordered according to association measures. The goal of this method
was to exclude unwanted effects that might arise from unbalanced associated strengths3
between valid and non-valid relations: Participants might learn to respond only on the basis of high/low associated words and evade deeper conceptual processing.
2.2 Participants
Participants were students at South Tyrolian high schools where either German or Italian is used as the teaching language. The age of the participants was between 14 and 18. In total, data from 70 Italian mother tongue speakers and 72 German mother tongue speakers was collected.
2.3 Instructions
Participants were instructed to decide if a word presented subsequently after a concept word could be used in a description of that concept. On the laptop touchpad, the left button should be pressed with the left index finger for no (“It cannot be used in a description of the concept”) and the right button should be pressed with the right index finger for yes (“It can be used in a description”).
Before the real experiment all participants did a short experiment run with 22 example trials to get used to the task. Subsequently, some of the given examples were discussed to make sure the task was understood as intended. In the real experiment, the first 5 trials were considered as starter trials. All words both used in the short run and as starters didn’t appear in the stimuli set and were not taken into account for the analysis.
Furthermore, participants filled out an anonymous questionnaire, specifying their mother tongue, the mother tongue of each of their parents, other languages spoken, age, sex, and handedness.
1
see http://wacky.sslmit.unibo.it/ for details
2see http://www.collocations.de/software.html 3
Association strength was shown to correlate with corpus co-occurrence frequency, cf. Spence and Owens (1990).
2.4 Procedure
The stimuli were presented on a laptop – in total two very similar laptop models were used to simultaneously run two experiments at a time. Words appeared in white on a black screen, with a font size of 70 pixels.
In each trial, stimuli were presented in the following order: First, a red fixation spot was shown in the middle of the screen (for 30 frames, equalling 500 ms for the given monitor refresh rate of 60 Hz). Subsequently, the spot was removed and the concept word was presented (for 500 ms) at the horizontal center and vertically shifted 105 pixels from the center of the screen to the top. It was followed by a blank screen (500 ms). After that, the semantically related/non-related word was shown vertically centered and shifted 105 pixels from the center of the screen to the bottom. From the beginning of the presentation of this word, the participant could press one of the two touchpad buttons, which instantly lead to the next screen: A white fixation spot in the middle of the screen (shown for random durations between 10 and 70 frames, in steps of 10 frames, equalling
a duration between 166,¯6 ms and 1166,¯6 ms). If the participant did not press a button,
the presentation moved to the next screen after 2000 ms (the maximum response time). The software used for presenting the stimuli and gathering the data is called VisionEgg
(see Straw, 2008), a module for the python programming language4.
2.5 Data Set
Every participant saw 300 randomised trials (150 valid and 150 false concept-relation pairs), for which an experiment run took between 15 and 18 minutes.
The data gathered in the experiment was saved in a text file and comprised for each trial a line with: the participant code including an incremental count number (subjnnn), the code for the laptop model (D620/D630), the trial number (trialnnn), the concept word presented, the (valid or non-valid) relation word presented, the validity of the presented word pair (valid/false, and starter), the mouse button pressed (mb left, mb right, mb multiple, mb none), the reaction time of the response measured from the onset of the presentation of the relation word (in seconds), the concept class, the relation type, and the English translation of the concept word.
Furthermore, configuration data of the experiment and frame refresh statistics were saved during each experiment run.
3 Analysis
A statistical analysis using mixed effects modelling as described in Baayen et al. (2008)
is conducted, using the R Statistical Programming Environment5. Moreover, an error
analysis of the responses is discussed.
Before the analysis, data was excluded from participants which were not clearly mother tongue speakers by checking in the questionnaire if the target language was indicated
4
http://python.org/
as the mother tongue of both parents. In addition, all cases were removed where no response had been given.
3.1 Mixed Effects Model Analyses
For the analyses all correct responses from German and Italian participants are taken into account. All trials concerning the relation types function and behaviour are excluded: There are no appropriate functions for animals and no appropriate behaviours of a typical tool. This is why many words used in these cases are ominous and thus might influence analysis and complicate interpretation. Furthermore, extreme outliers are excluded by leaving out those trials where the reaction time is below the 0.5-percentile or above the 99.5-percentile.
Reaction Time Analysis
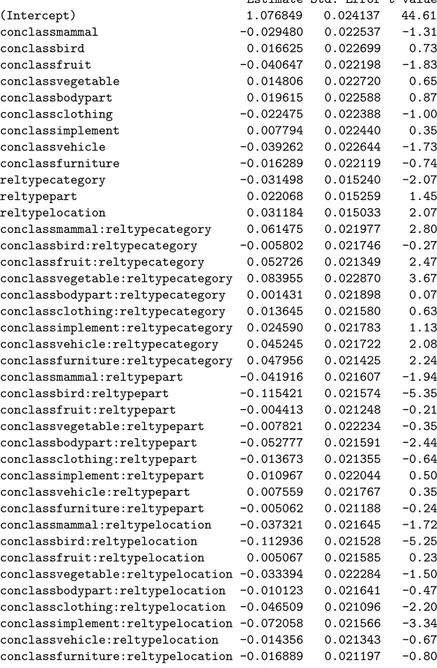
Incremental inclusion of factors and their anova comparisons lead to a model including as relevant factors concept class, relation type, and their interaction (as fixed effects), and subject, relation word length and (english) concept word (as random effects). These are used to model the reaction time of the responses given. We are aiming to see if reaction time depends on the factors concept class and relation type we controlled for. Individual performances of subjects, the length of the relation words to recognize, and particular concepts are all variables that cannot be easily controlled for and make the experiment not exactly reproducible (with other subjects and possibly other words for the given concept classes and relation types) - the subsets of subjects, relation words and concept words in this experiment are each from much larger populations. As these could conceal the effects of the independent variables in the analysis, they are considered by adding them to the model as random effects. The analysis of the model fit is shown in table 1 on page 10.
The most important information there are the t-values: As there are many hundreds of observations (21082, to be exact) given as input for the model, an absolute t-value above 2 can be assumed to have a p-value below the 0.05 significance level (cf. Baayen et al. (2008)) – which states the probability that the null hypothesis is true (“the 2 tested distributions are from the same population”). Additionally, the sign of the value gives the direction of the difference of reaction time means.
The reference level for the model’s estimates is the concept class building and the relation type quality. These are chosen on the basis of separate analyses of concept classes from relation types as the approximate mean of positive and negative distributional differences.
Compared to this reference level, 10 out of 27 interactions between concept class and relation types are significantly different – both for shorter and longer reaction times. However, comparing these results with the results from the production experiment, no consistent picture emerges: For example, assuming that produced descriptions of the relation type category for animals being over-represented would show up in this experiment as a shorter reaction time can not be confirmed – mammals seem to have
a longer reaction time, and the t-value for birds is not significant. On the other side, for parts, both mammals and birds have a significantly shorter reaction time, as could have been expected from the over-representation of relations produced for these concept classes and relation type.
However, there is neither a single concept class nor a single relation type for which no interaction is significant. That is, even though there is no general pattern arising for which an intuitive interpretation could be given, there are distinct reaction time distributions depending on differing combinations of concept classes and relation types. Adding language as a fixed effects factor changes the values only slightly, and the language factor has a non-significant t-value (0.59). That is, on the basis of the present data set, possible differences across languages can not be detected statistically.
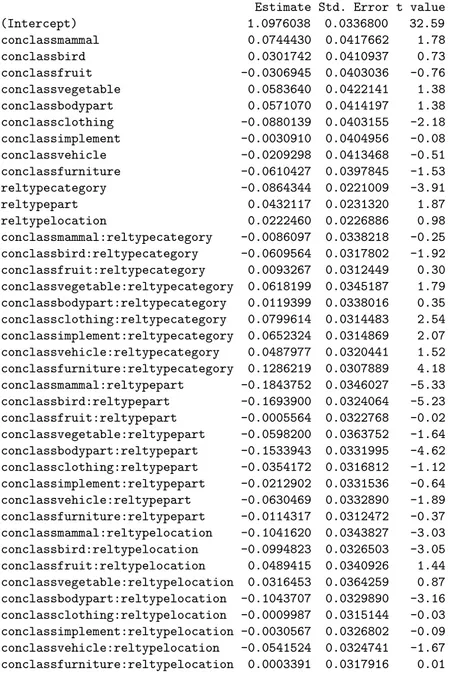
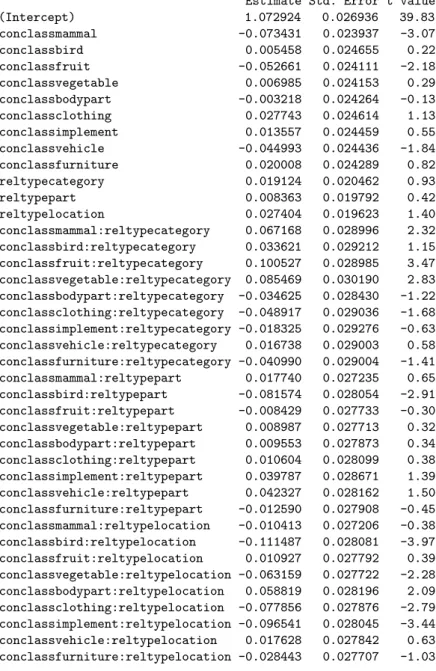
The same as above is true for the analysis with the additional fixed effects factor laptop model and the factor valid/non-valid relation: no big differences are found when comparing the models’ t-values, and the additional factors show no significant t-values. Separate analyses for valid relations and non-valid relations result in differing sets of 9 significant interactions, but no clear pattern emerges whatsoever (cf. table 2 on page 11 and table 3 on page 12).
Response Correctness Analysis
Next, an analysis with the response correctness (correct/incorrect) as the binomial dependent variable is conducted. The same factors as above are used, but leaving out the random effects factor relation word length (as including it leads to an endless model approximation process without succeeding in determining a result).
About half of the interactions (14/27) are significant at the 5 %-level, i. e. half of the combinations of concept classes and relation types are influencing if participants responded correctly. See table 4 on page 13 for the complete list of values.
Introducing the additional fixed effect factor valid/non-valid relation into this model
results in a highly significant p-value (p < 2−16). Thus, separate models for valid relations
and non-valid relations are fitted and analysed. Comparing these two models, more interactions with significant p-values and at a lower significance level are observed for the model with only valid relations in the data set (see table 5 on page 14 and table 6 on page 15). This is conform with what can be expected for non-valid relations given that relation types were not indicated in this experiment design – there should less influence of specific concept classes or relation types and less false responses, which leads to a smaller number of less significant p-values. Looking at the data, the number of incorrect responses was about three times higher for valid relations of concepts (8729, 32 % of the responses) than for non-valid relations (2961, 11 % of the responses). Besides this observation, no other patterns are obvious.
Reaction Time Analysis for Super Classes
Another mixed effect model analysis is conducted replacing the factor concept classes with super classes (broader concept classes, namely, animals, plants, and man-made
objects including body parts). Still, significant differences in reaction times showed up for some interactions, but no consistency emerged by comparing these with the results of the production experiment. Details are shown in table 7 on page 16.
3.2 Visual Reaction Time Analysis
To get a visual impression about the reaction time distributions, figure 1 on the next page shows the box-and-whisker plot of the reaction times for correct responses grouped by concept classes and the 4 analysed relation types.
The boxplot indicates the tendency of reaction time medians to be different across combinations of concept classes and relation types. Some can be explained by (and thus confirm) the production experiment results. For example, it seems intuitive to assume slower reaction times for quality relations of birds compared to part relations of birds, as quality was found to be under-represented and part slightly over-represented in the production data. Nevertheless, other reaction time medians are not differing in the directions that would have been expected, so there is no consistent image which can be drawn on the basis of this analysis. Furthermore, all reaction time distributions are almost equally spread, in particular they are spread a lot for the little differences in their medians to be clearly different from each other. For that reason, these differences should be rather looked at as tendencies.
3.3 Error Analysis
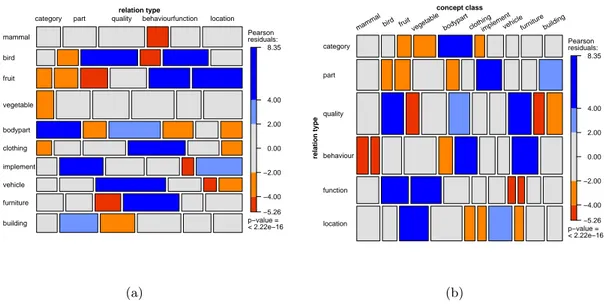
The analysis of the number of incorrect responses given is assessed in the mosaic plots in figure 2 on page 8. The data used here comprises all wrong responses to word pairs with a valid relation by mother tongue speakers. They are grouped by concept class and relation type, and the numbers of errors are depicted through rectangles, where widths and heights are proportional to the numbers of errors for the concept class and relation type under consideration. Coloured rectangles are used to mark significant deviations for the overall distributions of errors based on the p-value of the corresponding residual of a log-linear model fit. Blue color base indicates a positive residual from fitting the model, and red color base a negative residual.
Comparing the rectangle heights in the two plots, for example, shows that the concept class where the most errors were made was vegetable, the relation type with most errors was quality. The red colour of the rectangle for the relation type quality and the concept class fruit means that here significantly less errors were made than expected, whereas the blue colour for quality and bird indicates a significantly high number of errors. Both examples are conform with what was found in theses cases in the production experiment: For fruit, significantly more properties referring to the relation type quality were produced (which may lead to the assumption that this should lead to less errors when verifying a such relation). The contrary is observed for bird and quality.
Significant values can be observed for a number of combinations spread over all concept classes and relation types – some make sense when comparing them with the results of the production experiment, whereas others don’t seem to be explicable on that basis.
● ● ● ● ● ●● ●●●●●● ●● ● ●● ●●●●● ● ●●●●●●●●● ●●●●●● ● ● ●● ● ● ●●● ● ● ● ● ● ● ● category part quality location 0.6 0.8 1.0 1.2 1.4 1.6 1.8 mammal RT ●●●●●● ● ● ●●●●● ●● ● ●● ● ● ●● ● ● ● ●● ● ●● ● ● ●●● ● ● ● ●● ● ● ● ●● category part quality location 0.6 0.8 1.0 1.2 1.4 1.6 1.8 bird RT ●●●● ●● ● ● ● ● ● ●● ● ●● ●● ●● ● ● category part quality location 0.6 0.8 1.0 1.2 1.4 1.6 1.8 fruit RT ● ● ●● ●●● ● ● ● ● ● ● ●●●● category part quality location 0.6 0.8 1.0 1.2 1.4 1.6 1.8 vegetable RT ● ●● ● ● ● ● ● ● ● ●● ● ● ● ● ● ●●● ●● ●●● ●● ●● ● ● ● ● ● ● ● category part quality location 0.6 0.8 1.0 1.2 1.4 1.6 1.8 bodypart RT ●● ●● ● ● ● ● ●●● ●●●●● ●●● ●● ● ● ● ● ● ● ●● ● ●●●● ● ●● ● ● ● ● ● category part quality location 0.6 0.8 1.0 1.2 1.4 1.6 1.8 clothing RT ●●●● ● ●● ● ● ●● ●● ● ● ●●● ●● ●● ● ● category part quality location 0.6 0.8 1.0 1.2 1.4 1.6 1.8 implement RT ● ● ● ● ●●● ● ● ●●●●● ● ● ● ● ● ● ● ● ●● ● ●● category part quality location 0.6 0.8 1.0 1.2 1.4 1.6 1.8 vehicle RT ● ● ● ● ● ●●● ●● ●● ● ● ● ●●● ●● ● category part quality location 0.6 0.8 1.0 1.2 1.4 1.6 1.8 furniture RT ● ●● ●●● ● ●● ● ●● ● ●● ● ● ● ● ● ● ● category part quality location 0.6 0.8 1.0 1.2 1.4 1.6 1.8 building RT Figure 1: Bo xplots for reaction times group ed b y concept classes an d relation typ es
−5.26 −4.00 −2.00 0.00 2.00 4.00 8.35 Pearson residuals: p−value = < 2.22e−16 relation type concept class building furniture vehicle implement clothing bodypart vegetable fruit bird mammal
category part quality behaviourfunction location
(a) −5.26 −4.00 −2.00 0.00 2.00 4.00 8.35 Pearson residuals: p−value = < 2.22e−16 concept class relation type location function behaviour quality part category
mammalbird fruitvegetable bodypart clothingimplementvehiclefurniturebuilding
(b)
Figure 2: Mosaic plots for error numbers of responses to valid relations. For a description see the text.
4 Conclusion
A perception experiment (using a feature verification method) was carried out and analysed to compare results to a previously conducted production experiment (using a property generation approach). The underlying research question was if differences in participants’ performances could be discovered depending on concept class and relation type of the respective word pair stimuli.
Mixed effects models were analysed using reaction time or response correctness as the dependent variable. Both showed significant differences depending on which concept class the presented concept word belonged to, and which relation type the presented relation word had. This result is restriced to a subset of all possible combinations of concept classes and relation types, constituting no specific pattern that might be interpreted more generally. Furthermore, single results of each analysis could be interpreted on the basis of the production experiment, others could not. Analyses with concept super classes, a visual check of the reaction time distributions, and the analysis of the response errors drew the same picture. In summary, although not as consistent and generalisable as in the production experiment, significant differences in the mental processing of relation types for specific concept classes could be found. Across languages, no significant differences were detected. The results do not confirm the previous results in detail, but they also do not contradict them.
A few modifications in the experiment design might support clearer analysis results. To better compare the results with those of the production experiment, a second experiment could be conducted with only word pairs that appeared in that experiment.
The range of reaction times measured was reaching up to the maximum response time allowed. This could mean that there was not sufficient time for the participants to process the word stimuli deeply enough for the intended task and that they had to develop another strategy in some cases.
It might as well be that there are more differences in reaction time distributions which were not detectable as some effects of concept classes and relation types are less prominent. For that case, the collection of a bigger amount of data should give more insight.
The stimuli collection was made on the basis of an admittedly large web corpus, but appropriate word pairs were hard to find. Collecting them from other sources, or from (other) participants is an alternative. Moreover, the Italian stimuli were translations -they were not collected in the corpus using the same method, because the aim was to provide the same concepts in both languages. It seems also reasonable to collect the words separately for each language while trying to adapt to similar familiarity measures.
A second issue about the stimuli word pairs concerns the relation type. In the
experiment presented, participants were not given the type of relation, which is why some word pairs could be interpreted with a relation type different from intended one, but which is more prominent for the participant. To exclude this alternative interpretation one solution is to indicate the relation type in the experiment – we didn’t do that in the present experiment in favour of a bigger mental processing load, which we hoped would result in greater differences in reaction times.
The results of the present experiment show that concept classes and the relation types of word pairs have an influence on the mental processing of their semantic relation. Future experiments will show if these tendencies can be confirmed in more detail and if salient relation types can be defined for groups of concept classes as in our first experiment.
References
Baayen, R. H., Davidson, D. J., and Bates, D. M. (2008). Mixed Effects Modeling With Crossed Random Effects for Subjects and Items. Journal of Memory and Language, 59:390–412.
Cree, G. S., McNorgan, C., and McRae, K. (2006). Distinctive Features Hold a Privileged Status in the Computation of Word Meaning: Implications for Theories of Semantic Memory. Journal of Experimental Psychology: Learning, Meaning, and Cognition, 32(4):643–658.
Spence, D. P. and Owens, K. C. (1990). Lexical Co-Occurrence and Association Strength. Journal of Psycholinguistic Research, 19(5):317–330.
Straw, A. D. (2008). Vision Egg: An Open-Source Library for Realtime Visual Stimulus Generation. Frontiers in Neuroinformatics.
Table 1: Model fit for all correct responses
Linear mixed model fit by REML
Formula: RT ~ conclass * reltype + (1 | subjn) + (1 | rlength) + (1 | conengl) AIC BIC logLik deviance REMLdev
1149 1499 -530.3 792 1061 Random effects:
Groups Name Variance Std.Dev. subjn (Intercept) 0.01925208 0.138752 conengl (Intercept) 0.00065312 0.025556 rlength (Intercept) 0.00250580 0.050058 Residual 0.05897077 0.242839
Number of obs: 21082, groups: subjn, 142; conengl, 50; rlength, 14 Fixed effects:
Estimate Std. Error t value (Intercept) 1.076849 0.024137 44.61 conclassmammal -0.029480 0.022537 -1.31 conclassbird 0.016625 0.022699 0.73 conclassfruit -0.040647 0.022198 -1.83 conclassvegetable 0.014806 0.022720 0.65 conclassbodypart 0.019615 0.022588 0.87 conclassclothing -0.022475 0.022388 -1.00 conclassimplement 0.007794 0.022440 0.35 conclassvehicle -0.039262 0.022644 -1.73 conclassfurniture -0.016289 0.022119 -0.74 reltypecategory -0.031498 0.015240 -2.07 reltypepart 0.022068 0.015259 1.45 reltypelocation 0.031184 0.015033 2.07 conclassmammal:reltypecategory 0.061475 0.021977 2.80 conclassbird:reltypecategory -0.005802 0.021746 -0.27 conclassfruit:reltypecategory 0.052726 0.021349 2.47 conclassvegetable:reltypecategory 0.083955 0.022870 3.67 conclassbodypart:reltypecategory 0.001431 0.021898 0.07 conclassclothing:reltypecategory 0.013645 0.021580 0.63 conclassimplement:reltypecategory 0.024590 0.021783 1.13 conclassvehicle:reltypecategory 0.045245 0.021722 2.08 conclassfurniture:reltypecategory 0.047956 0.021425 2.24 conclassmammal:reltypepart -0.041916 0.021607 -1.94 conclassbird:reltypepart -0.115421 0.021574 -5.35 conclassfruit:reltypepart -0.004413 0.021248 -0.21 conclassvegetable:reltypepart -0.007821 0.022234 -0.35 conclassbodypart:reltypepart -0.052777 0.021591 -2.44 conclassclothing:reltypepart -0.013673 0.021355 -0.64 conclassimplement:reltypepart 0.010967 0.022044 0.50 conclassvehicle:reltypepart 0.007559 0.021767 0.35 conclassfurniture:reltypepart -0.005062 0.021188 -0.24 conclassmammal:reltypelocation -0.037321 0.021645 -1.72 conclassbird:reltypelocation -0.112936 0.021528 -5.25 conclassfruit:reltypelocation 0.005067 0.021585 0.23 conclassvegetable:reltypelocation -0.033394 0.022284 -1.50 conclassbodypart:reltypelocation -0.010123 0.021641 -0.47 conclassclothing:reltypelocation -0.046509 0.021096 -2.20
Table 2: Model fit for all correct responses to valid relations
Linear mixed model fit by REML
Formula: RT ~ conclass * reltype + (1 | conengl) + (1 | rlength) + (1 | subjn) AIC BIC logLik deviance REMLdev
480.5 794.8 -196.3 160.9 392.5 Random effects:
Groups Name Variance Std.Dev. subjn (Intercept) 0.0233814 0.152910 conengl (Intercept) 0.0027442 0.052385 rlength (Intercept) 0.0018408 0.042905 Residual 0.0559968 0.236636
Number of obs: 9339, groups: subjn, 142; conengl, 50; rlength, 14 Fixed effects:
Estimate Std. Error t value (Intercept) 1.0976038 0.0336800 32.59 conclassmammal 0.0744430 0.0417662 1.78 conclassbird 0.0301742 0.0410937 0.73 conclassfruit -0.0306945 0.0403036 -0.76 conclassvegetable 0.0583640 0.0422141 1.38 conclassbodypart 0.0571070 0.0414197 1.38 conclassclothing -0.0880139 0.0403155 -2.18 conclassimplement -0.0030910 0.0404956 -0.08 conclassvehicle -0.0209298 0.0413468 -0.51 conclassfurniture -0.0610427 0.0397845 -1.53 reltypecategory -0.0864344 0.0221009 -3.91 reltypepart 0.0432117 0.0231320 1.87 reltypelocation 0.0222460 0.0226886 0.98 conclassmammal:reltypecategory -0.0086097 0.0338218 -0.25 conclassbird:reltypecategory -0.0609564 0.0317802 -1.92 conclassfruit:reltypecategory 0.0093267 0.0312449 0.30 conclassvegetable:reltypecategory 0.0618199 0.0345187 1.79 conclassbodypart:reltypecategory 0.0119399 0.0338016 0.35 conclassclothing:reltypecategory 0.0799614 0.0314483 2.54 conclassimplement:reltypecategory 0.0652324 0.0314869 2.07 conclassvehicle:reltypecategory 0.0487977 0.0320441 1.52 conclassfurniture:reltypecategory 0.1286219 0.0307889 4.18 conclassmammal:reltypepart -0.1843752 0.0346027 -5.33 conclassbird:reltypepart -0.1693900 0.0324064 -5.23 conclassfruit:reltypepart -0.0005564 0.0322768 -0.02 conclassvegetable:reltypepart -0.0598200 0.0363752 -1.64 conclassbodypart:reltypepart -0.1533943 0.0331995 -4.62 conclassclothing:reltypepart -0.0354172 0.0316812 -1.12 conclassimplement:reltypepart -0.0212902 0.0331536 -0.64 conclassvehicle:reltypepart -0.0630469 0.0332890 -1.89 conclassfurniture:reltypepart -0.0114317 0.0312472 -0.37 conclassmammal:reltypelocation -0.1041620 0.0343827 -3.03 conclassbird:reltypelocation -0.0994823 0.0326503 -3.05 conclassfruit:reltypelocation 0.0489415 0.0340926 1.44 conclassvegetable:reltypelocation 0.0316453 0.0364259 0.87 conclassbodypart:reltypelocation -0.1043707 0.0329890 -3.16 conclassclothing:reltypelocation -0.0009987 0.0315144 -0.03 conclassimplement:reltypelocation -0.0030567 0.0326802 -0.09
Table 3: Model fit for all correct responses to non-valid responses
Linear mixed model fit by REML
Formula: RT ~ conclass * reltype + (1 | conengl) + (1 | rlength) + (1 | subjn) AIC BIC logLik deviance REMLdev
335.5 659.8 -123.7 -5.646 247.5 Random effects:
Groups Name Variance Std.Dev. subjn (Intercept) 0.0188730 0.137379 conengl (Intercept) 0.0004692 0.021661 rlength (Intercept) 0.0031651 0.056259 Residual 0.0559694 0.236579
Number of obs: 11743, groups: subjn, 142; conengl, 50; rlength, 12 Fixed effects:
Estimate Std. Error t value (Intercept) 1.072924 0.026936 39.83 conclassmammal -0.073431 0.023937 -3.07 conclassbird 0.005458 0.024655 0.22 conclassfruit -0.052661 0.024111 -2.18 conclassvegetable 0.006985 0.024153 0.29 conclassbodypart -0.003218 0.024264 -0.13 conclassclothing 0.027743 0.024614 1.13 conclassimplement 0.013557 0.024459 0.55 conclassvehicle -0.044993 0.024436 -1.84 conclassfurniture 0.020008 0.024289 0.82 reltypecategory 0.019124 0.020462 0.93 reltypepart 0.008363 0.019792 0.42 reltypelocation 0.027404 0.019623 1.40 conclassmammal:reltypecategory 0.067168 0.028996 2.32 conclassbird:reltypecategory 0.033621 0.029212 1.15 conclassfruit:reltypecategory 0.100527 0.028985 3.47 conclassvegetable:reltypecategory 0.085469 0.030190 2.83 conclassbodypart:reltypecategory -0.034625 0.028430 -1.22 conclassclothing:reltypecategory -0.048917 0.029036 -1.68 conclassimplement:reltypecategory -0.018325 0.029276 -0.63 conclassvehicle:reltypecategory 0.016738 0.029003 0.58 conclassfurniture:reltypecategory -0.040990 0.029004 -1.41 conclassmammal:reltypepart 0.017740 0.027235 0.65 conclassbird:reltypepart -0.081574 0.028054 -2.91 conclassfruit:reltypepart -0.008429 0.027733 -0.30 conclassvegetable:reltypepart 0.008987 0.027713 0.32 conclassbodypart:reltypepart 0.009553 0.027873 0.34 conclassclothing:reltypepart 0.010604 0.028099 0.38 conclassimplement:reltypepart 0.039787 0.028671 1.39 conclassvehicle:reltypepart 0.042327 0.028162 1.50 conclassfurniture:reltypepart -0.012590 0.027908 -0.45 conclassmammal:reltypelocation -0.010413 0.027206 -0.38 conclassbird:reltypelocation -0.111487 0.028081 -3.97 conclassfruit:reltypelocation 0.010927 0.027792 0.39 conclassvegetable:reltypelocation -0.063159 0.027722 -2.28 conclassbodypart:reltypelocation 0.058819 0.028196 2.09 conclassclothing:reltypelocation -0.077856 0.027876 -2.79
Table 4: Fit for binary model
Generalized linear mixed model fit by the Laplace approximation Formula: correct ~ conclass * reltype + (1 | conengl) + (1 | subjn)
AIC BIC logLik deviance 26840 27184 -13378 26756 Random effects:
Groups Name Variance Std.Dev. subjn (Intercept) 0.11531 0.33958 conengl (Intercept) 0.10321 0.32127
Number of obs: 26893, groups: subjn, 142; conengl, 50 Fixed effects:
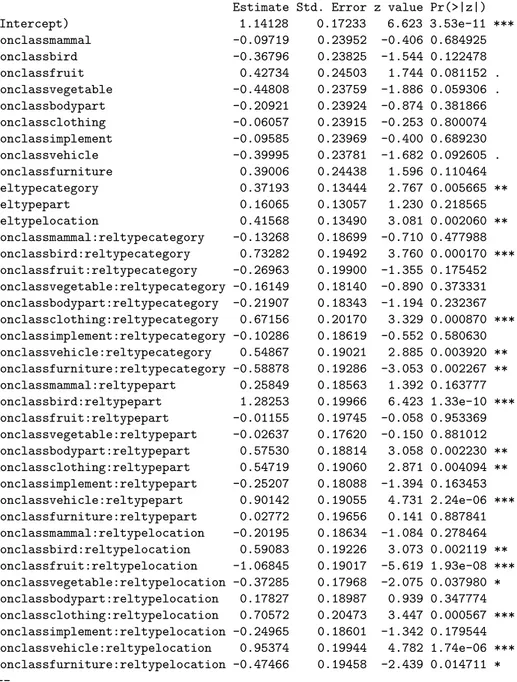
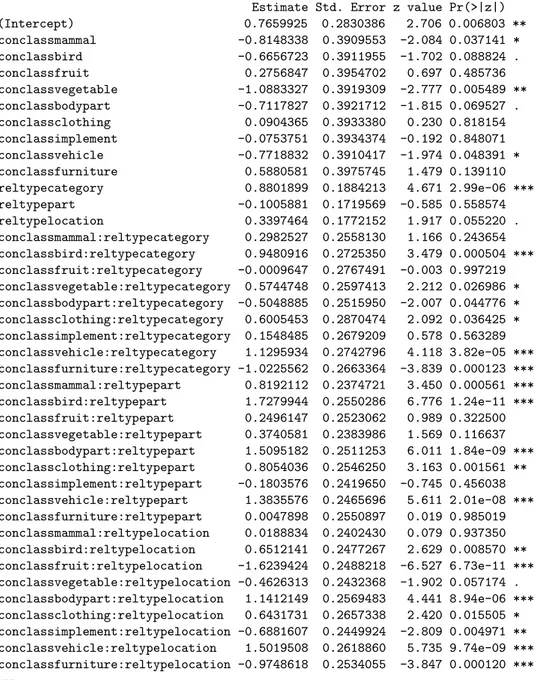
Estimate Std. Error z value Pr(>|z|) (Intercept) 1.14128 0.17233 6.623 3.53e-11 *** conclassmammal -0.09719 0.23952 -0.406 0.684925 conclassbird -0.36796 0.23825 -1.544 0.122478 conclassfruit 0.42734 0.24503 1.744 0.081152 . conclassvegetable -0.44808 0.23759 -1.886 0.059306 . conclassbodypart -0.20921 0.23924 -0.874 0.381866 conclassclothing -0.06057 0.23915 -0.253 0.800074 conclassimplement -0.09585 0.23969 -0.400 0.689230 conclassvehicle -0.39995 0.23781 -1.682 0.092605 . conclassfurniture 0.39006 0.24438 1.596 0.110464 reltypecategory 0.37193 0.13444 2.767 0.005665 ** reltypepart 0.16065 0.13057 1.230 0.218565 reltypelocation 0.41568 0.13490 3.081 0.002060 ** conclassmammal:reltypecategory -0.13268 0.18699 -0.710 0.477988 conclassbird:reltypecategory 0.73282 0.19492 3.760 0.000170 *** conclassfruit:reltypecategory -0.26963 0.19900 -1.355 0.175452 conclassvegetable:reltypecategory -0.16149 0.18140 -0.890 0.373331 conclassbodypart:reltypecategory -0.21907 0.18343 -1.194 0.232367 conclassclothing:reltypecategory 0.67156 0.20170 3.329 0.000870 *** conclassimplement:reltypecategory -0.10286 0.18619 -0.552 0.580630 conclassvehicle:reltypecategory 0.54867 0.19021 2.885 0.003920 ** conclassfurniture:reltypecategory -0.58878 0.19286 -3.053 0.002267 ** conclassmammal:reltypepart 0.25849 0.18563 1.392 0.163777 conclassbird:reltypepart 1.28253 0.19966 6.423 1.33e-10 *** conclassfruit:reltypepart -0.01155 0.19745 -0.058 0.953369 conclassvegetable:reltypepart -0.02637 0.17620 -0.150 0.881012 conclassbodypart:reltypepart 0.57530 0.18814 3.058 0.002230 ** conclassclothing:reltypepart 0.54719 0.19060 2.871 0.004094 ** conclassimplement:reltypepart -0.25207 0.18088 -1.394 0.163453 conclassvehicle:reltypepart 0.90142 0.19055 4.731 2.24e-06 *** conclassfurniture:reltypepart 0.02772 0.19656 0.141 0.887841 conclassmammal:reltypelocation -0.20195 0.18634 -1.084 0.278464 conclassbird:reltypelocation 0.59083 0.19226 3.073 0.002119 ** conclassfruit:reltypelocation -1.06845 0.19017 -5.619 1.93e-08 *** conclassvegetable:reltypelocation -0.37285 0.17968 -2.075 0.037980 * conclassbodypart:reltypelocation 0.17827 0.18987 0.939 0.347774 conclassclothing:reltypelocation 0.70572 0.20473 3.447 0.000567 *** conclassimplement:reltypelocation -0.24965 0.18601 -1.342 0.179544 conclassvehicle:reltypelocation 0.95374 0.19944 4.782 1.74e-06 *** conclassfurniture:reltypelocation -0.47466 0.19458 -2.439 0.014711 *
Table 5: Fit for binary model – only responses to valid relations
Generalized linear mixed model fit by the Laplace approximation Formula: correct ~ conclass * reltype + (1 | conengl) + (1 | subjn)
AIC BIC logLik deviance 14794 15110 -7355 14710 Random effects:
Groups Name Variance Std.Dev. subjn (Intercept) 0.36012 0.60010 conengl (Intercept) 0.31123 0.55788
Number of obs: 13614, groups: subjn, 142; conengl, 50 Fixed effects:
Estimate Std. Error z value Pr(>|z|) (Intercept) 0.7659925 0.2830386 2.706 0.006803 ** conclassmammal -0.8148338 0.3909553 -2.084 0.037141 * conclassbird -0.6656723 0.3911955 -1.702 0.088824 . conclassfruit 0.2756847 0.3954702 0.697 0.485736 conclassvegetable -1.0883327 0.3919309 -2.777 0.005489 ** conclassbodypart -0.7117827 0.3921712 -1.815 0.069527 . conclassclothing 0.0904365 0.3933380 0.230 0.818154 conclassimplement -0.0753751 0.3934374 -0.192 0.848071 conclassvehicle -0.7718832 0.3910417 -1.974 0.048391 * conclassfurniture 0.5880581 0.3975745 1.479 0.139110 reltypecategory 0.8801899 0.1884213 4.671 2.99e-06 *** reltypepart -0.1005881 0.1719569 -0.585 0.558574 reltypelocation 0.3397464 0.1772152 1.917 0.055220 . conclassmammal:reltypecategory 0.2982527 0.2558130 1.166 0.243654 conclassbird:reltypecategory 0.9480916 0.2725350 3.479 0.000504 *** conclassfruit:reltypecategory -0.0009647 0.2767491 -0.003 0.997219 conclassvegetable:reltypecategory 0.5744748 0.2597413 2.212 0.026986 * conclassbodypart:reltypecategory -0.5048885 0.2515950 -2.007 0.044776 * conclassclothing:reltypecategory 0.6005453 0.2870474 2.092 0.036425 * conclassimplement:reltypecategory 0.1548485 0.2679209 0.578 0.563289 conclassvehicle:reltypecategory 1.1295934 0.2742796 4.118 3.82e-05 *** conclassfurniture:reltypecategory -1.0225562 0.2663364 -3.839 0.000123 *** conclassmammal:reltypepart 0.8192112 0.2374721 3.450 0.000561 *** conclassbird:reltypepart 1.7279944 0.2550286 6.776 1.24e-11 *** conclassfruit:reltypepart 0.2496147 0.2523062 0.989 0.322500 conclassvegetable:reltypepart 0.3740581 0.2383986 1.569 0.116637 conclassbodypart:reltypepart 1.5095182 0.2511253 6.011 1.84e-09 *** conclassclothing:reltypepart 0.8054036 0.2546250 3.163 0.001561 ** conclassimplement:reltypepart -0.1803576 0.2419650 -0.745 0.456038 conclassvehicle:reltypepart 1.3835576 0.2465696 5.611 2.01e-08 *** conclassfurniture:reltypepart 0.0047898 0.2550897 0.019 0.985019 conclassmammal:reltypelocation 0.0188834 0.2402430 0.079 0.937350 conclassbird:reltypelocation 0.6512141 0.2477267 2.629 0.008570 ** conclassfruit:reltypelocation -1.6239424 0.2488218 -6.527 6.73e-11 *** conclassvegetable:reltypelocation -0.4626313 0.2432368 -1.902 0.057174 . conclassbodypart:reltypelocation 1.1412149 0.2569483 4.441 8.94e-06 *** conclassclothing:reltypelocation 0.6431731 0.2657338 2.420 0.015505 * conclassimplement:reltypelocation -0.6881607 0.2449924 -2.809 0.004971 ** conclassvehicle:reltypelocation 1.5019508 0.2618860 5.735 9.74e-09 ***
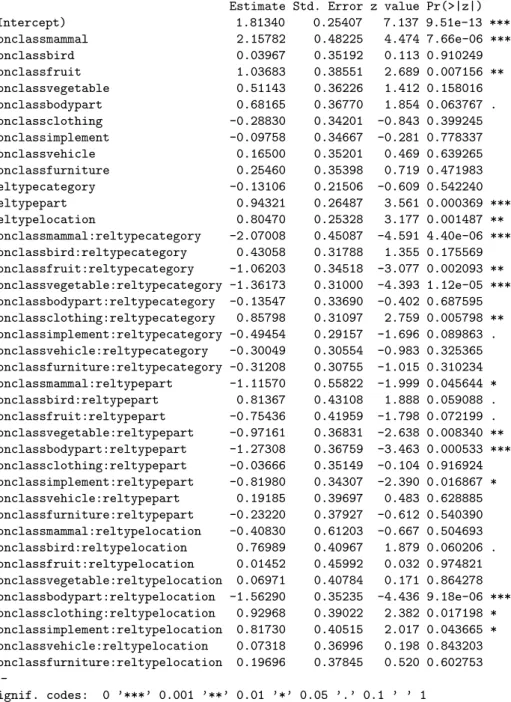
Table 6: Fit for binary model – only responses to non-valid relations
Generalized linear mixed model fit by the Laplace approximation Formula: correct ~ conclass * reltype + (1 | conengl) + (1 | subjn)
AIC BIC logLik deviance 8515 8830 -4216 8431 Random effects:
Groups Name Variance Std.Dev. subjn (Intercept) 0.47331 0.68797 conengl (Intercept) 0.18321 0.42803
Number of obs: 13279, groups: subjn, 142; conengl, 50 Fixed effects:
Estimate Std. Error z value Pr(>|z|) (Intercept) 1.81340 0.25407 7.137 9.51e-13 *** conclassmammal 2.15782 0.48225 4.474 7.66e-06 *** conclassbird 0.03967 0.35192 0.113 0.910249 conclassfruit 1.03683 0.38551 2.689 0.007156 ** conclassvegetable 0.51143 0.36226 1.412 0.158016 conclassbodypart 0.68165 0.36770 1.854 0.063767 . conclassclothing -0.28830 0.34201 -0.843 0.399245 conclassimplement -0.09758 0.34667 -0.281 0.778337 conclassvehicle 0.16500 0.35201 0.469 0.639265 conclassfurniture 0.25460 0.35398 0.719 0.471983 reltypecategory -0.13106 0.21506 -0.609 0.542240 reltypepart 0.94321 0.26487 3.561 0.000369 *** reltypelocation 0.80470 0.25328 3.177 0.001487 ** conclassmammal:reltypecategory -2.07008 0.45087 -4.591 4.40e-06 *** conclassbird:reltypecategory 0.43058 0.31788 1.355 0.175569 conclassfruit:reltypecategory -1.06203 0.34518 -3.077 0.002093 ** conclassvegetable:reltypecategory -1.36173 0.31000 -4.393 1.12e-05 *** conclassbodypart:reltypecategory -0.13547 0.33690 -0.402 0.687595 conclassclothing:reltypecategory 0.85798 0.31097 2.759 0.005798 ** conclassimplement:reltypecategory -0.49454 0.29157 -1.696 0.089863 . conclassvehicle:reltypecategory -0.30049 0.30554 -0.983 0.325365 conclassfurniture:reltypecategory -0.31208 0.30755 -1.015 0.310234 conclassmammal:reltypepart -1.11570 0.55822 -1.999 0.045644 * conclassbird:reltypepart 0.81367 0.43108 1.888 0.059088 . conclassfruit:reltypepart -0.75436 0.41959 -1.798 0.072199 . conclassvegetable:reltypepart -0.97161 0.36831 -2.638 0.008340 ** conclassbodypart:reltypepart -1.27308 0.36759 -3.463 0.000533 *** conclassclothing:reltypepart -0.03666 0.35149 -0.104 0.916924 conclassimplement:reltypepart -0.81980 0.34307 -2.390 0.016867 * conclassvehicle:reltypepart 0.19185 0.39697 0.483 0.628885 conclassfurniture:reltypepart -0.23220 0.37927 -0.612 0.540390 conclassmammal:reltypelocation -0.40830 0.61203 -0.667 0.504693 conclassbird:reltypelocation 0.76989 0.40967 1.879 0.060206 . conclassfruit:reltypelocation 0.01452 0.45992 0.032 0.974821 conclassvegetable:reltypelocation 0.06971 0.40784 0.171 0.864278 conclassbodypart:reltypelocation -1.56290 0.35235 -4.436 9.18e-06 *** conclassclothing:reltypelocation 0.92968 0.39022 2.382 0.017198 * conclassimplement:reltypelocation 0.81730 0.40515 2.017 0.043665 * conclassvehicle:reltypelocation 0.07318 0.36996 0.198 0.843203 conclassfurniture:reltypelocation 0.19696 0.37845 0.520 0.602753
Table 7: Fit for binary model with concept super classes
Linear mixed model fit by REML
Formula: RT ~ sclass * reltype + (1 | conengl) + (1 | rlength) + (1 | subjn) AIC BIC logLik deviance REMLdev
1013 1140 -490.5 890.6 981 Random effects:
Groups Name Variance Std.Dev. subjn (Intercept) 0.01923766 0.138700 conengl (Intercept) 0.00082096 0.028652 rlength (Intercept) 0.00276417 0.052575 Residual 0.05914066 0.243189
Number of obs: 21082, groups: subjn, 142; conengl, 50; rlength, 14 Fixed effects:
Estimate Std. Error t value (Intercept) 1.071279 0.019973 53.64 sclassanimal 0.001588 0.014003 0.11 sclassplant -0.004691 0.013817 -0.34 reltypecategory -0.010920 0.006430 -1.70 reltypepart 0.012394 0.006230 1.99 reltypelocation 0.004436 0.006223 0.71 sclassanimal:reltypecategory 0.006787 0.012880 0.53 sclassplant:reltypecategory 0.042844 0.012779 3.35 sclassanimal:reltypepart -0.068697 0.012510 -5.49 sclassplant:reltypepart 0.003456 0.012625 0.27 sclassanimal:reltypelocation -0.048626 0.012689 -3.83 sclassplant:reltypelocation 0.013748 0.012846 1.07