UNIVERSITÀ DEGLI STUDI DI NAPOLI "FEDERICO II"
DIPARTIMENTO DI FARMACIA
PhD Thesis in Pharmaceutical Sciences
XXX cycle
By
Alessia CASO
Date of defense: 26/06/2018
Novel bioactive metabolites from marine
sources: isolation, structural elucidation and
synthetic studies.
“
Non chi comincia
ma quel che persevera”
CONTENTS
ABSTRACT ... I
INTRODUCTION ... 1
References ... 8
CHAPTER 1 ... 9
STRUCTURAL ELUCIDATION TECHNIQUES ... 9
1.1 Nuclear Magnetic Resonance ... 9
1.1.1 One-dimensional NMR experiments ... 12
1.1.2 Two-dimensional NMR experiments ... 13
1.2. Methods for the determination of relative/absolute configurations ... 15
1.3 Mass spectrometry ... 17 1.4. Infrared Spectroscopy ... 20 1.5. Circular Dichroism ... 21 1.6. Marfey’s Method ... 22 1.7 Conclusion... 25 References ... 26
CHAPTER 2 ... 28
TOTAL SYNTHESIS OF 16-EPI- AND ENT-SMENAMIDE A, TWO ANALOGUES OF THE CYTOTOXIC SMENAMIDE A ... 28
2.1 Cancer and bioactive natural products ... 28
2.2 Smenamides A and B, two cytotoxic secondary metabolites from the marine sponge Smenospongia aurea ... 33
2.3. Towards the synthesis of smenamide A: total synthesis of 16-epi- and ent-smenamide A ... 35
2.4 Previous stereochemical studies on smenamide A ... 35
2.5. Synthetic strategy ... 40
2.5.1 Retrosynthetic analysis ... 40
2.5.2 Synthesis of the polyketide moiety ... 42
2.5.3 Preparation of the peptide moiety and final coupling ... 47
2.6. Conclusions ... 51
2.7. Experimental section ... 51
2.7.1 Generals ... 51
2.7.2 Experimental procedures ... 52
Determination of the absolute coinfiguration at C-8 of smenamide A by using Marfey’s method. ... 52
CHAPTER 3 ... 108
SYNTHESIS AND BIOLOGICAL ACTIVITY OF EIGHT SMENAMIDE A-FUNCTIONAL ANALOGUES ... 108
3.1 Synthesis of eight smenamide A-analogues of the 16-epi- series and their biological activity ... 108
3.2. In vitro evaluation of the antiproliferative activity ... 112
3.3 Conclusions ... 112
3.4. Experimental section ... 113
3.4.1 Generals ... 113
3.4.2 Experimental procedures ... 113
3.6 Supplementary spectroscopic data ... 121
References ... 129
PART 2 - Isolation and structural determination of new bioactive metabolites from marine sources ... 131
CHAPTER 4 ... 133
CONULOTHIAZOLES A AND B, TWO CHLORINATED PEPTIDE/POLYKETIDE METABOLITES FROM THE MARINE SPONGE SMENOSPONGIA CONULOSA ... 133
4.1 Isolation of conulothiazoles A and B ... 134
4.4 Determination of the absolute configuration of the amino acid residues of conulothiazoles A and B ... 141 4.5 Biogenetic studies ... 143 4.6 Conclusions ... 146 4.7 Experimental section ... 147 4.7.1 Collection ... 147
4.7.2 Extraction and Isolation ... 147
4.7.3 Conulothiazole A (5) ... 148
4.7.4 Conulothiazole B (6) ... 148
4.7.5 Ozonolysis and Hydrolysis ... 149
4.7.6 Marfey’s Derivatization with D- and L-FDAA ... 149
4.7.7 High-resolution LC-MS Analysis of Marfey's derivatives ... 149
4.8 Supplementary spectroscopic data ... 151
References ... 159
CHAPTER 5 ... 161
EVALUATION OF THE ANTIPROLIFERATIVE ACTIVITY OF THE ORGANIC EXTRACT OF GEODIA CYDONIUM ... 161
5.1 Bioguided fractionation of G. cydonium extracts ... 162
5.2 Combined use of LC-HRMS, LC-HRMS/MS and molecular networking as a novel dereplication strategy ... 163
5.4 Conclusions ... 173
5.5 Experimental section ... 174
5.5.1 Collection, extraction, and separation ... 174
5.5.2 LC-HRMS and LC-HRMS/MS and Molecular Networking Analyses ... 175
5.5.3 Cell culture ... 176
5.5.4 Cell treatment and cell proliferation assay ... 177
5.5.5 Apoptosis evaluation ... 178
5.5.6 Cell cycle assay ... 178
5.5.7 Extraction of the polar fractions in untreated and treated cancer cells 179 5.5.8 1H-NMR Metabolomic Analysis of the cellular polar fractions ... 179
5.5.9 Statistical and Pathway Analysis ... 180
5.5.10 Bio-Plex Assay ... 180
References ... 182
CONCLUSION ... 184
CHAPTER 1 ... 9
Figure 1.1. Scheme of a NMR spectrometer. ... 10
Figure 1.2. A spinning charged particule generate a magnetic field. ... 11
Figure 1.3. Spin energy states. ... 11
Figure 1.4. ESI mass spectrometry ... 18
Figure 1.5. Ion trajectories in an Orbitrap mass spectrometer. ... 20
Figure 1.6. L-FDAA structure. ... 23
Figure 1.7. Plausible conformations of the L- and D-amminoacids derivatives during separation by Marfey’s method. ... 24
CHAPTER 2 ... 28
Figure 2.1 Structures of smenamide A (1) and B (2). ... 33
Figure 2.2. MTT assay of smenamides A and B. Evaluation by MTT assay of Calu-1 cell viability after 72 h of treatment with (A) compound Calu-1 and (B) compound 2. ... 34
Figure 2.3. Evaluation of pro-apoptotic activity of smenamides using the Annexin-V FITC/PI assay. ... 34
Figura 2.4. High-resolution ESI mass spectrum of smenamide A. ... 36
Figura 2.5. 1H NMR spectrum of smenamide A (1) (CD 3OD, 700 MHz). ... 36
bonds of the molecule. ... 38
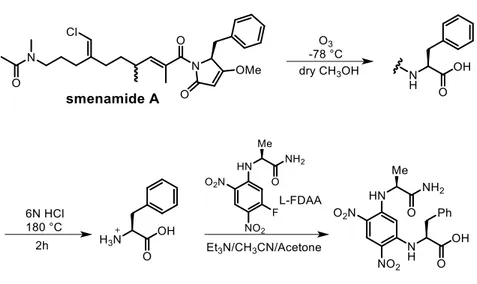
Figure 2.8. Ozonolysis, hydrolysis and detivatisation of smenamide A with L-FDAA. ... 39
Figure 2.9. High resolution LC-MS analysis of Marfey’s derivative from smenamide A. Extracted-ion chromatograms at m/z 418.1357 of authentic 1-fluoro-2,4-dinitrophenyl-5-alanine amide L-phenilalanine (L-FDAA-L-Phe), authentic D-FDAA-L-Phe and L-FDAA-Phe from smenamide A. ... 40
Figure 2.10. Retrosynthetic analysis of smenamide A ... 41
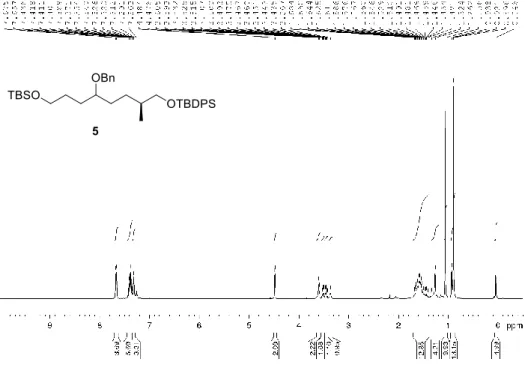
Figure 2.11 Preparation of the fully protected triol 5 ... 43
Figure 2.12 Installation of the N-methylacetamido function ... 45
Figure 2.13. Installation of the chlorovinyl moiety. ... 46
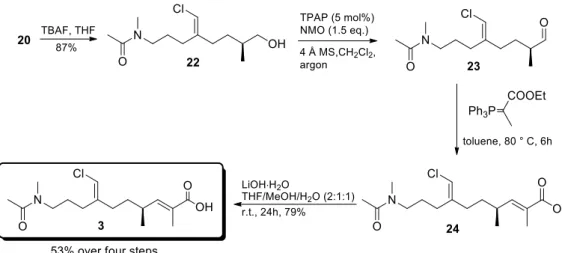
Figure 2.14. Preparation of the α,β-unsaturated ester 24. ... 47
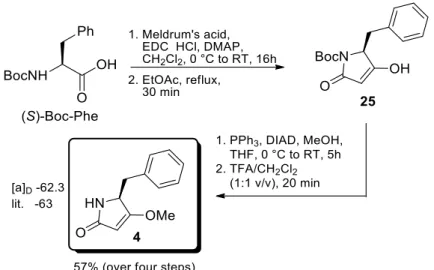
Figure 2.15. Synthesis of the pyrrolidinone unit 24. ... 48
Figure 2.16. Final coupling. ... 49
Figure 2.17. 1H NMR spectra of 16-epi-smenamide A and natural smenamide A. ... 49
Figure 2.18. Synthesis of ent-smenamide A. ... 50
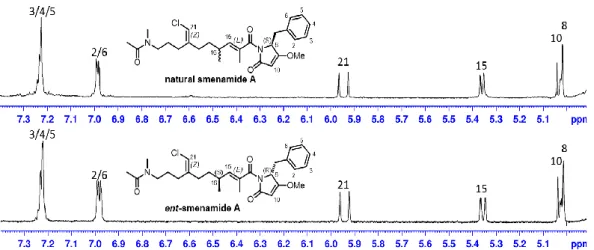
Figure 2.19. 1H NMR spectra of ent-smenamide A and natural smenamide A. ... 50
Figure 2.20. Ozonolysis, hydrolysis and derivatization of smenamide A with l-enantiomer of Marfey’s reagent. ... 52
Figure 2.21. HR-ESI-MS-HPLC analysis of Marfey’s derivative from smenamide
1-fluoro-2,4-Figure 2.22. 1H NMR spectrum of compound 30 (CDCl
3, 400 MHz) ... 78
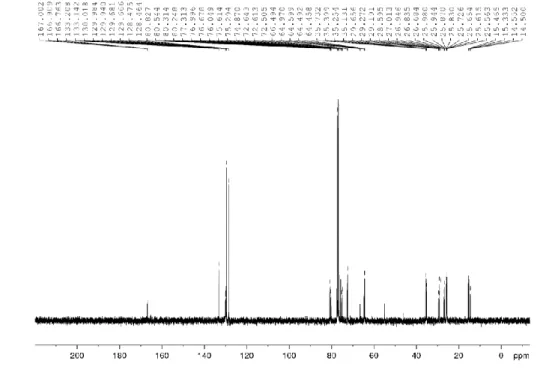
Figure 2.23. 13C NMR spectrum of compound 30 (CDCl
3, 100 MHz) ... 78
Figure 2.24. 1H NMR spectrum of compound 8 (CDCl
3, 400 MHz) ... 79
Figure 2.25. 13C NMR spectrum of compound 8 (CDCl
3, 100 MHz) ... 79
Figure 2.26. 1H NMR spectrum of compound 31 (CDCl
3, 400 MHz) ... 80
Figure 2.27. 13C NMR spectrum of compound 31 (CDCl
3, 100 MHz) ... 80
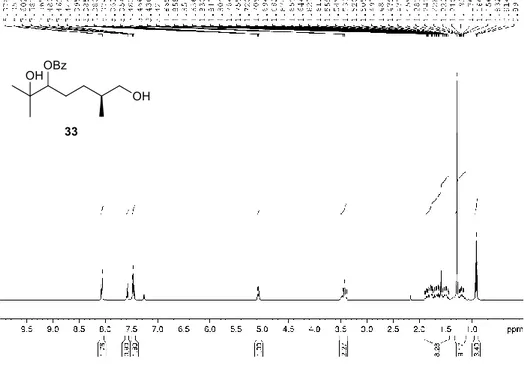
Figure 2.28. 1H NMR spectrum of compound 33 (CDCl
3, 400 MHz) ... 81
Figure 2.29. 13C NMR spectrum of compound 33 (CDCl
3, 100 MHz) ... 81
Figure 2.30. 1H NMR spectrum of compound 9 (CDCl
3, 400 MHz) ... 82
Figure 2.31. 13C NMR spectrum of compound 9 (CDCl
3, 100 MHz) ... 82
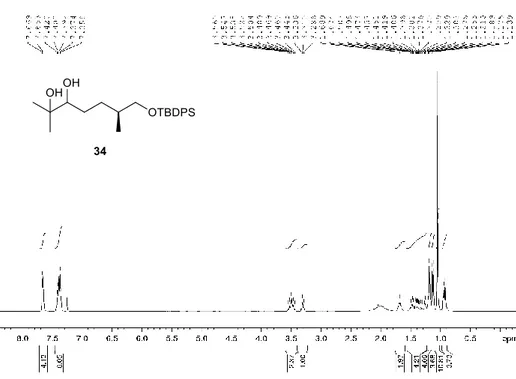
Figure 2.32. 1H NMR spectrum of compound 34 (CDCl
3, 400 MHz) ... 83
Figure 2.33. 13C NMR spectrum of compound 34 (CDCl
3, 100 MHz) ... 83
Figure 2.34. 1H NMR spectrum of compound 10 (CDCl
3, 400 MHz) ... 84
Figure 2.35. 1H NMR spectrum of compound 12 (CDCl
3, 400 MHz) ... 85
Figure 2.36. 13C NMR spectrum of compound 12 (CDCl
3, 100 MHz) ... 85
Figure 2.37. 1H NMR spectrum of compound 5 (CDCl
3, 400 MHz) ... 86
Figure 2.38. 13C NMR spectrum of compound 5 (CDCl
3, 100 MHz) ... 86
Figure 2.39. 1H NMR spectrum of compound 35 (CDCl
3, 400 MHz) ... 87
Figure 2.40. 13C NMR spectrum of compound 35 (CDCl
3, 100 MHz) ... 87
Figure 2.41. 1H NMR spectrum of compound 36 (CDCl
3, 400 MHz) ... 88
Figure 2.42. 13C NMR spectrum of compound 36 (CDCl
3, 100 MHz) ... 88
Figure 2.43. 1H NMR spectrum of compound 13 (CDCl
3, 400 MHz) ... 89
Figure 2.44. 13C NMR spectrum of compound 13 (CDCl
Figure 2.47. 1H NMR spectrum of compound 37 (CDCl
3, 400 MHz) ... 91
Figure 2.48. 13C NMR spectrum of compound 37 (CDCl
3, 100 MHz) ... 91
Figure 2.49. 1H NMR spectrum of compound 15 (CDCl
3, 400 MHz) ... 92
Figure 2.50. 13C NMR spectrum of compound 15 (CDCl
3, 100 MHz) ... 92
Figure 2.51. 1H NMR spectrum of compound 16 (CDCl
3, 400 MHz) ... 93
Figure 2.52. 13C NMR spectrum of compound 16 (CDCl
3, 100 MHz) ... 93 Figure 2.53. 1H NMR spectrum of compound 17 (DMSO, 400 MHz) ... 94 Figure 2.54. 13C NMR spectrum of compound 17 (DMSO, 100 MHz) ... 94
Figure 2.55. 1H NMR spectrum of compound 18 (CDCl
3, 400 MHz) ... 95
Figure 2.56. 1H NMR spectrum of compound 20 (CDCl
3, 400 MHz) ... 96
Figure 2.57. 13C NMR spectrum of compound 20 (CDCl
3, 100 MHz) ... 96
Figure 2.58. 1H NMR spectrum of compound 21 (CDCl
3, 400 MHz) ... 97
Figure 2.59. 13C NMR spectrum of compound 21 (CDCl
3, 100 MHz) ... 97
Figure 2.60. 1H NMR spectrum of compound 22 (CDCl
3, 400 MHz) ... 98
Figure 2.61. 13C NMR spectrum of compound 22 (CDCl
3, 100 MHz) ... 98
Figure 2.62. 1H NMR spectrum of compound 24 (CDCl
3, 400 MHz) ... 99
Figure 2.63. 13C NMR spectrum of compound 24 (CDCl
3, 100 MHz) ... 99
Figure 2.64. 1H NMR spectrum of compound 3 (CDCl
3, 400 MHz) ... 100
Figure 2.65. 1H NMR spectrum of compound 26 (CDCl
3, 400 MHz) ... 100
Figure 2.66. 1H NMR spectrum of compound 4 (CDCl
3, 400 MHz) ... 101
Figure 2.67. 13C NMR spectrum of compound 4 (CDCl
3, 100 MHz) ... 101
Figure 2.68. 1H NMR spectrum of compound 27 (CD
3OD, 500 MHz) ... 102
Figure 2.69. 13C NMR spectrum of compound 27 (CD
Figure 2.72. ECD spectra of natural smenamide A (solid red line) and
ent-smenamide A (29) (dashed blue line). ... 104
CHAPTER 3 ... 108
Figure 3.1. Structures of compounds 7-15. ... 109
Figure 3.2. Preparation of dolapyrrolidinone derivative 8. ... 110
Figure 3.3. Ketone 9 as a versatile intermediate. ... 110
Figure 3.4. Preparation of compounds 9-13. ... 111
Figure 3.5. Preparation of compounds 14 and 15. ... 112
Figure 3.6. 1H NMR spectrum of compound 16 (CDCl 3, 400 MHz). ... 121
Figure 3.7. 1H NMR spectrum of compound 8 (CDCl 3, 400 MHz). ... 122
Figure 3.8. 13C NMR spectrum of compound 8 (CDCl 3, 100 MHz). ... 122
Figure 3.9. 1H NMR spectrum of compound 10 (CDCl 3, 400 MHz). ... 123
Figure 3.10. 13C NMR spectrum of compound 10 (CDCl 3, 100 MHz). ... 123
Figure 3.11. 1H NMR spectrum of compound 11 (CDCl 3, 400 MHz). ... 124
Figure 3.12. 13C NMR spectrum of compound 11 (CDCl 3, 100 MHz). ... 124
Figure 3.13. 1H NMR spectrum of compound 12 (CDCl 3, 400 MHz) ... 125
Figure 3.14. 13C NMR spectrum of compound 12 (CDCl 3, 100 MHz) ... 125
Figure 3.15. 1H NMR spectrum of compound 22 (CDCl 3, 400 MHz). ... 126
Figure 3.16. 13C NMR spectrum of compound 22 (CDCl 3, 100 MHz). ... 126
Figure 3.17. 1H NMR spectrum of compound 14 (CDCl 3, 400 MHz). ... 127
Figure 3.18. 13C NMR spectrum of compound 14 (CDCl 3, 100 MHz). ... 127
Figure 3.19. 1H NMR spectrum of compound 15 (CDCl 3, 400 MHz). ... 128
CHAPTER 4 ... 133 Figure 4.1. Smenospongia aurea and conulosa sponges, respectively. ... 133 Figure 4.2. Structures of smenamide A (1) and B (2), and smenothiazole A (3) and
B (4). ... 134
Figure 4.3. Structures of conulothiazoles A (5) and B (6). ... 135 Figure 4.4. Positive ion mode high-resolution ESI MS spectrum of compound 5.
... 136
Figure 4.5. Positive ion mode high-resolution ESI MS spectrum of compound 6.
... 139
Figure 4.6. The most significant correlations provided by the COSY, HMBC, and
NOESY/ROESY 2D NMR spectra of conulothiazoles A (5) and B (6). ... 141
Figure 4.7. Ozonolysis, hydrolysis and derivatization of conulothiazole A (5) with
L-enantiomer of Marfey’s reagent. ... 142
Figure 4.8. HR-ESI-MS-HPLC analysis of Marfey’s derivatives from
conulothiazole A (5) and B (6). ... 142
Figure 4.9. Structural analogies of Smenospongia metabolites with cyanobacteria
metabolites. ... 143
Figure 4.10. 1H NMR spectrum of conulothiazole A (5) (CD
3OD, 700MHz). .. 151 Figure 4.11. COSY spectrum of conulothiazole A (5) (CD3OD, 700MHz). ... 151
Figure 4.12. NOESY spectrum of conulothiazole A (5) (CD3OD, 700MHz). ... 152
Figure 4.13. HSQC spectrum of conulothiazole A (5) (CD3OD, 700MHz). ... 153 Figure 4.14. HMBC spectrum of conulothiazole A (5) (CD3OD, 700MHz). ... 154
Figure 4.15. 1H NMR spectrum of conulothiazole B (6) (CD
Figure 4.18. HSQC spectrum of conulothiazole B (6) (CD3OD, 700MHz). ... 157
Figure 4.19. HMBC spectrum of conulothiazole B (6) (CD3OD, 700MHz). ... 158
CHAPTER 5 ... 161
Figure 5.1. A specimen of the Mediterranean sponge Geodia cydonium. ... 161
Figure 5.2. Two-dimensional molecular network of the active fraction from the sponge Geodia cydonium. ... 164
Figure 5.3. Cell proliferation. Cell viability rate (CR) related to breast cancer cells: (a) MCF-7; (b) MDA-MB231; and (c) MDA-MB468, after treatment with fraction 3 for 24 (blue line) and 48 (red line) hours. ... 168
Figure 5.4. RT-qPCR analysis: mRNA fold changes were evaluated as ratios between the expression levels of five genes in three breast cancer cell lines, MCF-7, MDA-MB231 and MDA-MB468, after treatment with the active fraction compared to the control (untreated cells). ... 170
Figure 5.5. OPLS-DA plot. (a) OPLS-DA and variable importance in projection (VIP) analysis where the metabolites increased or decreased in the endo-metabolome of (b) MCF-7, (c) MDA-MB231 and (d) MDA-MB468 cells after treatment with the active fraction from the sponge Geodia cydonium, compared to untreated cells. ... 172
Figure 5.6. Cytokine levels in breast cancer cells. Scheme reporting the cytokines modulated by the active fraction obtained from the sponge Geodia cydonium. ... 173
CHAPTER 2 ... 28
Table 2.1. NMR data of natural smenamide A and ent-smenamide A. ... 105
CHAPTER 4 ... 133
Table 4.1. NMR data of conulothiazole A (5) (700 MHz, CD3OD. ... 138
Table 4.2. NMR data of conulothiazole B (6) (700 MHz, CD3OD). ... 140
CHAPTER 5 ... 161
Table 5.1. Apoptosis. Percentage of live, apoptotic and dead cells expressed as mean ± standard deviation by the Muse Annexin V and Dead Cell assay in MCF-7, MDA-MB231 and MDA-MB468 cells at IC50 concentration after 48h of treatment. Untreated cells were used as the control. ... 169
Table 5.2. Cell percentages in the different cell cycle phases (G0/G1, S, G2 and M) expressed as mean ± standard deviation after Muse Cell cycle assay in MCF-7, MDA-MB231 and MDA-MB468 cells at IC50 concentration after 48h of treatment. Untreated cells were used as the control. ... 170
Among marine organism, Porifera have proven to be a rich source of new metabolites. Sponge are sessile organisms, therefore lacking any physical defence against predators. To make up to this lack, they produce species-specific molecules, known as secondary metabolites, which may play a key role in interspecific competition, defense against predators and reproduction processes. Secondary metabolites of marine origins are interesting molecules, often characterised by complex and unusual structures, which have shown to have a broad spectrum of pharmacological activities, such as anti-inflammatory, antiviral, antibiotic and anticancer. These compounds are hence considered promising lead compounds in drug discovery. Recently, many marine natural products have been approved, and others are in clinical trials. Due to the small amount isolated from the marine source, the evaluation of the biological activity of these compounds is often limited. Many alternatives have been considered to solve this issue. The total or semi-synthesis of these compound represents a valide alternative to provide greater amounts of the metabolites of interest, allowing to gain a better insight in their biological activity. Currently, the number of synthetic or semi-synthetic drugs is indeed strongly increasing.
This research field forms the backdrop to my PhD work, aimed to the identification and structural elucidation of new bioactive marine natural products and to the synthesis of analogues with improved biological activities. The main topic of my reseach activity was the total synthesis of hybrid peptide/polyketide compounds of marine origins. Simultaneously, I was involved in the analysis of the chemical
content of the Caribbean sponge Smenospongia conulosa and the Mediterranean sponge Geodia cydonium.
The analysis of the lipofilic extract of the Caribbean sponge S. aurea led to the isolation, in 2013, of two hybrid peptide/polyketide compounds: smenamide A and B. Although both compounds possess a cytotoxic activity at nanomolar levels, smenamide A resulted more active blocking the cell proliferation through a pro-aapoptotic mechanism. Therefore the total synthesis of smenamide A and its analogues was undertaken in order to provide greater amount of the compounds needed to confirm the structure of the compound, determine the absolute configuration at C-16, that remained undetermined until the end of the synthetic project, and to further investigate the cytotoxic activity. The total synthesis resulted in the preparation of 16-epi- and ent-smenamide A, two synthetic analogues of smenamide A.
In order to investigate the role of the structural determining-features of smenamides family, eight shorter-chain analogues of the synthetic 16-epi-smenamide A have been designed and prepared. The evaluation of the antiproliferative activity of
16-epi-smenamide A, together with its analogues, is now in progress.
On the other hand, the analysis of the organic extracts of the Caribbean sponge
Smenospongia conulosa and the Mediterranean sponge Geodia cydonium led to the
identification of two new hybrid peptide/polyketide compounds, conulothiazole A and B, and an active fraction, respectively.
The evaluation of the biological activity of conulothiazoles could not be carried out because of the low amount isolated from the marine source.
As for G. cydonium active fraction, it showed an antiproliferative activity on three humar cancer breast cell lines (MCF-7, MDA-MB-231 and MDA-MB-468). The
use of LC-HRMS, LC-HRMS/MS coupled with a bioinformatic techniques, e.g. Molecular Networking, as a novel dereplication strategy allowed to identify most of the metabolites contained in this fraction. In addition, the evaluation of the metabolomic profiling and the cytokine levels of the three cancer cell lines after treatment with the active fraction showed that the latter participates in the modulation of several metabolites in pro- or anti-tumor processes. Further studies are necessary in order to understand the mechanism of action of each compound contained in this fraction, as well as the evaluation of the possible synergistic effect of a pool of compounds.
INTRODUCTION
Since the dawn of time natural products have been used as a remedy to relieve their pains. The first humans nourished themselves not only with meat, but also roots, berries, herbs and wild fruits. By eating them, they accidentally discovered their healing benefits. Ancient apothecaries learned several techniques in order to prepare, store and make use of medicinal herbs. They used them as a panacea, only basing their uses on empirical evidences.
Extremely relevant is the example of aloe species, widely described by the Greek physician Dioscoride, in his play De materia medica. Among the remarkable benefits of these plants, it is possible to cite: healing of plagues and wounds, protection and relief towards burns, itching and cutaneous inflammation. In addition, it is worth to mention nettle, also known as "green gold", which is a potent anti-inflammatory, stimulator of microcirculation, with antiseptic and elasticising properties especially when used in combination with olive oil.
However, it is only in eighteenth century that, through the manipulation of the organic extracts from natural sources, scientists isolated the first chemical pure compounds. With the introduction of new isolation and purification techniques an increasing number of these compounds have been identified, prompting researchers to study cells and organisms from which they derive from, identifying similarities and differences.
Primary metabolism is the ensemble of chemical reactions by which some substances, known as primary metabolites, are produced. Carbohydrates, amino acids, nucleic acids and fatty acids are primary metabolites. They are essential for cell survival. Secondary metabolites, on the other hand, regulate other functions and
they vary from species to species. They are part of specialised characteristics of a cell, and participate in interspecific competition, defense against predators and promotion of reproduction processes.
Secondary metabolites are characterised by peculiar and complex structure, which brings about several different biological activities.
Currently, about 42% of compounds used in therapy are natural substances or their derivatives. Among them, it is worth to cite some molecules with anti-inflammatory (e.g. acetylsalicylic acid), bronchodilator (e.g ephedrine), cardiotonic (e.g digoxin and digitoxin) and anticancer (e.g vincristine, vinblastine, taxol) activities. Therefore, modern pharmaceutical discovery programs owe much to natural products. Pharmaceutical companies are always looking for new drugs for the treatment of life-threatening diseases, in particular cancer. Despite the cancer death rate has significantly dropped since 1991,1 cancer still is the leading cause of death
in 21 States. In particular, because of the increasing of drug resistance against common anticancer therapies, new chemotherapeutic agents are urgently required. Moreover, the incidence of new types of cancer, such as glioblastoma, increases rapidly2. In the latest 50 years, thanks to advances in technologies (in particular
scuba diving) researchers have quickly turned their attention to the marine environment, thus beginning the “blue chemistry Age". Marine natural products (MNPs)3 are interesting molecules characterised by complex and unusual molecular
skeletons, as well as a great structural diversity. Due to the greater genetic heterogeneity of marine organisms, this structural variability results in a variety of biological activities.
As reported recently,3 a wide range of molecules with cytotoxic, antimicrobial and
antiviral activities have been isolated. Therefore, MNPs are largely recognized as one of the most prolific source of therapeutics.
From a practical point of view, there are many problems concerning the isolation of new MNPs. The main difficulty of developing drugs from a marine source resides in the sustainable supply from the natural source.4
For instance, Porifera and Tunicates, source of many bioactive compounds, are sessile organisms, the collection of which can only be performed by hand using scuba diving or with the aid of submarines equipped with robotic arms. In addition, the chemical composition of organic extracts can deeply vary within samples of the same species when collected in different places or at different moments. Moreover, due to the exiguous amounts of these compounds isolated from the marine source, the study of their biological activity is more complicated. Nevertheless, the interest for this kind of molecules remains high, pushing the researchers to find solutions for the supply. Among the alternatives, of great importance are aquaculture (massive growth of the organisms in a controlled area) and production of metabolites of interest through cell cultures. Recent studies have shown that secondary metabolites are often produced by the microbial symbionts of the sponges.5 Since the microbial fauna is largely unculturable, chemical synthesis
represents a valid alternative.
Organic synthesists aim to the construction of natural or designed molecules whose primary element is carbon with the purpose of synthetising in the laboratory natural products occurring from the living world.6 Organic synthesis sinks its roots in 1828,
when German chemist Friedrich Wöhler performed the serendipitous synthesis of urea from ammonium isocyanate.7
Chemical synthesis is fundamental to provide larger quantities of the desired natural compound needed to further investigate its biological activity. Several to hundred grams are instead required for preclinical and clinical development of a drug. Synthesis is also extremely useful to determine the absolute stereochemistry of stereogenic centers when this cannot be achieved by spectroscopical tools or derivatization methods such as Marfey’s method.8 Moreover, synthetic analogues
can be prepared in order to perform SAR (structure–activity relationship) studies aiming to improve the bioactivity and reduce the toxic side effects.
Although most of the drugs currently approved are natural products, the number of synthetic or semi-synthetic drugs is increasing thanks to their production cost, time effectiveness and easy quality control.
Among drugs of marine origins currently produced via synthesis, it is worth to mention Trabectedin (Yondelis®), a tetrahydroisoquinoline alkaloid isolated from
the Caribbean tunicate Ecteinascidia turbinata.9 It has been approved as
anti-neoplastic drug for the treatment of soft tissue sarcoma and, in combination with pegylated liposomal doxorubicin, for patients with platinum-refractory ovarian cancer. Trabectedin is now produced synthetically.
Ziconotide (Prialt®) is a synthetic non-opioid analgesic drug, equivalent of the
25-amino acid peptide -conotoxin MVIIA, originally isolated from the venom of the marine snail Conus magus.10 It is used in symptomatic management of severe
chronic pain in patients with cancer or AIDS, for whom intrathecal (IT) therapy is warranted, and who are intolerant of or refractory to treatment with morphine and systemic analgesics.
Brentuximab vedotin (ADCETRIS®)11 is a cysteine-linked antibody-drug conjugate
recombinant DNA technology), is covalently linked to the monomethylauristatin E (MMAE). The latter is a semi-synthetic analogue of the marine cytotoxic peptide dolastatin-10, isolated from the mollusk Dolabella auricularia. ADCETRIS® is actually used in the treatment of Hodgkin’s lymphoma (HL) and systemic anaplastic large cell lymphoma (ALCL).
The present research project is focused on the study of Caribbean and Mediterranean marine sponges in order to discover novel anticancer lead molecules and to design and prepare their synthetic or semi-synthetic analogues.
More precisely, during my PhD I was involved in the study of the chemical composition of the organic extracts of the Caribbean sponges Smenospongia aurea and conulosa and the Mediterranean sponge Geodia cydonium.
Four hybrid polyketide/peptide (PKS/NRPS) compounds have been previously isolated by our group from the organic extract of S. aurea.12,13 Among these
compounds, smenamide A showed a potent cytotoxic activity at nanomolar concentrations on a non-small-cell lung cancer (NSCLC) cell line, known as Calu-1. As part of my PhD project, a strategy to prepare synthetic derivatives has been set up. The stereoselective total synthesis resulted in the preparation of two analogues of smenamide A: 16-epi- and ent-smenamide A.14
A different approach was instead used for the study of the chemical content of the Mediterranean sponge G. cydonium. A bioguided fractionation of the cytotoxic organic extract of the sponge was performed. This procedure allowed the identification of one antiproliferative fraction acting with an apoptotic mechanism against MCF-7, MDA-MB231, and MDA-MB468 breast cancer cell lines.15
used as control. Such a result opens up the possibility of using this fraction for therapeutic purposes.
The results obtained during my PhD have been divided in two sections:
The main project of my research activity, which resulted in the total synthesis of 16-epi- and ent-smenamide A, two new hybrid PKS/NRPS compounds.
Simultaneously, I analysed the chemical composition of two marine sponges, S. conulosa and G. cydonium.
The results achieved during my Ph.D. have been reported in four publications on peer-rewied journals.
1. A. Caso, A. Mangoni, G. Piccialli, V. Costantino, and V. Piccialli, Studies toward the Synthesis of Smenamide A, an Antiproliferative Metabolite from Smenospongia aurea: Total Synthesis of ent-Smenamide A and 16-epi-Smenamide A, ACS Omega, 2017, 2(4), 1477–1488. Impact Factor: * 2. G. Esposito, G. Della Sala, R. Teta, A. Caso, M.L. Bouguet-Kondracki, J.R.
Pawlik, A. Mangoni, V. Costantino, Chlorinated thiazole containing polyketide-peptides from the Caribbean sponge Smenospongia conulosa: structure elucidation on microgram scale. Eur. J. Org. Chem. 2016, 16, 2871–2875. Impact Factor:2.834 (2016).
3. S. Costantini, E. Guerriero, R. Teta, F. Capone, Caso, A. Sorice, G. Romano, A. Ianora, N. Ruocco, A. Budillon, V. Costantino, M. Costantini, Evaluating the effects of an organic extract from the mediterranean sponge
Geodia cydonium on human breast cancer cell lines, Int J Mol Sci.,2017,
18(10). pii: E2112. Impact Factor:3.226 (2016).
4. A. Caso, I. Laurenzana, D. Lamorte, S. Trino, G. Esposito, V. Piccialli , and V. Costantino, Smenamide-A-analogues: a case-example of the application of the functional-analogues strategy to design and study complex natural lead compounds, Mar. Drugs, 2018, accepted. Impact Factor:3.503 (2016).
* The first volume of this paper was published in December 2015. The value of its impact factor has not yet been disclosed.
References
1 R. L. Siegel, K. D. Miller, A. Jemal, CA Cancer J Clin, 2016, 66 (1), 7-30.
2 J. W. Blunt, B.R. Copp, R. A. Keyzers, M. H. G. Munro, M.R. Prinsep, Nat. Prod. Rep., 2016, 33, 382-431.
3 K. von Schwarzenberg and A.M. Vollmar, Cancer Letters ,2013, 332, 295–303.
4 T. F. Molinski, D. S. Dalisay, S. L. Lievens and J. P. Saludes, Nature Reviews Drug Discovery,
2009, 8, 69-85.
5(a) Unson, M. D.; Holland, N. D.; Faulkner, D. J. Mar. Biol. 1994, 119, 1-11. (b) Hentschel,
U.; Hopke, J.; Horn, M.; Friedrich, A.B.; Wagner, M., Moore, B.S. Appl. Environ. Microbiol. 2002, 68, 4431-4440.
6 K. C. Nicolaou, Proc. R. Soc., 2014, A 470: 20130690. 7 F. Wöhler, Poggendorff’s Ann, Phys. Chem, 1828, 12, 253. 8 P. Marfey, Carlsberg Res. Commun. 1984, 49, 591−596.
9 (a) K.L. Rinehart et al., J. Org. Chem., 1991, 56, 1676; (b) A. E. Wright et al., J. Org. Chem.
1990, 55, 4508–4512.
10 B. M. Olivera, Drugs from the Sea (Fusetani, N., ed.), Basel, Karger, 2000, pp 74-85. 11 L. N. Tumey, Han, Sean, Current Topics in Medicinal Chemistry, 2017, 17, 32, 3444-3462. 12 R. Teta, E. Irollo, G. Della Sala, G. Pirozzi, A. Mangoni, V. Costantino, Marine Drugs, 2013, 11
(11), 4451-4463.
13 Esposito G., Teta R., Miceli R., Ceccarelli L., Della Sala G., Camerlingo R., Irollo E., Mangoni
A., Pirozzi G., Costantino V., Mar. Drugs 2015, 13, 444-459.
14 A. Caso, A. Mangoni, G. Piccialli, V. Costantino, V.Piccialli, ACS Omega, 2017, 2, 1477−1488. 15 S. Costantini, E. Guerriero, R. Teta, F. Capone,A. Caso, A. Sorice,G. Romano, A. Ianora, N.
Ruocco, A. Budillon,V. Costantino,M. Costantini, Int J Mol Sci., 2017, 18(10). pii: E2112.
Chapter 1
Structural elucidation techniques
Before the introduction of spectroscopy, structural determination of new chemical compounds was carried out through degradative methods and/or derivatisation of functional groups. The main problem of degradative techniques is the total loss of the sample. As regards derivatisation methods, these can change sample composition, may not be quantitative or give by-products, and reduce amount of the analyte. Considering that natural products are often isolated in very exiguous amounts, these techniques are evidently unsuitable for structural elucidation of micrograms of compounds.
The introduction of highly sensitive and non-degradative methodologies marks a turning point in the field of structural determination, allowing the elucidation of submilligrams samples.
Structural elucidation of each molecule described in thesis has been accomplished through spectroscopic techniques, mostly NMR spectroscopy and mass spectrometry (MS), but also IR and CD spectroscopy. The absolute stereochemistry of amino acids has been established by using Marfey’s method. The specific rotation of each chiral compound has been determined by measuring the optical rotation at the sodium D line (589 nm).
1.1 Nuclear Magnetic Resonance
Nuclear Magnetic Resonance (NMR) spectroscopy is a powerful, high sensitive and non-destructive analytical tool used for the identification of the
carbon-hydrogen framework of an organic compound. It allows structure elucidation, qualitative and quantitative analysis of single molecules or mixtures of compounds. NMR experiments involve the nuclei of atoms: the chemical environment of a specific nucleus is determined getting information about that nucleus. When the sample is placed in a magnetic field, it is excited by radio waves. Therefore, the nuclei get into nuclear magnetic resonance, and it is detected with sensitive detectors (Figure 1).
Figure 1.1. Scheme of a NMR spectrometer.
Subatomic particles (protons, neutrons and electrons) can be imagined as spinning around their axes. In some cases, these spins are paired against each other and the nucleus of the atom has no overall spin. However, in some atoms (such as 1H
and 13C) the nucleus has an overall spin.
The rules for determining the net spin of a nucleus are the following:
1. If the number of neutrons and the number of protons are both even, then the nucleus has NO spin.
2. If the number of neutrons plus the number of protons is odd, then the nucleus has a half-integer spin (i.e. 1/2, 3/2, 5/2)
3. If the number of neutrons and the number of protons are both odd, then the nucleus has an integer spin (i.e. 1, 2, 3)
Therefore, what is important is the overall spin, I. Particularly useful isotopes are 1H, 13C, 19F and 31P, all of which have spin I = 1/2.
A spinning charge generates a magnetic field (Figure 2). The resulting spin-magnet has a magnetic moment (μ) proportional to the spin.
Figure 1.2. A spinning charged particule generate a magnetic field.
Since spin I has have 2I + 1 possible orientations, a nucleus with spin 1/2 will have 2 possible orientations. In the absence of an external magnetic field, these orientations are of equal energy. When a magnetic field is applied, these nuclei align themselves with or against the magnetic field (Bo) and the energy levels split. Each
level is characterized by a magnetic quantum number, m (Figure 1.3).
Figure 1.3. Spin energy states.
In particular, irradiation with electromagnetic radiation allow the low energy state to flip over to the high-energy state. The difference in energy between the two spin states is dependent on the external magnetic field strength, and is always very small. The stronger is the magnetic field (Bo), the larger is the difference in energy
of the two energy states. For nuclei with spin 1/2 the energy difference between the two spin states at a given magnetic field strength is proportional to their magnetic moments.
When the radiation cease, a free induction decay (FID) is produced because of the nuclei relaxation. The FID is transformed through the Fourier transform to give the peaks of the NMR spectrum. The Fourier transform is a mathematic transformation that allows to write a time-dependent function in the frequency domain.
The use of mono and two-dimensional NMR experiments represented a fundamental tool for the structural determination of each compound described in this thesis.
1.1.1 One-dimensional NMR experiments
A single nucleus is analysed in a one-dimensional NMR esperiment. In a 1D NMR spectrum the intensity is expressed as a function of the frequency. It is a two-dimesional chart but it is defined as one-dimensional because it involves only one dimension “frequency”.
The most common one-dimensional NMR experiments concern 1H and 13C.
As for 1H spectra, since protons all have the same magnetic moment we might
expect no difference in their resonance signals. Fortunately, they behave differently in the NMR experiment. This phenomenon can be explained by electrons shelding. Electrons are indeed charged particles, hence they response to the external magnetic field (Bo) generating a secondary field. The latter, opposing to Bo, shields the
nucleus from the applied magnetic field. Therefore, to achieve resonance and then absorption of rf energy, Bo must be increased.
Based on its chemical environment, each proton resonates at a specific chemical shift (expressed in parts per million, ppm). This means that it is differently located in the proton spectrum.
Although the 1H NMR spectroscopy is a powerful tool in the field of structural
determination, it can not provide information for those molecules composed by big portions lacking carbon-hydrogen bonds.
13C NMR experiments can provide the missing information. It is worth noting that 13C isotope is only 1.1% abundant and the nucleus is fifty-fold less sensitive than a
proton in a NMR experiment. For these reasons high concentrated samples are required. Moreover, the spectra are complicated by the large one-bond coupling between and 1H.Protons bonded to a 13C atom split its NMR signals from 130 to
270 Hz, further complicating the spectrum. The issue has been solved thanks to the use of the high-field pulse technology in combination with broad-band heteronuclear decoupling of all protons. Several acquisitions are accumulated in each experiment in order to provide a stronger signal. Also, thanks to the decoupling irradiation the sensitivity of carbon nuclei bonded to protons is enhanced.
1.1.2 Two-dimensional NMR experiments
In addition to 1D experiments, two-dimensional experiments have been recorded and analysed in order to complete the resonance assignment of each molecule. A two-dimensional NMR spectrum is a three-dimensional chart in which two frequencies are expressed as function of the intensity.
Considering that, in a NMR experiment, frequencies derive from the Fourier transformation of a time-dependent function, the simultaneous acquisition of two temporal functions is required to obtain a 2D spectrum.
Although the nuclei resonate in crowded regions of the spectra, a remarkably easier interpretation characterises 2D spectra (signals’ superimposition is much less frequent in two dimensions than in one). Their easier interpretation and shorter acquisition times make 2D experiments superior than the one-dimensionals. Two kinds of two-dimensional experiments can be mentioned: homonuclear and heteronuclear experiments. A 2D experiment is defined as homonuclear if the two frequencies refer to the same nucleus. Vice versa, in a heteronuclear experiment the correlation peaks between two different nuclei are observed.
The COSY (Correlation SpettroscopY) experiment was the first two-dimensional NMR experiment invented. It is simple and still widely used today in its various versions (COSY, DQF-COSY, COSY-b, COSY-90). The analysis of a COSY spectrum provides information about homonuclear correlations of protons between them to 2 or 3 bonds (scalar spin-spin coupling).
The HSQC (Heteronuclear Single Quantum Coherence)1 experiment is a 2D
heteronuclear correlation experiment detecting correlation peaks between 13C and 1H nuclei directly bonded each other through the direct coupling constant 1J C-H.
The HMBC (Heteronuclear Multiple Bond Correlation)2 experiment is a long-range
heteronuclear experiment acquired in reverse detection. In a HMBC spectrum correlations between 1H and 13C through two (2JCH) or three bonds (3JCH) are
visible. This experiment allows the identification of the correlations between quaternary carbons (not visible in the HSQC spectrum) with protons close to them.
However, not all of the correlation peaks expected from the structure of a molecule are present in many HMBC spectra. Since 2,3JCH can very different to each other,
the optimization of the experiment for each type of coupling is required.
1.2. Methods for the determination of relative/absolute configurations
Since most of the natural compounds have one or more chiral centers, the determination of their relative and absolute configuration is fundamental for their structural characterization. The knowledge of the stereochemistry of a molecule allows to trace back to its three-dimensional structure and its role in the interaction with the biological systems, e.g. the SAR studies of synthetic molecules which are designed and prepared in order to improve the drug-receptor interaction and, then, their biological activity in comparison with the natural lead compounds.
The determination of the relative configuration of the chiral centers can be achieved evaluating NMR data such as the values of chemical shifts (δ), coupling constants (J) and NOE effects.
The chemical environment of a proton influences its chemical shift, hence protons of two diastereomers show different values.
Many information about the relative stereochemistry of an organic molecule can be obtained studying the coupling constants values (JH-H). The application of Karplus
law The application of Karplus law allows to calculate both homonuclear, 3JH-H,
and heteronuclear, 3JC-H constants values. These values depend on the dihedral
angle θ between the coupled atoms.3 When θ is approximately 90°, the 3J
H-H values
are very small, about 0-1.5 Hz, whereas the values increase considerably when θ is between 0° or 180°. In addition, the axial-axial relationship between two protons of a six terms cycle (3J
axial-equatorial (3J
a-e ~ 5-8 Hz) and the equatorial-equatorial (3Je-e ~ 2.5 Hz). As a
consequence, the cis-trans relationship between the protons of a double bond (3J cis
~ 6-12 Hz, 3J
trans ~ 14-20 Hz) can be determined.
Moreover, the study of homonuclear couplings between neighboring protons (dipolar couplings) can provide further information about the relative configuration of a chiral center. Dipolar coupling involves nuclei which are close in space, and not coupled through bonds, as in scalar coupling.
Exploiting the dipolar coupling, the spatial relationship between the substituents of a molecule can be established through the evaluation of the NOE effect (Nuclear Overhauser Enchancements)4.
When a proton HA, nearby located to another, HB, undergo irradiation, a variation
of the signal intensity of HB can be observed. This phenomenon is known as NOE
effect. Generally, an increasing of the signal intensity (positive NOE) is observed for small organic molecules, while a decreasing is observed for macromolecules (negative NOE). Since the increase in intensity is small, normally the NOE is measured using the difference spectra (NOE difference): two spectra are recorded with and without irradiation. In the difference spectrum, deriving from the two original spectra, only the protons showing NOE effect, can be detected.
Since this experiment involves a pair of protons at a time, nowadays it is often replaced by a single two-dimensional experiment, called NOESY (Nuclear Overhauser Effect SpectroscopY). The latter is a 2D NMR homonuclear correlation experiment which is able to provide information about dipolar couplings of each of the pairs of protons of the molecule at the same time. It shows the presence of a NOE effect between two protons, suggesting hence that they are close in space.
In addition to NOESY, the ROESY (Rotating-frame Overhauser SpectroscopY) experiment can be performed: it detects the ROE effect. Since the latter is related to dipolar coupling between nuclei, and depends on the geometric distance between the nuclei, it is similar to NOE. But while NOE effect can be positive or negative, depending on the size of the molecules, ROE effect is always positive. For this reason, the ROESY experiment is particularly useful in the analysis of medium-sized molecules, which would show a NOE effect close to zero.
1.3 Mass spectrometry
Mass spectrometry (MS) is a powerful analytical technique used to identify unknown compounds, elucidate their structure and chemical properties, and also to quantify known materials within a sample.
The principle underlying a MS experiment is the conversion of a sample into gaseous ions, each of which is characterised by a specific mass-to-charge ratio (m/z ratio) and relative abundance. The ions that arise from the ionisation process are then separated on the basis of their m/z ratio and revealed by a detector.
A molecule is converted in ions losing an electron: a radical cation is formed (molecule ion). The latter is subjected to fragmentation giving in part molecules and/or neutral radicals (not detected by the instrument), and in part cations and/or cations radicals (fragment ions).
The ionisation of the sample is then the key step of the whole experiment. The sam0ple, which can be solid, liquid or gaseous, is introduced into a vacuum chamber through an appropriate introduction system. The molecules may already exist in solution as ions, or they can undergo ionization in situ after volatilization or by other methods in the ion source. According to their m/z ratio, the gaseous ions
obtained are separated in the analyzer and collected by the detector. An electrical signal, proportional to the number of ions present, is generated. It is recorded as a function of the m/z ratio by the data processing system records and converted into the mass spectrum.
As result of the experiment a graph, named as mass spectrum, is obtained in which is the representation of the relative abundance of the ions according to their m/z ratio.
Mass spectrometry is a high sensitive tool allowing the determination of the molecular mass of compound and its molecular formula, even if only sub-milligrams of the molecule are available.
A mass spectrometer is composed by an ion source, (in which the sample is ionized), a mass analyser (where ions are separated on the basis of their m/z ratio) and a detector. Many types of ion sources, mass analysers and detectors exist. Hereinafter only the methods used for the realisation of this thesis work will be described.
Each molecule described in this thesis have been analyzed by ESI (Electrospray
Ionization) mass spectrometry (Figure 1.4) through an Orbitrap system.
A solution of the sample, dissolved in a polar and volatile solvent such as H2O,
CH3OH and CH3CN, is nebulized at atmospheric pressure inside the ionization
chamber through a needle held at high electrical potential.
Therefore, a spray of droplets is formed. The droplets are positively charged because of the presence of an electric field. Once the ions are created, it is the role of the “ion lens” (which consists of a capillary maintained under vacuum and in a negative potential) to extract ions from the source efficiently and focus them as they pass through the mass spectrometer accelerating them towards the analyser.
It is worth to mention a kind of mass spectrometry known as tandem mass (MS/MS) spectrometry. During or after ionization, the molecules may indeed undergo fragmentation. If the fragmentation does not occur spontaneously, this can be induced letting the ions to collide with gas molecules. Since each molecule has a specific fragmentation pattern, the analysis of the fragments provides information about its the structure. In this case, a second analyzer is used to measure the mass of the fragments.
In some cases, the formation of multiple-charged ions can be observed. This happens for molecules with high molecular weight such as proteins. The formation of multiple-charged ions facilitates the analysis of this kind of molecules because the m/z ratio of the ions is reduced, and therefore easier to measure.
The mass spectrometer used for the experiments performed in this project was equipped with an Orbitrap analyzer, a new type of mass analyzer introduced by Makarov.5 The LTQ Orbitrap XL™ Hybrid Ion Trap-Orbitrap Mass Spectrometer
is a Fourier Transform Mass Spectrometer (FTMS) in which the most advanced Ion Trap and Fourier Transform technologies are combined.
Figure 1.5. Ion trajectories in an Orbitrap mass spectrometer.
In a Orbitrap analyzer (Figure 1.5) a central electrode, and a pair of bell-shaped external electrodes which surrounded it, generate electric fields in order to capture and confine the ions. The ions orbit around the central electrode and oscillate back and forth down the center axis with periodic motion. Through a Fast Fourier Transformation (FFT), the device receives the frequencies of these axial oscillations and, therefore, the m/z relations of the ions.
1.4. Infrared Spectroscopy
Infrared spectroscopy is a conservative analytical technique based on the interaction between the matter and the infrared light. The most interesting region of IR radiations have a wavelength range from 4000 and 400 cm-1. However, near
(14290-4000 cm-1)and far (700-200 cm-1)infrared regions are also considered
suitable to contribute to the determination of the structure of a molecule.
As a consequence of the hitting of a molecule by IR radiations, an absorption of energy, converted in vibrational energy, is observed. Therefore, such a technique can be defined as a vibrational spectroscopy.
Molecular vibrations can be classified in fundamental and non-fundamental. Two kinds of fundamental vibration can essentially be observed in a molecule: stretching and bending vibrations. The stretching vibration involves the continuous change, in terms of interatomic distance, along the axis of the bond between two atoms. The bending vibration concerns indeed the variation of the angle between two bonds. Stretching vibrations can be symmetric and asymmetric, whereas four different bending vibrations can be observed: scissoring and rocking (in-plane bendings), wagging and twisting (out of the plane bendings).
Non-fundamental vibrations appears as a consequence of fundamental vibrations. Generally, IR spectroscopy is not sufficient to reveal the structure of a molecule, but it can provide useful information to be used in combination with other spectroscopic data. Although the IR spectrum is characteristic of each molecule, certain functional groups show typical bands in specific regions of the spectrum, independently from the whole structure of the molecule.
The infrared spectrum is a graph in which the absorption bands of the functional groups are represented as a function of the wavelength.
1.5. Circular Dichroism
Circular dichroism (CD) is the physical phenomenon whereby a chiral molecule can differently absorb both components, left- and right-handed, of circularly polarised light at a given wavelength. Circular dichroism ΔA is then the difference in terms of absorbance of the left (AL) and right (AR) circularly polarised light:
ΔA = AL - AR
CD spectroscopy is a spectroscopic technique, which measures the CD of the molecules over a range of wavelengths. It is widely used to determine the
three-dimensional structure of chiral organic molecules of all types and sizes, but mostly of macromolecules such as proteins. Such a technique can provide information about absolute configurations, conformations, reaction mechanisms, etc.
The presence of at least one chromophore in the structure of the molecule is required to observe a differential absorbance. If the molecule does not have a chromophore, this can be introduced through derivatisation methods.
A CD spectrum is a graph in which circular dichroism (ΔA) is represented as a function of wavelength. A circular dichroism signal can be positive or negative.
Since asymmetric electromagnetic radiations are used, CD spectroscopy can distinguish between enantiomers. The CD of pure enantiomers differs in sign, but not in magnitude. Any relation between the absolute configuration of an enantiomer and the sign of its electronic circular dichroism (ECD) can be established: CD depends on details of the electronic and geometric molecular structure. However, nowadays the ECD can be predicted through electronic structure calculations allowing the assignment of the absolute configuration by simply comparison of experimental and computed CD spectra.
1.6. Marfey’s Method
Marfey’s method6 is one of the most used analytical approaches for determining the
regiochemistry of enantiomeric amino acid residues in natural products. This is a derivative method, whereby the natural compound undergo acid hydrolysis to deliver the amino acid residues, the configuration of which is undetermined. The amino acid residues are then derivatised with a chiral reactive, the 1-fluoro-2,4-dinitrophenyl-5-L-alaninammide (L-FDAA) (Figure 1.6) and analysed by LC-MS analysis. The LC-MS retention times of the derivatised amino acids deriving from
the peptide are compared with retention times of the corresponding standards D and L amino acid derivatised with the same reagent.
When the standard amino acids are commercially available, the analysis is quite easy and consists of the following steps:
Hydrolysis of the peptide with 6N HCl
Derivatization of hydrolysed amino acids with L-FDAA
Derivatization of both D and L standards amino acids with L-FDAA. If the steric D series standard is not commercially available, or is too expensive, the L-aminoacid under study can be derivatised with L and D-FDAA.
LC/MS analysis of derivatised samples and comparison of respective retention times.
Figure 1.6. L-FDAA structure.
For non-proteinogenic amino acids, for which the corresponding commercially standards are not available, a modified Marfey’s method, known as "Method of Marfey Advanced", has been set up.7
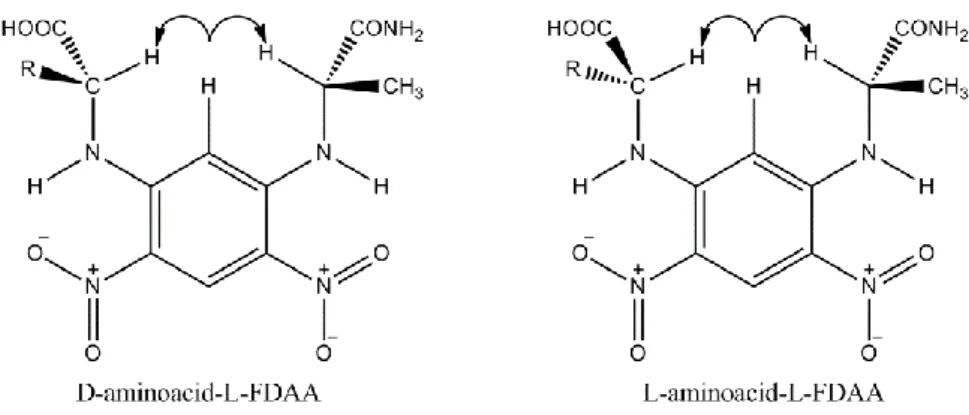
This method, based on the elution order of the L-FDAA-amino acids, was tested on a series of proteinogenic and non-proteinogenic amino acids showing that the L-FDAA-L-amino acid is almost invariably eluted through a C18 column before its corresponding L-FDAA-D-enantiomer.
Several NMR and UV measurements allowed to understand the mechanism of elution of the L-FDAA-derivatised amino acids of L and D steric series through a C18 column.
The more hydrophobic substituents present at the α-carbon of non-proteinogenic amino acids were observed to form cis or trans rearrangements with the substituent at the α-carbon of L-FDAA. For D-(amino acid)-L-FDAA stereoisomers essentially
cis rearrangements have been observed. This makes them more hydrophobic and
then strongly retained by the C18 phase. They show indeed greater retention times compared to the less hydrophobic L-(aminoacid)-L-FDAA stereoisomers, which are preferentially involved in trans type rearrangements (Figure 1.7).
Figure 1.7. Plausible conformations of the L- and D-amminoacids derivatives during separation by Marfey’s method.
This method, overcoming the limits of Marfey’s method, allowed to establish the configuration at α-carbon of unconventional amino acids.
In conclusion, the configuration of a non-proteinogenic amino acid can be determined as described below:
An aliquot of amino acid is derivatised with L-FDAA An aliquot of amino acid is derivatised with D-FDAA Analysis of the LC/MS retention times.
1.7 Conclusion
In this chapter, the main techniques used for the structural determination of the molecules described in my thesis have been discussed.
Among the spectroscopic techniques, NMR and MS provided valuable data about the isolated and synthesised compounds.
The determination of absolute configuration of amino acids in PK/NRP compounds was carried out by using Marfey’s method.
References
1 Palmer III, A. G.; Cavanagh, J.; Wright, P. E.; Rance, M.; J. Magn. Reson. 1991, 151-170. 2 Bax, A.; Summers, M. F. J. Am. Chem. Soc. 1986, 2093.
3 Karplus, M.; J. Chem. Phys. 1959, 11.
4 Sanders, J. K. M.; Mersh, J. D. Prog. NMR Spectrosc. 1982, 353.
5 Hu, Q.; Noll, R. J.; Li, H.; Makarov, A.; Hardmanand, M.; Cooks, R. G.; J. Mass Spectrom., 2005,
40, 430-443.
6 Marfey, P. Carlsberg Res. Commun. 1984, 49, 591-596.
7 Fujii, K.; Ikai , Y.; Oka, H.; Suzuki, M.; Harada, K. Anal. Chem. 1997, 69, 3346-3352.
PART 1
Total synthesis of new hybrid PKS/NRPS
compounds, in the frame of the anticancer
Chapter 2
Total synthesis of 16-epi- and ent-smenamide A,
two analogues of the cytotoxic smenamide A
2.1 Cancer and bioactive natural products
Cancer is a generic term to define a group of diseases involving abnormal cell growth. Such a disease, also know as malignant tumour or neoplasm, arises without obvious causes from pre-existing body cells. It has no purposeful function, and it has the tendency to independent and uncontrolled growth.
Compared with benign tumours, in which the mass of abnormal tissue remains confined to its original location, a malignant tumour invades adjoining parts of the body and spreads to other organs, through the cardiovascular system and other channels. The latter process is known as metastasizing.
Cancer cells are defined as abnormal because they have undergone one or more of the following alterations:
hypertrophy: the increase in size of individual cells; hyperplasia: the increase in number of the cells;
anaplasia: the regression of the cells towards a more primitive or undifferentiated type.
Neoplasms arises from the transformation of normal cells into cancer cells through a multistage process which, starting as a pre-cancerous lesion, leads to a malignant tumour.Only in 5–10% of cases the development of tumours can be attributed to genetic defects,1 whereas the remaining 90–95% sink their roots in external causes,
include pollution, but every causative factor which is not genetically inherited.2
Three categories of external factor can be cited: physical carcinogens (e.g. ultraviolet and ionizing radiation), chemical carcinogens [e.g. asbestos, components of tobacco, aflatoxin (a food contaminant), and arsenic (a drinking water contaminant)] and biological carcinogens (e.g. infections caused by viruses, bacteria, or parasites).
In normal tissues, there is a delicate balance between the cell growth and proliferation and the replacing of dead or damaged cells. The body must continually regulate this balance to support own proper development and maintain healthy homeostasis of mature tissues.
In malignant tumours the regulation of the balance is compromised: a continuous proliferation of cells occurs, whereas apoptosis processes fail. This phenomenon can be traced back to the occurrence of genetic alterations. The incidence of several genetic mutations causes the accumulation of many errors which can give birth to a cancerogenic process. Some of these mutations are hereditary, while others are caused by external factors.
The genetic events underlying these mutations are essentially two:
activation of proto-oncogenes into oncogenes. Proto-oncogenes positively control the cell cycle through the regulation of cell division, apoptosis and differentiation. When they become oncogenes, normal cell division is disrupted and malignant changes occurs.
inactivation of tumour suppressor genes. In normal conditions, cells possess genes which have the ability to suppress malignant alterations (tumor suppressor). Mutations in these genes can trigger the carcinogenic process.
As for therapeutical approaches, many treatments are used in the fight against cancer. The choice of a specific treatment depends on the type of cancer and its stage of development. Among the most common anti-cancer approaches it is worth to cite surgery, chemotherapy, and radiotherapy. The surgery is a medical procedure by which a surgeon removes and/or examines the tumor mass. Radiation therapy is a treatment in which high doses of radiation are used in order to kill cancer cells and shrink tumours. Chemotherapy is indeed a treatment involving the use of drugs to kill the cancer. Some patients with cancer undergo only one treatment, but most patients have a combination of treatments such as surgery with chemotherapy and/or radiation therapy.
The efficacy of chemotherapy depends on the selectivity of the drug against cancer cells. The greater the biological differences between healthy and tumor cells are, the more the effectiveness of the treatment is. As these differences are minimal, there is no anticancer drug which does not cause serious toxic side effects.
Therefore, the anticancer chemotherapy is severely limited by the drugs toxicity. One of the most daunting features of cancer is its biological diversity which occurs not only in different types of tumours but also in the same population. Moreover, cancer cells develop very fast cells resistance against common anticancer therapies. Despite this seemingly catastrophic scenario, the chances of cancer survival have significantly increased in the last decade thanks to the early diagnosis and the efficiency of the therapies currently available.
Since cancer is a constantly evolving disease, the research of safe and effective chemotherapeutic agents is a formidable challenge.
In the frame of the constant anticancer research, natural products, with their unusual and often complex structures, have shown a broad spectrum of pharmacological activities.
Among natural anticancer molecules it is worth to mention vinca alkaloids derived from the periwinkle plant Catharanthus roseus, also known as Vinca Rosea. The cytotoxic effect of this class of compounds is due to their capability to bind to tubulin.3 Tubulin is a cytoplasmic protein which plays a key role during cell
division: its polymerised form constitutes the “spindle fibers”, also called microtubules. The formation of microtubules is a crucial step during cellular mitosis, because it provides cells with both the structure and flexibility needed for division and replication. Without microtubules, cells cannot divide.The vinca alkaloids mechanism exert their mechanism by blocking tubulin polymerisation and then the assembly of microtubules. Since the mitotic spindle can not be created, the cell consequently stops in metaphase during mitosis.
The taxanes represent another class of anticancer natural products. Compared with vinca alkaloids, they show the opposite mechanism of action: they prevent from the disassembly of the microtubules and the mitotic spindle. Paclitaxel, the progenitor of taxanes family, was isolated for the first time from the bark of Taxus brevifolia4.
It is a promoter of tubulin polymerisation. In particular, it bonds the tubulin which constitutes the microtubules, stabilising them and preventing them from disassembly. Therefore, a morphological alteration is created that leads the tumor cell to undergo apoptosis (programmed cell death mechanism). Docetaxel, the semi-synthetic analogue of Paclitaxel, was shown to have a slightly different mechanism of action. It binds to tubulin, giving rise to different-size microtubules in comparison with those induced by Paclitaxel. Moreover, it shows a much longer