1
"F
EDERICO
II" U
NIVERSITY
OF
N
APLES
PhD
PROGRAM
IN
NEUROSCIENCE
XXXI CYCLE
PhD Thesis:
IDENTIFICATION OF THE ROLE PLAYED BY Na
+/Ca
2+EXCHANGER 1
(NCX1) IN
HIPPOCAMPAL-DEPENDENT
ANXIETY, SPATIAL LEARNING
AND MEMORY CONSOLIDATION THROUGH GENETIC MODIFIED MICE
AND NEWLY SYNTHESIZED COMPOUNDS
Tutor
Candidate
Dr. Pasquale Molinaro
Dr. Silvia Natale
2
SUMMARY
ABSTRACT ... 4
1. INTRODUCTION ... 5
1.1 MEMORY PROCESS ... 5
1.1.1 HISTORY OF THE RESEARCH IN SYNAPTIC PLASTICITY AND MEMORY CONSOLIDATION ... 5
1.1.2 BRAIN STRUCTURES INVOLVED IN MEMORY FORMATION ... 6
1.1.3 BIOCHEMISTRY OF MEMORY: LONG TERM POTENTIANTION (LTP) AND MOLECULAR PATWAYS ... 7
1.2 THE Na+ AND Ca2+ EXCHANGER (NCX) ... 9
1.2.1 BIOCHEMICAL CHARACTHERIZATION OF NCX ... 9
1.2.2 TISSUE-SPECIFIC DISTRIBUTIONS OF NCX ISOFORMS ... 9
1.2.3 THE IMPORTANCE OF NCX UNDER PATHOLOGICAL AND PHISYOLOGICAL CONDITIONS...10
1.2.4 PHARMACOLOGICAL MODULATION NCX ...11
1.2.5 NCX GENETIC MODIFIED MICE ...12
2. AIMS ...15
3. MATERIALS AND METHODS ...17
3.1 PROCEDURES FOR THE SYNTHESIS OF 5-(2-CHLOROPHENYL)-7-NITRO-1-(PYRROLIDIN-1-YLMETHYL)-1H-BENZO[E][1,4]DIAZEPIN-2(3H)-ONE 2,2,2-TRIFLUOROACETATE (COMPOUND 2) 17 3.2 EXPERIMENTAL GROUPS ...18
3.3 MEASUREMENT OF Na+-DEPENDENT 45Ca2+ EFFLUX ...19
3.4 PROTEIN EXPRESSION ANALYSIS ...19
3.5 CELL CULTURES ...20
3.6 [Ca2+] i MEASUREMENT ...21
3.7 ELECTROPHYSIOLOGY ...22
3.8 DETERMINATION OF MITOCHONDRIAL ACTIVITY ...24
3.9 IMMUNOHISTOCHEMISTRY AND IMAGE ANALYSIS ...25
3.10 BEHAVIORAL STUDIES AND HORMONAL MEASUREMENTS ...26
3.11 OPEN-FIELD EXPLORATION AND NOVEL OBJECT RECOGNITION MEMORY TASK ...27
3.12 ROTAROD ...28
3.13 ELEVATED ZERO MAZE AND DARK/LIGHT BOX ...29
3.14 BARNES CIRCULAR MAZE TASK ...30
3.15 TRACE FEAR CONDITIONING ...30
3.16 STATISTICAL ANALYSIS ...32
3
4.1 NEWLY SYNTHESIZED COMPOUNDS MODULATING NCX ACTIVITY ...33 4.2 COMPOUNDS 2 AND IX AMELIORATE LEARNING AND MEMORY PERFOMANCE IN NOVEL OBJECT RECOGNITION TEST...39 4.3 COMPOUNDS 2, II AND IX AMELIORATE SPATIAL MEMORY IN BARNES MAZE AND TRACE FEAR CONDITIONING TESTS ...47 4.4 COMPOUND 2 SELECTIVELY INCREASES NCX1 ACTIVITY ...60 4.5 COMPOUND 2 INCREASES ANXIETY RESPONSE ...65 4.6 COMPOUND 2-TREATED MICE INCREASE PHOSPHORYLATED CaMKII LEVELS IN THEIR
HIPPOCAMPUS ...68 4.7 KNOCK-OUT OR OVEREXPRESSION OF NCX1 IN NEURONS OF HIPPOCAMPUS, AMYGDALA AND CORTEX AFFECT THE PHOSPHORYLATION OF CREB AND CaMKII ...70 4.8 NCX1ko AND NCX1.4over MICE DO NOT DISPLAY IMPAIREMENT OF LOCOMOTOR ACTIVITY ...87 4.9 NCX1ko SHOW IMPAIRED, WHEREAS NCX1.4over MICE DISPLAY IMPROVED LONG-TERM MEMORY PERFORMANCE IN NOVEL OBJECT RECOGNITION, BARNES MAZE AND TRACE FEAR CONDITIONING TESTS ...90 4.10 NCX1.4over MICE SHOW AN INCREASE IN ANXIETY SUSCEPTIBILITY IN OPEN FIELD, ZERO MAZE, BARNES MAZE, DARK/LIGHT BOX AND IN CORTICOSTERONE LEVELS ...98 5. DISCUSSION ...106
5.1 THE ADDITION OF CLORYDE IN POSITION 2 ON NEUROUNINA 1 SCAFFOLD LEDS TO THE GENERATION OF A NOVEL POTENT ACTIVATOR OF NCX1 ...106 5.2 COMPOUND 2 AMELIORATES INDICES OF SPATIAL LEARNING AND MEMORY ...107 5.3 THE INCREASE OF NCX1 EXPRESSION/ACTIVITY INDUCES ACTIVATION OF CREB AND CAMKII ...109 5.4 NCX1 OVEREXPRESSION IMPROVES, WHEREAS NCX1 KNOCKOUT IMPAIRS LEARNING AND MEMORY PERFORMANCE...109 5.5 NCX1 INCREASES ANXIETY LEVELS ...111 6. REFERENCES ...112
4
ABSTRACT
The Na+/Ca2+ exchanger 1 (NCX1), which is highly expressed in the hippocampus, cortex, and amygdala, regulates Akt1 phosphorylation. Since Akt1 is part of the PTEN/Akt1/CREB signaling pathway, which participates in synaptic plasticity and long-term memory, we investigated whether NCX1 expression/activity might also be involved in some hippocampal-dependent learning and memory processes. To test this hypothesis, we used two genetically-modified mice to selectively overexpress (NCX1.4over) or downregulate (NCX1ko) NCX1 in hippocampal, cortical, and amygdala neurons and a newly synthesized selective NCX1 stimulating compound, named CN-PYB2. Both NCX1.4over and CN-PYB2-treated mice showed increased phosphorylated CaMKII levels in the hippocampus and improved long-term spatial learning and memory performance. By contrast, NCX1ko mice displayed a decrease in both. In addition, both NCX1.4over and CN-PYB2-treated mice also displayed an increase in context-dependent anxiety.
Altogether, these results demonstrate that neuronal NCX1 participates in hippocampal-amygdala memory consolidation and promote anxiety behavior.
5
1. INTRODUCTION
1.1 MEMORY PROCESS
1.1.1 HISTORY OF THE RESEARCH IN SYNAPTIC PLASTICITY AND MEMORY CONSOLIDATION
Memory is defined as the capacity of brain to storage new pieces of information. The memory process is not a single faculty of mind but it is composed by multiple kinds of learning, each one processed by different brain regions. Studies in memory classification began in 1804 when Mine de Biran described for the first time three types of memories: (a) mechanical memory, (b) sensitive memory and (c) representative memory (Maine de Biran, 1929). In 1890 James W. explained in two different chapters memory and habits; in 1923 McDougall distinguished between explicit and implicit recognition and Tolman in 1948 reaching the theory that there is more than one kind of learning (James, 1890; Tolman, 1948). However, the main milestone in the memory research is represented by the case of the patient H.M., a severely amnesic man that was able to learn hand-eye coordination skill in absence of most of brain structure related to memory (Milner et al., 1968). Thanks to the increasing research in memory, to date it is widely accepted that it can be mainly classified in declarative and non-declarative memories. Declarative memory is the capacity of conscious to recollect fact and events and depending on structures in the medial temporal lobe and midline diencephalon (Squire et al., 2004). Non-declarative memory is referred to the collection of non-conscious abilities including simple
6
conditioning, priming, skills and habits, each one dependent on amygdala, neocortex and striatum respectively (Squire, 1992).
1.1.2 BRAIN STRUCTURES INVOLVED IN MEMORY FORMATION
To date, it is known that the most important cerebral regions involved in memory formation are the medial temporal lobe of cerebral cortex, amygdala, hippocampus, cingulate gyrus, thalamus and hypothalamus. The brain structures responsible of the “storage information” are interrelated through neural circuits. The cerebral cortex is subdivided into four lobes each one participates in different kinds of learning. The frontal lobe, known as prefrontal cortex, is involved in conscious though and in higher mental functions such as decision-making and it is important in processing short-term memory and in retaining long-term memories (Matthews, 2015). The parietal lobe integrates sensory information and participates in determining spatial sense and navigation; temporal lobe is involved in the senses of smell and sound and in processing of semantics and the occipital lobe is mainly involved in the sense of sight. The amygdala is essentially associated to memory consolidation, emotional learning and fear mediated responses (Roozendaal et al., 2009). Finally, the hippocampus is important for the conversion of short-term to long-term memory (Wong, 1997). Interestingly, hippocampus is divided in two subregions dorsal and ventral that are differently involved in several cognition processes. In particular, dorsal hippocampus participates in the spatial memory, since it is enriched with “place cells” that are responsible for modeling of cognitive maps representing the surrounding environment (Moser et al., 2015; Cobar et al., 2017). On the other hand, the ventral hippocampus is involved in contextual anxiety since it is enriched with
7
“anxiety cells”, that increase their cytosolic Ca2+ concentration ([Ca2+]i) in response to
anxiety-dependent contexts (Jimenez et al., 2018).
1.1.3 BIOCHEMISTRY OF MEMORY: LONG TERM POTENTIANTION (LTP) AND MOLECULAR PATWAYS
The molecular storage of learning and memory in the brain is highly correlated to the changes in the strength and numbers of connections among neurons. This phenomenon is called “synaptic plasticity” and the potentiation of synaptic connection responds differently to specific stimulations (HEBB and KONZETT, 1949). Studies in hippocampal neurons suggest that a weak train of stimulations induces post-tetanic potentiation (PTP), whereas an intermediate train of stimulations induces short term potentiation (STP) and a strong train of stimulations induces the long-term potentiation (LTP) (Bliss and Collingridge, 1993). The effect of PTP lasts in the range of several minutes, STP decays within 1 hour and LTP is sustained for a much longer period (Bliss and Gardner-Medwin, 1973; Walters and Byrne, 1984; Zucker and Regehr, 2002). The LTP could be delivered by a “tetanus” which means a train of 50-100 stimuli at 50-100 Hz (Figurov et al., 1996), by a more modest stimulus such as “theta-burst stimulation” (several bursts of 4 shocks at 100 Hz delivered at an interval of 200 ms) (Larson et al., 1986) or by a “primed burst stimulation” (a single priming stimulus followed at 200 ms by 4 shocks at 100 Hz) (Rose and Dunwiddie, 1986; Otto et al., 1991). The LTP is characterized by three basic properties: cooperativity, means the intensity and pattern of tetanic stimulation; associativity, the input could be active at the same or separate time; and input-specificity, LTP could occur only in a synapse of a neuron. The effects of LTP are expressed in the potentiation of
long-8
term memory (Lynch, 2004). The molecular mechanisms occurred during LTP process are dependent on the stimulation of NMDA glutamate receptors, Ca2+ entry and the activation of specific molecular pathways (Miyamoto, 2006). Studies performed in Ca2+/Calmodulin-dependent protein kinase II (CaMKII) mutant mice, or experiments performed on hippocampal slices after a theta-burst stimulation suggest a crucial role of the active form of the CaMKII during LTP (Silva et al., 1992; Fukunaga et al., 1993; Fukunaga et al., 1995). The generation of knockout mice for the cyclic AMP responsive element binding protein (CREB) suggests that the phosphorylation and activation of this protein is important for the induction of the LTP (Bourtchuladze et al., 1994) since it promotes the transcription of genes involved in the consolidation of synaptic plasticity (Lüscher et al., 2000). Moreover, it is known that the activation CREB could be directly regulated by CaMKII phosphorylation (Sun et al., 1994) or by AKT phosphorylation (Du and Montminy, 1998). At present, both CaMKII and CREB are considered as molecular markers of memory (Mizuno et al., 2002; Kandel, 2012).
9
1.2 THE Na+ AND Ca2+ EXCHANGER (NCX)
1.2.1 BIOCHEMICAL CHARACTHERIZATION OF NCX
The Na+ and Ca2+ exchanger (NCX) is an important plasma membrane transporter that mediates the antiporter of Na+ and Ca2+ (Reeves and Hale, 1984; Fujioka et al., 2000; Kang and Hilgemann, 2004). The exchanger is expressed in three isoforms NCX1, NCX2 and NCX3, each one is coded by three different genes (Nicoll et al., 1990; Li et al., 1994; Nicoll et al., 1996). NCX1 is composed of 938 amino acids and has a theoretical molecular mass of 120 kDa, NCX2 and NCX3 consists of 921 and 927 amino acids with a predicted molecular weight of 102 and 105 kDa, respectively. It is widely accepted that NCX mediates the antiporter of Ca2+ and Na+ ions across plasma membrane with a stoichiometry 1:3, even if it could vary from 1:1 to 1:4 depending on intracellular Na+ and Ca2+ concentration (Blaustein and Lederer, 1999; Philipson and Nicoll, 2000). NCX could operate in forward mode by coupling extrusion of Ca2+ to the influx of Na+ and in reverse mode by mediating the extrusion of Na+ and the intrusion of Ca2+ (Annunziato et al., 2004).
1.2.2 TISSUE-SPECIFIC DISTRIBUTIONS OF NCX ISOFORMS
The three NCX isoforms show a peculiar distribution in different tissues. In particular, the isoform NCX1 is expressed in brain, heart, skeletal muscle, smooth muscle, kidney, eye, secretory and blood cells, whereas NCX3 has been found in neuronal and skeletal muscle tissues (Quednau et al., 1997) and NCX2 is predominantly expressed in CNS (Jeon et al., 2003).
NCX1, NCX2 and NCX3 genes are differently expressed in neurons and glia of all areas of the central nervous system (CNS) (Papa et al., 2003). In particular,
10
pyramidal neurons of motor cortex layer III and V are enriched in NCX1, whereas NCX2 is intensively localized in the somatosensory cortical area. Immunohistochemistry experiments revealed differential expression of NCX isoforms in hippocampal subregions. NCX1 isoform is mainly localized in the granule cell layer and in dentate gyrus, the area of hippocampus receiving cortical projections; both NCX1 and NCX3 are expressed in the CA3 region, whereas only NCX3 is mainly found in the CA1 region. In the amygdala both NCX1 and NCX3 are localized in the lateral nucleus and basolateral nuclei (Canitano et al., 2002).
1.2.3 THE IMPORTANCE OF NCX UNDER PATHOLOGICAL AND
PHISYOLOGICAL CONDITIONS
The Na+ and Ca2+ exchanger is involved under different physiological and pathological conditions by regulating sodium and calcium homeostasis. Under physiological condition, for example, NCX is important in the contraction of cardiac myocytes (Bridge et al., 1990; Crespo et al., 1990), in mastocytes it participates in the cellular activation (Aneiros et al., 2005), in neurons it is involved in action potential and neurotransmitters release, and in glia it could regulate cellular activation (Boscia et al., 2009) and oligodendrocyte differentiation(Boscia et al., 2011). The Na+ and Ca2+ exchanger is also involved in pathological diseases characterized by a dysregulation of Ca2+ homeostasis, such as stroke, Alzheimer, Parkinson and multiple sclerosis diseases (Herchuelz et al., 2002; Pannaccione et al., 2002; Molinaro et al., 2008b). In stroke, it has been discovered that an increase in NCX activity could limit the severity of ischemic damage by coping with the increase of [Ca2+]i (Annunziato et al., 2007). The analysis of NCX isoforms in synaptosomal
11
preparation from parietal cortex of normal aged controls and late stage Alzheimer’s disease patient revealed an upregulation of NCX2 and a downregulation of NCX3 suggesting a possible role of this protein in the progression of the disease (Sokolow et al., 2011).
NCX2 and NCX3 plasmalemmal proteins regulate the mitochondrial protein kinase PINK1, involved in Parkinson disease, and their activity prevent the neurodegeneration of dopaminergic neurons by regulating the accumulation of mitochondrial [Ca2+]i (Wood-Kaczmar et al., 2013). In multiple sclerosis NCX have
been implicated in the impairment of axonal and neuronal functions.
1.2.4 PHARMACOLOGICAL MODULATION NCX
Since the discovery of the roles of NCX under different physiological and pathological conditions, many studies have been dedicated to its pharmacological modulation (Annunziato et al., 2004). Several organic and inorganic compounds have been identified as modulators of NCX activity, however most of them are inhibitors (Watano et al., 1999; Iwamoto et al., 2004; Secondo et al., 2009b; Molinaro et al., 2016), subdivided in 16 chemical classes, or possesses some nonspecific effects on others ion channels or receptors (Pintado et al., 2000; Reuter et al., 2002b). A new cell penetrating peptide, consistent of the endogenous region 562-688aa of the exchanger, was developed to prevent, by steric hindrance, the interaction between P1 and XIP domains involved in the autoinhibition of the exchanger (Molinaro et al., 2015). Thus, this regulatory peptide exerts a stimulatory effect on NCX1 activity. Recently, a new chemical compound named neurounina-1 (Molinaro et al., 2013) was synthesized by the modification of the chemical structure of SM-15811, one of
12
the most potent inhibitor of NCX activity (Hasegawa et al., 2003). Neurounina-1 is able to increase NCX1 and NCX2 activity, in both forward and reverse modes of operation, with an EC50 in the low nanomolar range, whereas it has no effects on
NCX3 activity. This new compound shows a neuroprotective effect on experimental model of cerebral ischemia. In order to obtain drugs selective for each NCX isoform, twenty new compounds were generated by different modifications on the chemical backbone of neurounina-1. In the present work these compounds were screened for their effects on NCX1, NCX2 and NCX3 activity.
1.2.5 NCX GENETIC MODIFIED MICE
In order to study the role of all three NCX isoforms under some physiological or pathological conditions NCX1, NCX2 and NCX3 genetically modified mice were generated. In 2000, four independent laboratories generated NCX1 knock-out mice, but this mouse dye in utero 9.5 days post-coitum because of the loss of spontaneous heartbeat (Cho et al., 2000; Wakimoto et al., 2000; Koushik et al., 2001; Reuter et al., 2002a) Then, in 2004, Henderson et al., overcame this limitation with the generation of a conditioned NCX1 knock-out mouse by means of Cre/LoxP technique. The knock-out of NCX2 or NCX3 isoform is compatible with life and survive until old age. Further studies in NCX1 genetic modified mice show that the overexpression of NCX1 in cortex and hippocampus reduces the ischemic volume and ameliorates focal and general deficits after transient middle cerebral artery occlusion, whereas, opposite results are obtained in NCX1 knockout mice. Moreover, the overexpression of NCX1 is accompanied by an enhancement of phosphorylation levels of Akt1 in
13
neuronal cells in both in vitro and in vivo models (Secondo et al., 2015; Molinaro et al., 2016; Secondo et al., 2018b).
Moreover, since NCX plays a role in the regulation of [Ca2+]i concentration at synaptic
level of hippocampal neurons (Reuter and Porzig, 1995; Bouron and Reuter, 1996) the role of NCX2 and NCX3 in learning and memory performance were investigated by the use of NCX2 and NCX3 knock-out mice, respectively. The deletion of NCX2 in hippocampal neurons significantly prolongs the time required for clearance of increased [Ca2+]i and consequently increases LTP and synaptic plasticity
consolidation. Furthermore, NCX2 knock-out mice show an improvement of their performance in hippocampal-depended learning and memory tasks such as Barnes maze, contextual conditioning and novel object recognition test (Jeon et al., 2003). On the other hand, the knock-out of NCX3 worsens LTP and impairs basal synaptic transmission in hippocampus. For this reason, NCX3 knockout mice show a reduction of CaMKII expression and a reduction of learning and memory performance in Barnes maze, novel object and context depended fear conditioning assay (Molinaro et al., 2011).
To date, there is no evidence of the role played by NCX1 in learning and memory performance, but previous studies show that NCX1 increases the phosphorylation of Akt, a protein involved in signalling pathways important for the long-term potentiation and in the improvement of memory consolidation (Sui et al., 2008; Giese and Mizuno, 2013). In the present work we analyse the effects of NCX1 on learning and memory tasks by modulating its activity with a new selective activator, and its expression with the generation of two genetic modified mice that, upon tamoxifen administration show
14
a selective overexpression, or knockout, of NCX1 isoform (Molinaro et al., 2016) in neurons of hippocampus, cortex and amygdala.
15
2. AIMS
The Na+/Ca2+ exchanger 1 (NCX1) participates in the maintenance of cytosolic Ca2+ homeostasis and is highly expressed in the hippocampus, cortex, and amygdala (Canitano et al., 2002; Papa et al., 2003), three brain regions involved in spatial learning and memory and social behavior. This appear to be very interesting since: (a) NCX1 expression/activity regulates Akt1 phosphorylation in neuronal cells (Secondo et al., 2015; Molinaro et al., 2016; Secondo et al., 2018a); (b) NCX1 might increase CREB phosphorylation via the PTEN/Akt/CREB signaling pathway by increasing Akt1 phosphorylation; (c) NCX1 might affect calmodulin kinase II (CaMKII) activation via the Ca2+/calmodulin/CaMKII pathway by regulating cytosolic neuronal Ca2+ clearance; (d) activation of both CaMKII and CREB proteins plays a pivotal role in spatial learning and memory performance and anxiety behavior (Carlezon et al., 2005; Lo Iacono and Gross, 2008).
On the basis of these assumptions, we investigated the role of NCX1 in spatial learning, memory and anxiety behavior by means of two complementary strategies: (i) two genetically modified mouse strains for NCX1 and (ii) the design and synthesis of a newly compound, named CN-PYB2, that selectively increases NCX1 activity. In particular, upon tamoxifen administration, the two genetically modified mouse strains, display a selective increase (NCX1.4over), or decrease (NCX1ko), in NCX1 expression in hippocampal, cortical and amygdala neurons (Molinaro et al., 2016).
All genetically modified mice for NCX1 and CN-PYB2-treated C57BL/6 mice were analyzed in several hippocampal-dependent tasks to evaluate the physiological role of NCX1 in promoting spatial learning, memory, and anxiety behavior, and in
16
activating of some molecular markers involved in synaptic plasticity including CaMKII and CREB.
17
3. MATERIALS AND METHODS
3.1 PROCEDURES FOR THE SYNTHESIS OF 5-(2-CHLOROPHENYL)-7-NITRO-1-(PYRROLIDIN-1-YLMETHYL)-1H-BENZO[E][1,4]DIAZEPIN-2(3H)-ONE 2,2,2-TRIFLUOROACETATE (COMPOUND 2)
The compound was obtained as following the synthetic procedure reported for neurounina-1 (Molinaro et al., 2013), starting from clonazepam and pyrrolidine. Yield 67.8%. ESI-MS calcd for C20H19ClN4O3 398,8 found [M+H]+ 400,5. Final compound
was converted to the corresponding trifluoroacetate salt by dissolving in 0.1% trifluoroacetic acid (TFA) in H2O/acetonitrile (60:40 [v/v]). Finally, the obtained
solution was frozen and lyophilized to yield the desired salt (mp 169.1 °C). The final product was analyzed by NMR spectroscopy. In particular, results showed 1H NMR (400 MHz, DMSO-d6) δ 1.80-1.90 (m, 4H), 2.00-2.10 (m, 4H), 3.75 (s, 2H), 4.27 (s, 2H), 7.47-7.57 (m, 4H), 7.78 (s, 1H), 7.82 (d, 1H), 8.41 (d, 1H); 13C-NMR (400 MHz, DMSO-d6): δ 168.69; 168.30; 143.95; 142.37; 137.79; 132.37; 132.33; 132.26; 130.25; 127.98; 127.72; 127.28; 125.45; 122.96; 60.70; 55.39; 54.35; 22.82; where "s" was used for singlet and "m" was used for multiplet. The 1H and 13C NMR spectra were recorded on a Varian Mercury Plus 400 MHz instrument (Varian Inc., Palo Alto, CA). Purity of the product (>99.5%) was assessed by analytical reversed-phase high-performance liquid chromatography (HPLC) using the conditions previously reported in literature for neurounina-1 (Molinaro et al., 2013).
18
3.2 EXPERIMENTAL GROUPS
Both genetically modified mouse lines, viz, neuronal specific NCX1.4 overexpressing mice (NCX1.4over) and NCX1 knock-out (NCX1ko) mice, were generated by our research group as previously described (Molinaro et al., 2016). Wild-type C57BL/6 mice were purchased from Charles River (Italy). NCX1ko, NCX1.4over and C57BL/6 mouse strains, aged 8–12 weeks and weighing 20–25 g, were housed under diurnal lighting conditions (light 6:00 a.m. to 6:00 p.m.).
In this study, 105 genetically modified and 75 C57BL/6 male mice were used for experimental procedures. In particular, animals for each experimental group were randomly selected from the respective mouse genotypes. Fifteen animals, randomly selected for each genotype, were considered to be sufficient per each experimental group to demonstrate any variation in behavioral tests.
To induce genomic DNA recombination, both NCX1ko, NCX1.4over were treated with tamoxifen for 5 days as previously reported (Molinaro et al., 2016) and used after at least one week of drug wash-out. C57BL/6 mice were treated with saline solution (vehicle) or with 32 µg/kg of Compound 2 solution by i.p. injections. In vivo toxicity was evaluated by a single i.p. administration of a saline solution containing 32 µg/kg of Compound 2. Variations of body weight, temperature, and abnormal behavior was monitored for 15 days.
All experiments were carried out in blind manner, the people who performed the experiments and analyzed the data were not aware of the pharmacological treatment. All protocols and procedures of the handling of animals were performed on male mice according to the international guidelines for animal research and approved by the Animal Care Committee of “Federico II” University of Naples, Italy.
19
3.3 MEASUREMENT OF Na+-DEPENDENT 45Ca2+ EFFLUX
NCX-mediated 45Ca2+ efflux was measured as previously described (Molinaro et al., 2013). Briefly, cells were loaded with 5 µM 45Ca2+ (80 MBq/ml) together with 1 µM ionomycin for 60 seconds in normal Krebs (in mM): 5.5 KCl, 145 NaCl, 1.2 MgCl2,
1.5 CaCl2, 10 glucose, and 10 Hepes-NaOH (pH 7.4). Next, cells were exposed
either to a Ca2+ and Na+-free solution—a condition that blocks both intracellular 45Ca2+ efflux and extracellular Ca2+ influx— or to a Ca2+-free plus 0.5 mM EGTA containing 145 mM Na+, a condition that promotes 45Ca2+ efflux. Thapsigargin (1 µM) was present in both solutions. 45Ca2+ efflux was started by using Ca2+-free, Na+-containing solution plus 0.5 mM EGTA. Cells were exposed to this solution, which promotes 45Ca2+ efflux, for 10 seconds. At the time chosen (10 seconds), a very low efflux was detected in wild-type BHK cells. Na+-dependent 45Ca2+ efflux was estimated by subtracting 45Ca2+ efflux in Ca2+- and Na+-free solution from that in Ca2+-free solution. Cells were subsequently lysed with 0.1 N NaOH, and aliquots were taken to determine radioactivity. The EC50 values for Compound 2 were
obtained by fitting the data with the equation a + b x exp(-x/t), where a is the maximal response, b is the basal response, x is the drug concentration, and t is the EC50.
3.4 PROTEIN EXPRESSION ANALYSIS
Whole-cell protein extracts from adult hippocampus or cortex were obtained and processed as previously described (Molinaro et al., 2008a). Briefly, nitrocellulose-membranes were incubated with anti-CREB (mouse monoclonal, 1:1000, Cell Signaling), anti-pCREB Ser133 (rabbit polyclonal, 1:1000 Millipore), anti-Phospho-CaM Kinase II T286 (rabbit polyclonal, 1:1000, abcam), anti-Phospho-anti-Phospho-CaM Kinase II
20
T305 (rabbit polyclonal, 1:1000, Bioss antibodies) or anti-Tubulin (mouse monoclonal, 1:10.000, Sigma) antibodies.
These nitrocellulose-membranes were first washed with 0.1% Tween 20, and then incubated with the corresponding secondary antibodies for 1h (GE Healthcare Bio-Sciences). Immunoreactive bands were detected with electrochemiluminescence (GE Healthcare Bio-Sciences). The optical density of the bands (normalized with Tubulin or Creb) was determined by Chemi-Doc Imaging System (Bio-Rad).
3.5 CELL CULTURES
Baby hamster kidney (BHK) cells stably transfected with canine cardiac NCX1.1, rat brain NCX2.1, and NCX3.3 were a generous gift from Dr. Kenneth D. Philipson (University of California, Los Angeles, CA). All BHK cell lines were grown on plastic dishes in a mix of Dulbecco’s modified Eagle’s medium and Ham’s F-12 medium (1:1) (Life Technologies, San Giuliano Milanese, Italy) supplemented with 5% fetal bovine serum, 100 U/ml penicillin, and 100 mg/ml streptomycin (Sigma-Aldrich, St. Louis, MO). Cells were cultured in a humidified 5% CO2 atmosphere, and the culture
medium was changed every 2 days. For microfluorimetric and electrophysiologic studies, cells were seeded on glass coverslips (Thermo Fisher Scientific, Springfield, NJ) coated with poly-L-lysine (30 mg/ml) (Sigma-Aldrich) and used at least 12h after seeding.
Human embryonic kidney-293 (HEK293) cells were cultured in DMEM–Dulbecco's Modified Eagle Medium (Gibco) containing 10% fetal bovine serum, penicillin (50 U/ml) and streptomycin (50 μg/ml), 2 mM Glutamine in a humidified atmosphere at 37°C with 5% CO2. HEK293 cells endogenously express ASIC1a channels
21
(Gunthorpe et al., 2001). For electrophysiological experiments, cells were seeded on glass coverslips (Glaswarenfabrik Karl Hecht KG, Sondheim, Germany) coated with poly-L-lysine (50 µg/mL) and used after 24-72 hours in culture (Sigma-Aldrich, St. Louis, MO) to assess the effects of Compound 2 on ASIC1a currents.
3.6 [Ca2+]i MEASUREMENT
[Ca2+]i was measured by single-cell computer-assisted video imaging (Secondo et
al., 2007). Briefly, BHK cells, grown on glass coverslips, were loaded with 6 mM Fura-2 acetoxymethyl ester (Fura-2 AM) for 30 minutes at 37°C in normal Krebs solution containing the following (in mM): 5.5 KCl, 160 NaCl, 1.2 MgCl2, 1.5 CaCl2,
10 glucose, and 10 Hepes-NaOH (pH 7.4). At the end of the Fura-2 AM loading period, the coverslips were placed into a perfusion chamber (Medical Systems, Greenvale, NY) mounted onto the stage of an inverted Zeiss Axiovert 200 microscope (Carl Zeiss, Oberkochen, Germany) equipped with a FLUAR 40X oil objective lens. The experiments were carried out with a digital imaging system composed of MicroMax 512BFT cooled CCD camera (Princeton Instruments, Trenton, NJ), LAMBDA 10-2 filter wheeler (Sutter Instruments, Novato, CA), and Meta-Morph/MetaFluor Imaging System software (Universal Imaging, West Chester, PA). After loading, cells were alternatively illuminated at wavelengths of 340 nm and 380 nm by a xenon lamp. The emitted light was passed through a 512-nm barrier filter. Fura-2 fluorescence intensity was measured every 3 seconds. Forty to sixty-five individual cells were selected and monitored simultaneously from each coverslip. All the results are presented as cytosolic Ca2+ concentration. Since KD for Fura-2 was
22
used for calibration. NCX activity was evaluated as Ca2+ uptake through the reverse mode by switching the normal Krebs medium to Na+-deficient NMDG+ medium named Na+-free (in mM): 5.5 KCl, 147 NMDG, 1.2 MgCl2, 1.5 CaCl2, 10 glucose, and
10 Hepes-Trizma (pH 7.4), in the presence of thapsigargin, the irreversible and selective inhibitor of the sarco(endo)plasmic reticulum Ca2+-ATPase (SERCA) (Secondo et al., 2007).
Compound 2 was incubated with cells for 30 minutes before NCX activity was studied. Each EC50 of Compound 2 was obtained by fitting the data with the equation a + b x exp(-x/t), where a is the maximal response, b is the basal response,
x is the drug concentration, and t is the EC50.
3.7 ELECTROPHYSIOLOGY
NCX Currents. NCX currents (INCX) were recorded, by patch-clamp technique in
whole-cell configuration (Secondo et al., 2007; Molinaro et al., 2013) in BHK cells stably transfected with NCX1 exposed either to Compound 2 or its vehicle.
Currents were filtered at 5 kHz and digitized using a Digidata 1322A interface (Molecular Devices, Sunnyvale, CA). Data were acquired and analyzed using the pClamp software (version 9.0; Molecular Devices). In brief, INCX were recorded
starting from a holding potential of -70 mV up to a short-step depolarization at +60 mV (60 ms) (Secondo et al., 2009a). Then, a descending voltage ramp from +60 mV to -120 mV was applied. The current recorded in the descending portion of the ramp (from +60 mV to -120 mV) was used to plot the current-voltage (I-V) relation curve. The magnitudes of INCX were measured at the end of +60mV (reverse mode) and at
23
experimental groups were recorded first for total currents and then for currents in the presence of Ni2+ (5 mM), a selective blocker of INCX. Compound 2-induced INCX
increase was calculated as follows: (INCX Compound 2/INCX control) x 100.
External Ringer solution contained the following (in mM unless otherwise specified): 126 NaCl, 1.2 NaHPO4, 2.4 KCl, 2.4 CaCl2, 1.2 MgCl2, 10 glucose, and 18 NaHCO3,
20 TEA, 10 nM TTX, and 10 mM nimodipine (pH 7.4). The dialyzing pipette solution contained the following (in mM): 100 potassium gluconate, 10 TEA, 20 NaCl, 1 Mg-ATP, 0.1 CaCl2, 2 MgCl2, 0.75 EGTA, and 10 Hepes, adjusted to pH 7.2 with CsOH.
TEA (20 mM) and Cs were included to block delayed outward rectifier K+ components; nimodipine (10 mM) and TTX (50nM) were added to external solution to block L-type Ca2+ channels and TTX sensitive Na+ channels, respectively. The quantifications of INCX were normalized for membrane capacitance and expressed as
a percentage of controls as previously reported (Molinaro et al., 2008a; Molinaro et al., 2011), whereas the representative traces of INCX are expressed as picoamps per
millivolt (pA/mV).
Asic Currents. ASIC1a currents were measured on HEK293 by means of the
patch-clamp technique in the whole-cell configuration. Electrophysiological recordings were carried out at room temperature (20–24°C), using an Axopatch 200B amplifier controlled using the pClamp 10 software (Axon Instruments, Union City, CA, USA). The holding potential was -70 mV, traces were filtered at 5kHz and currents were digitized using a Digidata 1322A interface (Axon Instruments, Union City, CA, USA). The extracellular solutions contained (in mM) 140 NaCl, 5 KCl, 2 CaCl2, 2 MgCl2, 10
HEPES, pH was adjusted to 7.4 using NaOH or HCl. For solution with pH 6.0, glycine 10 mM and MES instead of HEPES were used for more reliable pH buffering.
24
Pipettes had a resistance of 2–4 MΩ when filled with the intracellular solution, which contained (in mM): 30 NaCl, 120 KCl, 2 MgCl2, 10 HEPES with or without EGTA, pH
was adjusted to 7.3 using NaOH or HCl. The ASIC1a channel was activated by shifting the pH of the external solution from pH 7.4 to pH 6.0. Fast extracellular solution exchange was performed using a commercially available automated fast solution exchange system (Warner Instruments SF-77B). In particular, a rapid reduction of extracellular pH from 7.4 to pH 6.0 (10 seconds) evoked large transient inward currents. Between two-three stimulation cells were kept in a bath solution (pH 7.4) for at least 40 seconds. After that, Compound 2 was pre-applied in extracellular solution pH 7.4 for 40 seconds and co-applied in extracellular solution pH 6.0 for 10 seconds (approximately 50 seconds between pH stimulations).
3.8 DETERMINATION OF MITOCHONDRIAL ACTIVITY
Mitochondrial dysfunction was evaluated with the MTT method (Molinaro et al., 2013). In brief, after the experimental procedures, BHK cells were washed with normal Krebs solution and incubated with a MTT solution (0.5 mg/ml in phosphate-buffered saline). This yellow soluble tetrazolium salt is converted into a water-insoluble purple formazan by the succinate dehydrogenase system of the active mitochondria. Therefore, the amount of formazan produced is proportional to the number of cells with mitochondria that are still alive. After 1h of incubation at 37°C, cells were dissolved in 1 ml of DMSO, in which the rate of MTT reduction was measured by a spectrophotometer at a wavelength of 540 nm. Data are expressed as percentage of mitochondrial dysfunction versus sham-treated cultures.
25
3.9 IMMUNOHISTOCHEMISTRY AND IMAGE ANALYSIS
Immunostaining and confocal immunofluorescence procedures were performed as previously described (Anzilotti et al., 2015). Animals were anesthetized and transcardially perfused with saline solution containing 0.01 ml heparin, followed by 4% paraformaldehyde in 0.1 mol/l PBS saline solution. Brains were rapidly removed on ice and postfixed overnight at +4°C and cryoprotected in 30% sucrose in 0.1 M phosphate buffer (PB) with sodium azide 0.02% for 24 h at 4°C. Next, brains were sectioned frozen on a sliding cryostat at 40 μm thickness, in rostrum-caudal direction. Afterwards, free floating serial sections were incubated with PB Triton X 0.3% and blocking solution (0.5% milk, 10% FBS, 1% BSA) for 1 h and 30 min. The sections were incubated overnight at +4 °C with the following primary antibodies: mouse monoclonal anti-NeuN (Millipore, Milan, Italy), mouse monoclonal anti-NCX1 (Swant, Bellinzona, Switzerland), rabbit polyclonal anti-phospho-CREB S133 (Millipore, Cat #06-519), mouse monoclonal anti-phospho-CaMKII T286 (Abcam, ab32678).
The sections were then incubated with the corresponding florescent-labeled secondary antibodies, Alexa 488/Alexa 594 conjugated antimouse/antirabbit IgGs (Molecular Probes, Invitrogen S.R.L., Milan, Italy). Nuclei were counterstained with Hoechst (Sigma-Aldrich, Milan, Italy). Images were observed using a Zeiss LSM700 META/laser scanning confocal microscope (Zeiss, Oberkochen, Germany). Single images were taken with an optical thickness of 0.7 m and a resolution of 1024 × 1024. In double-labeled sections, the pattern of immune reactivity for both antigens was identical to that seen in single-stained material. Control double-immunofluorescence staining entailed the replacement of the primary antisera with normal serum (data not
26
shown). To minimize a possible cross-reactivity between IgGs in double immunolabeling experiments, the full complement of secondary antibodies was maintained but the primary antisera were replaced with normal serum or only one primary antibody was applied (data not shown). In addition, the secondary antibodies were highly preadsorbed to the IgGs of numerous species. Tissue labeling without primary antibodies was also tested to exclude autofluorescence. No specific staining was observed under these control conditions, thus confirming the specificity of the immunosignals.
To obtain an indirect measure of the amount of pCaMKII_T286, NCX1, and pCREB_S133 in neurons, image analysis of NeuN was performed by NIH image software by measuring the intensity of fluorescent NCX1, pCaMKII_T286 and pCREB_S133 immunolabeling in 60 NeuN positive neurons for each group. The intensity of NCX1 CaMKII_T286 and pCREB_S133 immunoreactivity was expressed in arbitrary units (Anzilotti et al., 2018).
3.10 BEHAVIORAL STUDIES AND HORMONAL MEASUREMENTS
At the age between 2-3 months, mice were behaviorally tested. Experiments were performed during the light phase between 11:00 a.m. and 3:00 p.m. During behavioral tests, animal movements were recorded by 2 cameras (resolution 640x480 pixels) and analyzed by a dedicated software operating in video tracking mode (Anymaze) and manually by an experimental researcher. The system tracked the animal's head as well as its centre of gravity and tail. The results therefore included measures specific to the position of the animal and movements. The animal was considered to be immobile if it doesn't change location and at least 65% of its
27
body remains static for a period of 2000ms or more. The system detected periods when the animal is freezing for at least 250ms. Experiment's treatment groups were coded in blind with the experimental researcher involved in the score definition.
For hormone assay, mice were sacrificed by CO2 and blood was collected from heart
in ice-cooled centrifugal tubes. Serum corticosterone levels were measured in serum by Elisa (VetforLab, Pozzuoli, Italy) at 6:00 a.m., 12:00 p.m., 6:00 p.m. and 12:00 a.m. under non-stressful conditions, or approximately 60m or 24h after foot-shock. Serum corticosterone levels at 12:00 p.m. were used as control group for 1h and 24h after foot-shock groups.
3.11 OPEN-FIELD EXPLORATION AND NOVEL OBJECT RECOGNITION MEMORY TASK
Open field and novel object recognition task were performed as previously described (Molinaro et al., 2011). Briefly, the open field apparatus (50x50 cm, 40 cm high) was placed in a homogenously lit experimental room with several large-scale environmental visual cues. Ninety animals (13 NCX1.4over, 12 NCX1.4+/+, 17 NCX1ko, 19 NCX1+/+, 14 compound 2-treated C57BL/6, 15 vehicle-treated C57BL/6) were individually placed in the apparatus and were allowed to explore it for 5 min. Several parameters, including total traveled distance, were measured by using an automated tracking software (Anymaze). The time spent by animals in three concentric areas was automatically measured as an index of anxious behavior (Kassed and Herkenham, 2004; Kazlauckas et al., 2005). The same apparatus was also used for the object recognition task. Compound 2, or vehicle, was administered once 30m before the begin of the test by i.p. injection.
28
Novel object recognition memory task was performed 30m after open field test, thus no additional drug administration was provided for this test neither in training, 1h nor 24h session. During the training trial, two objects were placed in the box and animals were allowed to explore them for 5 min. A mouse was considered to be exploring the object when its head was facing the object within 27mm of distance. Following retention intervals (1h and 24h), animals were placed back to the box with two objects in the same locations, but one of the familiar objects was replaced by a novel object and then were allowed to explore the two objects for 5 min. The preference percentage, ratios of the amount of time spent exploring any one of two objects or the novel one over the total time spent exploring both objects, were used to assess the recognition memory.
3.12 ROTAROD
Motor coordination and balance were assessed using a five-station mouse rotarod apparatus (Ugo Basile; Milan, Italy). In each station, the rod was 6 cm in length and 3 cm in diameter. Mice were trained to maintain balance at increasing speed from 4 to 14 rpm for three consecutive trials over 60 s. The test sessions were conducted by three trials of rotarod over 60 s under the same conditions of the training session. The maximum latency of 60 s was assigned to the mice that did not fall at all (Giampà et al., 2010). Compound 2, or vehicle, was administered by i.p. 30m before the test session. Data were expressed as mean of the three trials in the test session.
29
3.13 ELEVATED ZERO MAZE AND DARK/LIGHT BOX
The elevated-O-maze is a modification of the plus-maze and displays the advantage of lacking the ambiguous central area of the elevated plus-maze. Zero maze consisted of a circular path with an outer diameter of 122 cm and with a catwalk of 10 cm wide. With regard to mice’s natural aversion towards elevated and open spaces (Shepherd et al., 1994; Kulkarni et al., 2007) the catwalk was positioned at a height of 40 cm and divided into four subsections: two “closed” (wall height: 30 cm) and two “open” quadrants. Testing took place approximately at 12:00 a.m. with equal lighting conditions that provided a maze surface free of distracting shadows. Compound 2, or vehicle, was administered by i.p. 30m before the test. After at least 30m of habituation to the experiment room, each mouse was placed alternately into the center of one of the open quadrants and video-recorded for 5m. The time spent in the open quadrants was expressed as percentage of the respective wild-type or vehicle group.
Dark/light box apparatus consisted of two transparent polyvinylchloride boxes (22x38 cm, 15cm height). One of the boxes was covered and darkened, whereas the other box was well lighted. The two boxes contained some dust-free sawdust bedding and are linked by a window (10 cm wide, 6.5 cm height). The subjects were individually tested from 11 a.m. to 3 p.m. in two sessions: before (naïve) and after (post-shock) a single foot-shock. Mice were placed in the lit box at the beginning of the test. The amount of time spent in the lit box and the number of transitions across the two boxes were automatically and manually recorded. A mouse whose four paws were in the new area was considered having changed box. During the video-recording, the
30
experimenters were not present in the room. Analysis was performed post-hoc on videorecording movie.
3.14 BARNES CIRCULAR MAZE TASK
Apparatus. The behavioral apparatus used in this experiment consisted of a white
circular platform (1.22 m diameter) elevated 80 cm above the floor, with 36 equally spaced holes (each 5 cm diameter) around the periphery (5 cm from the perimeter). Only one hole led to a dark escape box (5 cm x 5 cm x 11 cm) that was fixed in relation to the distal environmental cues and contained some dust-free sawdust bedding. The platform surface was brightly illuminated from above to motivate to escape in the dark box (Bach et al., 1995; Seeger et al., 2004).
Procedure. Mice were gently picked up from the tail and placed in the middle of the
platform. The direction faced by the animals at the start position was random and changed from trial to trial. After 5 min, if the mice did not find the goal they were gently directed toward the correct hole and allowed to descend into the escape box where they were left for 1 min (Bach et al., 1995; Seeger et al., 2004). The following 5 test trials (one trial per day) were performed under same conditions. Each trial ended when the mouse entered the goal escape box or after a maximum time of 5 min. The amount of time it took the mice to enter the escape hole (escape latency) was recorded (Bach et al., 1995; Seeger et al., 2004).
3.15 TRACE FEAR CONDITIONING
The trace fear conditioning procedure is a modified form of tone (delay) fear conditioning because it demands a “trace interval” between the unconditioned
31
stimulus (US) and conditioned stimulus (CS). Unlike delay tone conditioning, the acquisition of trace fear conditioning is sensitive to hippocampal lesions (McEchron et al., 1998; Desmedt et al., 2003; Bangasser et al., 2006) and to genetic modifications of the hippocampus (Huerta et al., 2000; D'Adamo et al., 2002). In this test a fear-conditioning shock chamber (17x17 cm, 25 cm height) containing a stainless-steel rod floor (2.5 mm diameter, spaced 1 cm apart, Ugo Basile Inc.) and a digital camera to monitor animal movements were used in a soundproof box (Ugo Basile Inc.). The apparatus for on-line tracking and stimulus/shock delivery was controlled using anymaze software v5.31.
Briefly, for the conditioning (Lu et al., 1997; Jeon et al., 2003), mice were first placed in the fear-conditioning apparatus chamber for 3 min (habituation phase), and, then, a 15 s acoustic CS (1000 Hz, 80 dB) was delivered. The tone intensity and frequency, previously tested in C57BL/6 mice, did not evoke freezing before conditioning although short orienting reactions showed their ability to perceive the sound. After 15 s from the end of the acoustic stimulus, a 0.5mA shock (0.8 s duration) of unconditioned stimulus was applied to the floor grid. This protocol was performed one time per animal. Compound 2, or vehicle, was administered 30m before the habituation phase.
Context test of trace fear conditioning was measured 30m after the conditioning procedure. Animals were tested for their context freezing response and afterward for their response to the tone in a different context.
Context freezing response was measured placing the animals for 5m in the same apparatus used for conditioning in absence of electrical or acoustical stimuli. Behavior was recorded with a digital camera and analyzed by software (anymaze) for
32
the freezing behavior, defined as complete absence of somatic movements except for respiratory movements.
To assess the tone test in trace fear conditioning, the animals were placed in a different context (novel chamber, odor, floor, and visual cues) 30m after the context test, and their behavior was monitored for 6 min. All experimental groups were observed for 3m before the tone (pre-CS) and 3m (CS) during the tone in the new context. Fear response was quantified by measuring the duration of freezing behavior. Freezing behavior was defined as a total lack of movement, apart from respiration.
3.16 STATISTICAL ANALYSIS
Values are expressed as means ±S.E.M. Statistical analysis was performed with paired or unpaired Student’s t test, Kruskal-Wallis one or two Way ANOVA followed by Dunn’s test with all pairwise multiple comparison procedures or Student-Newman-Keuls post-hoc test. Statistical significance was accepted at the 95% confidence level (p < 0.05).
33
4. RESULTS
4.1 NEWLY SYNTHESIZED COMPOUNDS MODULATING NCX ACTIVITY
Twenty newly compounds have been synthesized by different modifications on the chemical backbone of neurounina-1 (7-nitro-5-phenyl-1-(pyrrolidin-1-ylmethyl)-1H-benzo[e][1,4]diazepin-2(3H)-one) (Figure 1). The benzodiazepinonic derivatives are obtained by the addition of cyclic amine via an acetic spacer (compounds I-VIII) or by an ethylic spacer (in compound 4 and compounds IX-XVI) to the position 1 of neurounina-1 (Figure 1). Moreover, compounds 2 and 3 were generated by the addition of a chloride residue in position 2 and 7, respectively (Figure 1).
The effects of newly synthesized compounds on all three NCX isoforms were evaluated with 45Ca2+ radiotracer, fura-2-monitored Ca2+ increase and patch clamp in whole cell configuration methods ( Figure 2) on BHK cells singly transfected with NCX1, NCX2 or NCX3. Among the twenty new compounds, five of them were selected: compounds 2 and 3 that are able to increase NCX1 activity ( Figure 2A); compounds II and IX that are inhibitors of NCX2 activity ( Figure 2B); and compound III for its effect as activator on NCX3 ( Figure 2C). The concentration effect-curves evaluated on each NCX isoform revealed that compounds 2 and 3 show an EC50 of
1.4 nM and 1.3 nM on NCX1 (Figure 3), respectively. Compounds IX inhibited NCX2 activity with an EC50 of 2,9 nM and Compound II modulated both NCX1 and NCX2
activity (Figure 4). Compound III increases NCX3 and NCX1 activity but no EC50 was
34
35
Figure 2. Effects of newly synthesized compounds on the three NCX isoforms.
(A) and (C) Effects of new compounds on NCX1 or NCX3 activity evaluated with single cell
Fura-2 monitored Ca2+ technique.
(B) Effects of new compounds on NCX2 activity evaluated with 45Ca2+ radiotracer assay.
36 Figure 3. Dose-effect curves of compounds 2 and 3.
Concentration-response curves of compound 2 (A) and compound 3 (B) on Na+
-dependent 45Ca2+ efflux in BHK cells expressing NCX1, NCX2 or NCX3. *, p < 0.05 vs
respective NCX2 and NCX3, two-way ANOVA followed by Newman-Keuls’ test. Compound 2, F(2,144) = 20.34, p<0.0001; Compound 3, F (2, 114) = 7.224, p=0.0011.
*
*
*
*
*
*
37 Figure 4. Dose-effect curves of compounds II and IX.
Concentration-response curves of compound II (A) or compound IX (B) on Na+
-dependent 45Ca2+ efflux in BHK cells expressing NCX1, NCX2 or NCX3. *, p < 0.05 vs
respective NCX2 and NCX3; §, p < 0.05 vs respective NCX1 and NCX3. Two-way
ANOVA followed by Newman-Keuls’ test. Compound II, F(2,127) = 41.08, p<0.0001; Compound IX, F (2, 62) = 8.027, p=0.0008.
*
*
*
§
38 Figure 5 Dose-effect curves of compound III.
Concentration-response curves of compound III on Na+-dependent 45Ca2+ efflux in BHK
39
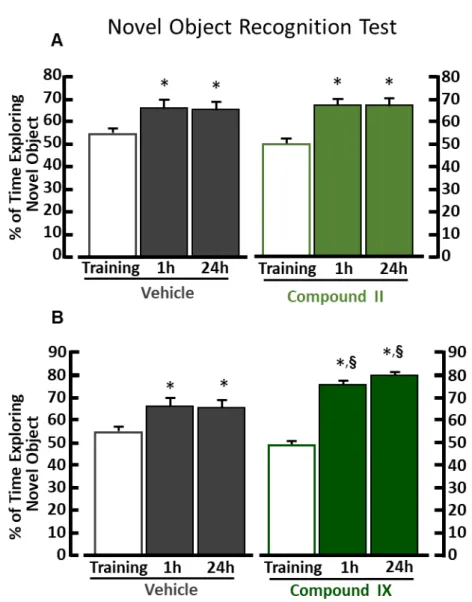
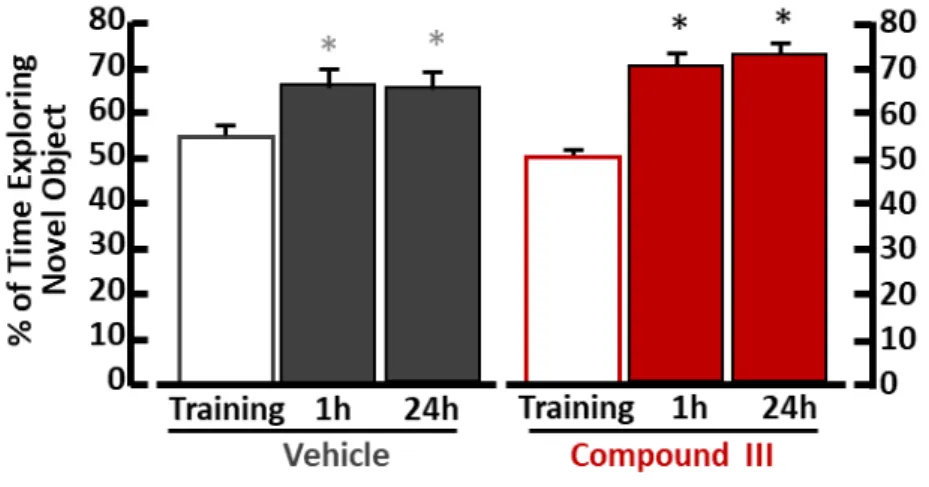
4.2 COMPOUNDS 2 AND IX AMELIORATE LEARNING AND MEMORY PERFOMANCE IN NOVEL OBJECT RECOGNITION TEST
Ten nM and 10 µM of each selected compound did not decrease mitochondrial activity on BHK cells as measured with MTT assay (Figure 6A). Moreover, a single i.p. injection of 32 µg/kg of compound 2, 3, II, III or IX did not cause body weight loss after one and two weeks (Figure 6B), signs of suffering, and evident toxic effects on several organs such as liver, kidney, pancreas and gut. Furthermore, the total distance travelled and the total time mobile in open field test ( Figure 7 A and B) and the latency to fall in rotarod test (Figure 9) did not reveal impairment of locomotor activity for mice treated with each compound. Moreover, compounds did not affect the number of entries in open zone and the percentage of time spent by mice in open zone of zero maze test (Figure 8 A and B).
In novel object recognition test each mouse group were equally motivated to explore the two objects during the training phase (Figure 10, Figure 11, Figure 12). One hour and 24 hours later, when one object was replaced with a new one, mice treated with compound 2 (Figure 10A) and compound IX (Figure 11B) spent more time exploring the novel object, as compared with vehicle-treated mice. Compound 3-treated mice ameliorated learning and memory performance only 24h after the training session (Figure 10B). On the other hand, mice treated with compound II (Figure 11A) and III (Figure 12) displayed the same performance of exploration of vehicle treated mice.
40
Figure 6. In vitro and in vivo toxicity evaluated for the five selected compounds.
(A) Mitochondrial activity of BHK cells incubated with vehicle, 10 nM or 10 µM of compounds 2, 3, II, III and IX. ANOVA followed by Tukey’s post-hoc test.
(B) Mouse weight measured 7 days or 14 days after a single i.p. injection of vehicle or 32 µg/kg of compounds 2, 3, II, III and IX. ANOVA followed by Tukey’s post-hoc test
41
Figure 7. Locomotor activity examined in the open field test.
(A) Quantification of total distance travelled in open field test in mice treated with vehicle (20.84m ± 0.86, n=15), compound 2 (21.65m ± 1.63, n=14), compound 3 (20.10m ± 1.38, n=15), compound II (18.26m ± 1.22, n=15) compound III (19.67m ± 1.05, n=15), compound IX (20.54m ± 1.05, n=15). ANOVA followed by Tukey’s post-hoc test.
(B) Quantification of total time spent moving in open field test expressed in seconds in mice treated with vehicle (178.03s ± 5.68, n=15), compound 2 (182.44s ± 7.9, n=14), compound 3 (174.01s ± 7.66, n=15), compound II (167.01s ± 8.6, n=15) compound III (172.00s ± 4.79, n=15), compound IX (179.33s ± 6.06, n=15). ANOVA followed by Tukey’s post-hoc test.
42 Figure 8. Anxiety levels examined in zero maze test.
(A) Results of number of entries in the open zone of zero maze apparatus in mice treated with vehicle (19.33 ± 0.81 n=15), compound 2 (22.57 ± 0.75 n=14), compound 3 (19.93 ± 1.13 n=15), compound II (20.93 ± 0.75 n=15) compound III (19.53 ± 1.42 n=15), compound IX (20.00 ± 1.02 n=15). ANOVA followed by Tukey’s post-hoc test
(B) Quantification of total time spend in the open zone of zero maze apparatus expressed as percentage of vehicle-treated control group vehicle (29.12% ± 1.89 n=15), compound 2 (29.91% ± 1.85 n=14), compound 3 (29.70% ± 1.66 n=15), compound II (28.45% ± 1.52 n=15) compound III (29.61% ± 1.88 n=15), compound IX (28.08% ± 1.60 n=15). ANOVA followed by Tukey’s post-hoc test.
43
Figure 9. Evaluation of locomotor activity with rotarod test.
Average of time latency to fall in wild-type mice treated with vehicle (27s ± 2.8 n=15), compound 2 (26s ± 2.4 n=14), compound 3 (24s ± 2.5 n=14), compound II (27s ± 2.8 n=15), compound III (24s ± 2.9 n=15) or compound IX (22 ± 2.1 n=15) in rotarod task. ANOVA followed by Tukey’s post-hoc test.
0 35 20 15 30 10 Lat en cy t o F al l ( s) 25 5
Vehicle
2
3
II
III
IX
Rotarod
44
Figure 10. Novel object recognition test of mice treated with compound 2 or 3.
(A) Mean exploratory preference during training session and each retention time in vehicle-treated (n=15) *p<0.05 vs training, ANOVA followed by Tukey’s post-hoc test. F(2,42) = 6,30, p=0.004 on the left; and compound 2-treated (n=14) mice. ANOVA followed by
Tukey’s post-hoc test. F(2,39) = 42,62, p<0.001 on the right. §, p<0.05 vs vehicle-treated
group, Unpaired Student’s t test.
(B) Mean exploratory preference during training session and each retention time in vehicle-treated (n=15) *p<0.05 vs training, ANOVA followed by Tukey’s post-hoc test. F(2,42) = 6,30, p=0.004 on the left; and compound 3-treated (n=15) mice*p<0.05 vs training,
ANOVA followed by Tukey’s post-hoc test. F(2,42) = 48,19, p<0.001 on the right. §,
45
Figure 11. Novel object recognition test of mice treated with compound II or IX.
(A) Mean exploratory preference during training session and each retention time in vehicle-treated (n=15) *p<0.05 vs training, ANOVA followed by Tukey’s post-hoc test. F(2,42) = 6,30, p=0.004 on the left; and compound II-treated (n=14) mice*p<0.05 vs training, ANOVA followed by Tukey’s post-hoc test. F(2,42) = 19,08, p<0.001 on the right.
(B) Mean exploratory preference during training session and each retention time in vehicle-treated (n=15) *p<0.05 vs training, ANOVA followed by Tukey’s post-hoc test. F(2,42) = 6,30, p=0.004 on the left; and compound IX-treated (n=15) mice*p<0.05 vs training,
ANOVA followed by Tukey’s post-hoc test. F(2,42) = 82,44, p<0.004 on the right. §,
46
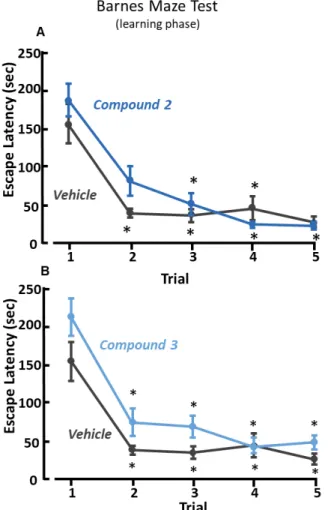
Figure 12. Novel object recognition test of mice treated with compound III.
Mean exploratory preference during training session and each retention time in vehicle-treated (n=15) *p<0.05 vs training, ANOVA followed by Tukey’s post-hoc test. F(2,42) = 6,30, p=0.004 on the left; and compound III-treated (n=14) mice*p<0.05 vs training, ANOVA followed by Tukey’s post-hoc test. F(2,42) = 29,25, p<0.001 on the right.
47
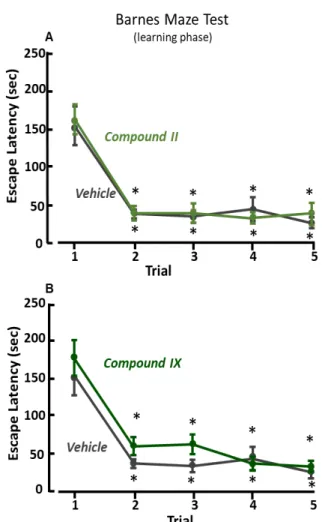
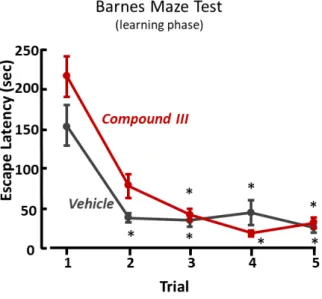
4.3 COMPOUNDS 2, II AND IX AMELIORATE SPATIAL MEMORY IN BARNES MAZE AND TRACE FEAR CONDITIONING TESTS
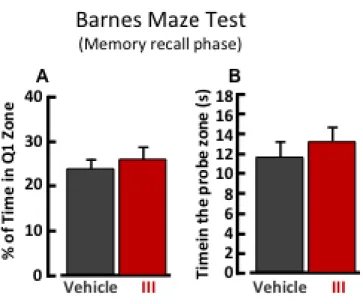
The treatment with compounds 2, 3 II, III or IX did not ameliorate spatial learning during trial 1-5 of Barnes maze test (Figure 13, Figure 14, Figure 15). Indeed, experimental groups treated with compound 2 or III required more time to find the escape box as compared with vehicle-treated mice on the trial two (Figure 13A, Figure 15). On the other hand, during the memory recall phase (trial 6) the escape box was removed, and mice previously treated with compound 2, II or IX spent significantly more time in the probe zone, where before was located the escape box, as compared with vehicle-treated mice (Figure 16 B, Figure 17 E). The treatment with compound 2, or II, induced an increase of the number of entries in the probe zone (Figure 16 C, Figure 17 C), but only mice treated with compound 2 significantly increased the time spent in the correct quadrant, Q1 (Figure 16 A). However, mice treated with compound 3, or III, did not ameliorate spatial memory during the trial 6 of Barnes maze test (Figure 16 D-E, Figure 18 A-B).
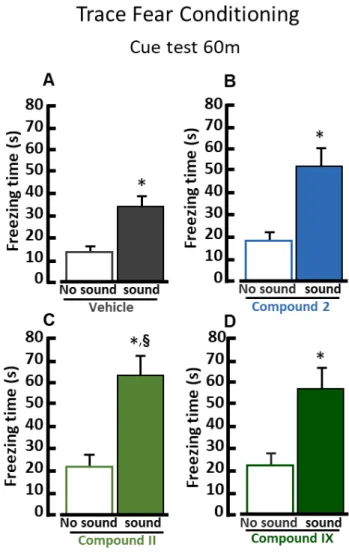
In the trace fear conditioning test compound 2-treated group increased fear response in the same environment where mice 30 minutes before received the foot-shock (context trial 30m) (Figure 19 A). Moreover, in the cue test, mice treated with compound II showed a significant increase freezing behavior in the new environment, when subjected to the acoustic stimulus (CS) 60 min training session (Figure 20 C). In addition, 24 h after the training session vehicle group did not recognize the CS whereas compounds 2, II and IX significantly increased freezing behavior when subjected to the CS in the new environment (Figure 21).
48
Figure 13. Learning phase of Barnes maze test in mice treated with compound 2 or 3.
Results of time to find the escape box during learning phase (trial 1-5) of Barnes maze test in compound 2-treated (n=15) (A) compound 3-treated (n=14) (B) and vehicle-treated (n=14) C57BL/6 mice. *, p<0.05 vs trial 1, ANOVA followed by Dunn’s post-hoc test. Treatment F(5,79)=1.5548, p=0.183.
49
Figure 14. Barnes maze test (learning phase) of mice treated with compound II and IX.
Results of time to find the escape box during learning phase (trial 1-5) of Barnes maze test in compound II-treated (n=15) (A), compound IX-treated (n=14) (B), and vehicle-treated (n=14) C57BL/6 mice. *, p<0.05 vs trial 1, ANOVA followed by Dunn’s post-hoc test. Treatment F(5,79)=1.5548, p=0.183
50
Figure 15. Barnes maze test (learning phase) of mice treated with compound III.
Results of time to find the escape box during learning phase (trial 1-5) of Barnes maze test in compound III-treated (n=15) and vehicle-treated (n=14) C57BL/6 mice. *, p<0.05 vs trial 1, ANOVA followed by Dunn’s post-hoc test. Treatment F(5,79)=1.5548, p=0.183
51
Figure 16. Barnes maze test (learning phase) of mice treated with compound 2 or 3.
(A and D) Quantification of time spend in Q1 during trial 6 by mice treated with vehicle (24.11% ± 1.73, n=14), compound 2 (31.77% ± 2.41, n=15) (A), or compound 3
(21.66% ± 2.44, n=14) (D). Time is expressed as percentage of test duration. §, p<0.05
vs vehicle treated mice, unpaired Student’s t test.
(B and E) Quantification of time spent in the probe zone by mice treated with vehicle
(11.61s ± 1.62, n=14), compound 2 (19.74s ± 2.39, n=15) (B), or compound 3 (14.07 ±
2.11, n=14) (E) during trial 6, expressed as percentage of test duration. §, p<0.05 vs
respective vehicle treated mice, unpaired Student’s t test.
(C) Results of the number of entries in the probe zone during trial 6 of Barnes maze test in vehicle (4.5 ± 0.7, n= 14) and compound 2 (8.27 ± 1.36, n=15) groups. Unpaired Student’s t test.
52
Figure 17. Barnes maze test (learning phase) of mice treated with compound II or IX.
(A and D) Quantification of time spend in Q1 during trial 6 by mice treated with vehicle (24,11% ± 1.73, n=14), compound II (29.62% ± 2.43, n=15) (A) or compound IX (28.48% ± 2.42, n=13) (D). Time is expressed as percentage of test duration.
(B and E) Quantification of time spent in the probe zone by mice treated with vehicle (11.61s ± 1.62, n=14), compound II (16.16 ± 1.42 n=15) (B) or compound IX (18.2s ± 2.78, n=13)
(D) during trial 6, expressed as percentage of test duration. §, p<0.05 vs respective
vehicle-treated mice, unpaired Student’s t test.
(C and F) Results of the number of entries in the probe zone by vehicle-treated (4.5 ± 0.7, n=14), compound II-treated (6.8 ± 0.63, n=15) (C) or compound IX-treated (6.46 ± 0.67, n=13) (F) mice during trial 6 of Barnes maze. Unpaired Student’s t test.
53
Figure 18. Barnes maze test (learning phase) of mice treated with compound III.
(A) Quantification of time spend in Q1 during trial 6 by mice treated with vehicle (24.11% ± 1.73 n=14) or compound III (26.27% ± 2.21 n=15). Time is expressed as percentage of test duration.
(B) Quantification of time spent in probe zone during trial 6 of Barnes maze by vehicle (11.61s ± 1.61 n=14) or compound III (13.06 ± 1.38 n=15) group.
54
Figure 19. Contextual fear conditioning for the three selected compounds.
(A, C and E) Quantification of freezing time of vehicle (n=24), compound 2 (n=24) (A), compound II (n=15) (C), and compound IX (n=15) (E) measured in the same environment where 30 minutes before they received a foot-shock during the training phase. Freezing
55
segment of vehicle group, ANOVA followed by Dunn’s post-hoc test. Treatment F(5,103) = 1.0404, p=0.398; Segment of Test F(4,412)=7.4888, p<0.0001.
(B, D and F) Quantification of freezing time in the same environment where vehicle (n= 24), compound 2 (n=24) (B), compound II (n=15) (D), and compound IX (n=15) (F) groups received the foot-shock 4 days before. Freezing time is expressed as total seconds in freezing behavior. Treatment F(5,83) = 1.9952, p=0.088; Segment of Test F(4,332)=31.2681, p<0.0001.
56
Figure 20. Cue trial (1h) of trace fear conditioning test for the three selected compounds.
(A) Quantification of freezing behavior in a new environment, 1h after the training, under basal conditions (empty histogram) and in presence of the CS (full histogram) for mice treated with vehicle (13.81s ± 2.22, 34.37s ± 4.63, n=25). *, p<0.05 vs vehicle group “no sound”, unpaired Student’s t test.
(B) Quantification of freezing behavior in a new environment, 1h after the training, under basal conditions (empty histogram) and in presence of the CS (full histogram) for mice treated with compound 2 (18.61s ± 3.27, 52.04s ± 7.6 n= 24). *, p<0.05 vs “no sound” group, unpaired Student’s t test.
(C) Quantification of freezing behavior in a new environment, 1h after the training, under basal conditions (empty histogram) and in presence of the CS (full histogram) for mice
57
treated with compound II (20.76s ± 4.87, 61.59s ± 8.94 n=15). *, p<0.05 vs “no sound”
group, unpaired Student’s t test. §, p<0.05 vs “sound” group, unpaired Student’s t test.
(D) Quantification of freezing behavior in a new environment, 1h after the training, under basal conditions (empty histogram) and in presence of the CS (full histogram) for mice treated with compound IX (22.81s ± 5.41, 56.84 ± 9.67, n=15). *, p<0.05 vs “no sound” group, unpaired Student’s t test.
58
Figure 21. Cue trial (24h) of trace fear conditioning test for the three selected compounds.
(A) Quantification of freezing behavior in a new environment, 24h after the training, under basal conditions (empty histogram) and in presence of the CS (full histogram) for mice treated with vehicle (31.68s ± 4.53, 39.47s ± 5.07 n=20).
(B) Quantification of freezing behavior in a new environment, 1h after the training, under basal conditions (empty histogram) and in presence of the CS (full histogram) for mice
treated with compound 2 (50.33s ± 5.31, 63.54s ± 6.97 n=19). §, p<0.05 vs vehicle
“sound” group, unpaired Student’s t test; #, p<0.05 vs vehicle “no sound” group, unpaired
Student’s t test.
(C) Quantification of freezing behavior in a new environment, 1h after the training, under basal conditions (empty histogram) and in presence of the CS (full histogram) for mice treated with compound II (39.07s ± 8.48, 73.89s ± 11.69 n=15). *, p<0.05 vs “no sound”
59
control group, unpaired Student’s t test; §, p<0.05 vs vehicle “sound” group, unpaired
Student’s t test.
(D) Quantification of freezing behavior in a new environment, 1h after the training, under basal conditions (empty histogram) and in presence of the CS (full histogram) for mice
treated with compound IX (53.43s ± 7.73, 59.18s ± 7.42, n= 15). §, p<0.05 vs vehicle
60
4.4 COMPOUND 2 SELECTIVELY INCREASES NCX1 ACTIVITY
Analysis of Na+ dependent-45Ca2+ efflux in BHK cells singly transfected with each NCX isoform showed that 10 nM of compound 2 selectively increases NCX1 activity (Figure 22). Moreover, concentration-effect curve performed with fura-2 techniques displayed an EC50 in the low nanomolar range (1.4 nM) for compound 2 (Figure
23B). The stimulatory effect of compound 2 in NCX1 activity was also confirmed by patch clamp in whole cell configuration technique in both forward and reverse modes of operation (Figure 24 A and B). Compound 2 till the concentration of 10 μM did not affect ASIC1a currents (Figure 25), a channel involved in the control of anxiety and spatial memory and that is also regulated by several drugs targeting NCX1.
61
Figure 22. Compound 2 selectively increases NCX1 activity.
Quantification of NCX1, NCX2 and NCX3 activity measured trough Na+-dependent 45Ca2+
62
Figure 23. Concentration-response curve of compound 2 on NCX1 activity measured by
Fura-2 technique.
(A) Superimposed traces representing the effect of compound 2 or vehicle on Na+
-free-induced [Ca2+]i increase in BHK-NCX1 cells.
(B) Quantification of the effect of compound 2 on NCX1 activity measured by single-cell Fura-2 AM microfluorimetry in BHK-NCX1 cells (n=60 cells for each group). Data are
calculated as ∆% of plateau/basal [Ca2+]
i values after Na+ free addition. §, p<0.05 vs
vehicle and 1 nM, §§, p<0.05 vs all groups, ANOVA followed by Student-Newman-Keuls