CAMPUS DI CESENA DIPARTIMENTO DI
INGEGNERIA DELL’ENERGIA ELETTRICA E DELL’INFORMAZIONE “GUGLIELMO MARCONI”
CORSO DI LAUREA MAGISTRALE IN INGEGNERIA BIOMEDICA
THE EFFECT OF INTERVERTEBRAL DISC SIMULATED
DAMAGE ON THE HUMAN SPINE BIOMECHANICS.
(L'effetto della simulazione del danneggiamento del disco intervertebrale sulla biomeccanica della colonna vertebrale umana)
Tesi in
MECCANICA DEI TESSUTI BIOLOGICI LM
Relatore Presentata da
Chiar.mo Prof. Luca Cristofolini Sara Montanari
Co-Relatore
M. Eng. Chloé Techens
Sessione III
A chi rallenta, ma, nonostante le difficoltà, non si ferma e arriva al traguardo.
Contents
ABSTRACT ... 7
RIASSUNTO ... 9
Chapter 1
INTRODUCTION ... 11
1.1 Anatomy of the human spine ... 12
1.1.1 Intervertebral discs ... 13
1.2 Intervertebral disc tears ... 15
1.2.1 Types of lesions ... 15
1.2.2 Intervertebral disc tears: state of the art ... 16
1.3 Strains measurements over the disc surface ... 17
1.3.1 Digital Image Correlation ... 18
1.4 A recent surgical treatment: Percutaneous Cement Discoplasty ... 19
1.5 Aim of the study ... 20
Chapter 2
MATERIALS AND METHODS ... 21
2.1 Specimens preparation ... 21
2.1.1 CT scans of the specimens ... 22
2.1.2 Cleaning of the specimens ... 22
2.1.3 Alignment of the specimens ... 23
2.1.4 DIC Speckle Pattern ... 25
2.1.5 Defects of the disc ... 27
2.1.6 CT measurements ... 29 2.2 Mechanical tests ... 31 2.2.1 Testing set-up ... 31 2.2.2 Testing protocol ... 32 2.2.3 Data acquisition ... 35 2.3 Data Analysis ... 36 2.4 Statistical Analysis ... 37
Contents
Chapter 3
RESULTS ... 39
3.1 Stiffness ... 39 3.2 Range of Motion ... 45 3.3 Strain distribution ... 49 3.4 Disc height ... 55Chapter 4
DISCUSSION ... 57
LIMITATIONS OF THE STUDY ... 61
Chapter 5
CONCLUSIONS ... 63
APPENDIX A ... 65
‘Literature Review on annulus tears, in details’
APPENDIX B ... 69
‘Average, minimum and maximum values of tensile and compressive strains over the disc surface in flexion and extension’
REFERENCES ... 73
Abstract
More than 50% of intervertebral discs in the third and fourth decade of life exhibit annular tears and fissures with different orientations and extents. On the other hand, in vitro biomechanical investigations of the disc surgery treatment, sometimes requires collaterals lesions, such as incision or disc material removal to recreate biological injuries, as in discoplastly. These lesions could have a mechanical impact on the spine flexibility and in the surrounding tissue and could alter the final outcomes of in vitro studies.
The influence of the presence of lesions on the biomechanics of the segment is still a debated research question.
Thus, this in vitro study aims to evaluate changes in spine biomechanics, in terms of stiffness, range of motion and disc height, induced by an increasing damage of human disc. In order to assess the impact of the annulus damage on the surrounding tissues, principal strain distributions were investigated in the lateral side opposite than the damaged region.
Eight fresh cadaver thoraco-lumbar FSUs were used in this study. The specimens were tested sequentially in flexion and extension in five different configurations: a) with the intact disc; b) with two vertical cuts; c) with four cuts, forming a square, without removing any part of the annulus; d) after having removed the cut part of the AF; e) after having removed the nucleus pulposus. Image analysis and surface strain distribution were performed on the lateral disc by means of the Digital Image Correlation.
Results showed that the IVD simulated damage of this study did not alter significantly the spine biomechanics: neither bending stiffness nor range of motion. The main effect caused by nucleotomy was the disc height reduction due to the lack of support caused by the nucleus loss. The strain distribution on the disc surface reflected the different vertebrae behavior related to their location in the spine. In both thoracic and lumbar segments, strains significantly changed in the last defect configuration, concentrating strains on smaller regions such as the mid-height line of the disc or along the endplates.
Riassunto
Più del 50% dei soggetti tra i trenta e quaranta anni presenta lesioni nell’anello fibroso dei dischi intervertebrali della spina dorsale. Anche studi in vitro, che mirano a valutare gli effetti di trattamenti chirurgici del disco intervertebrale sulla biomeccanica del rachide, possono richiedere lesioni, come incisioni o l’asportazione di parte del tessuto dell’anello fibroso, per ricreare le lesioni biologiche che sono oggetto di investigazione, come nel caso della discoplastica. Queste lesioni potrebbero avere un impatto meccanico sulla colonna vertebrale e sui tessuti circostanti e potrebbero quindi compromettere i risultati finali dello studio in vitro.
Le conseguenze della presenza di lesioni sul disco intervertebrale sul comportamento meccanico della spina dorsale rappresentano ancora oggi una questione di dibattito aperta. Questo studio in vitro ha quindi lo scopo di valutare gli effetti biomeccanici della colonna vertebrale, in termini di stiffness, range of motion e altezza del disco, come conseguenza di un crescente danneggiamento del disco. Inoltre per valutare come il danneggiamento dell’anello fibroso del disco si ripercuote sui tessuti circostanti, sono state analizzate le mappe di distribuzione delle deformazioni sul lato opposto alla regione danneggiata. In questo studio sono stati utilizzati otto segmenti di rachide umano costituiti da vertebre toraciche e lombari. I provini sono stati testati sequenzialmente in flessione ed in estensione in cinque diverse configurazioni: a) con il disco intervertebrale intatto; b) con due tagli verticali nell’anello fibroso; c) con quattro tagli, formando così un quadrilatero, lasciando la parte tagliata in situ, d) dopo aver rimosso la parte di anello fibroso precedentemente tagliata; e) dopo aver rimosso il nucleo polposo. L’analisi delle distribuzioni delle deformazioni è stata eseguita nella regione del disco opposto alle lesioni, tramite l’utilizzo della Digital Image Correlation.
I risultati hanno mostrato come i danneggiamenti del disco, simulati in questo studio, non hanno alterato in maniera significativa né la stiffness né il range of motion dei segmenti analizzati. Il primo effetto osservato dopo la nucleotomia è stato la riduzione dell’altezza del nucleo, a causa della mancanza del supporto interno dovuto alla perdita del nucleo. La distribuzione delle deformazioni sulla superficie del nucleo rispecchia il diverso
Riassunto
comportamento delle vertebre in relazione alla loro posizione nel rachide. Sia nel caso di segmenti toracici che lombari è stato possibile osservare un significativo cambiamento della distribuzione delle deformazioni dopo l’esecuzione dell’ultimo difetto, che ha portato alla concentrazione delle deformazioni in piccole regioni come il centro del disco o lungo gli endplates.
Chapter 1
Introduction
The intervertebral disc impacts significantly in load distribution on the adjacent vertebral bodies and in the entire spine motion [Newell et al., 2017].
An analysis of midsagittal sections of cadaveric specimens, conducted by Krismer et al, 1997, showed that more than 50% of intervertebral discs in the third and fourth decade of life exhibit annular tears and fissures with different orientation and extents.
Also, in vitro biomechanical investigation of the disc surgery treatment, requires sometimes collateral lesions, such as incision or disc material removal, to recreate a particular biological condition, as in Percutaneous Cement Discoplasty. These lesions could have a mechanical impact on the spine stability and on the surrounding tissue and could alter the final outcomes of the in vitro study.
The consequences and influence of the presence of lesions on the biomechanics of the motion segment are still a debated research question.
It is generally admitted that the disc disruptions and tears are the main factors responsible for the clinical instability [Kirkaldy-Willi et Farfan, 1982] but this statement is not supported by available biomechanical studies [Galbusera et al., 2014]. For example, Tanaka et al., 2001, showed an increased flexibility of human spine segments exhibiting biological radial tears, but the simultaneous presence of other degenerative changes in the investigates specimens did not allow to distinguish the specific mechanical effect of tears. Thompson et al., 2000, observed a correlation between rim lesions and reduced stiffness in flexion and extension which may be linked to a loss of nucleus pulposus pressure. Thompson et al, 2004, determined the mechanical effect of individual concentric tears, radial tears and rim lesions of the ovine annulus, but in their study subsequent tears were introduced in locations that minimized communication between lesions.
Chapter 1 - Introduction
Therefore, as Galbusera et al., concluded in their work in 2014, although the literature suggested that the degenerative changes of the intervertebral disc and surrounding structures lead to subtle alterations of the mechanical properties of the functional spinal unit (FSU), supporting a general increase of spinal instability with disc degeneration could not be found.
1.1 Anatomy of the human spine
The spine is the supporting structure of human body and it has three main biomechanical functions:
It supports loads and transfers weights and resulting bending moments of head, trunks and pelvis providing structural support and balance to maintain an upright posture;
It allows the physiologic movements of head, trunk and pelvis, and, in particular, it allows the relative rotation between the vertebral bodies while preventing their translation;
It protects spinal cord, nerve roots and several of the body’s internal organs and it reduces the transmission of accelerations from the lower limbs to the internal organs.
The spine consists of 33 vertebrae which according to their position are subdivided into cervical (7 vertebrae, C1 . C7), thoracic (12 vertebrae, T1 – T12), lumbar ( 5 vertebrae, L1 – L5), sacrum (5 fused vertebrae) and coccyx (4 fused vertebrae) (Figure 1.1).
A vertebra consists in two essential parts: the body, the anterior segment;
the vertebral or neural arch, the posterior part, which consists in two pedicles and two laminae, and supports seven processes: four articular, two transverse and one spinous;
Figure 1.1-
These two parts enclose a foramen, called the vertebral foramen. The vertebral foramina constitute canals for the protection of the spinal cord. The intervertebral foramina are two apertures between every pair of vertebrae, one on either side, for the transmission of the spinal nerves and vessels [Gray, 2016], (Figure 1.2).
Vertebrae are connected by intervertebral disc and ligaments.
1.1.1 Intervertebral discs
Intervertebral discs (IVDs) are the main joints of the spinal column and represent one-third of its height. Their major role is mechanical, as they constantly transmit loads arising from body weight and muscle activity through the spinal column. They provide flexibility to the spine , allowing spine motion. The intervertebral discs are complex structures that consist in a thick outer ring of fibers called the annulus fibrosus (AF), which surrounds a more gelatinous core known as the nucleus pulposus (NP); the nucleus pulposus is interposed inferiorly and superiorly by cartilage endplates (Figure 1.3).
Figure 1.3 -A cut out portion of an intervertebral disc [Prithvi Raj, 2008].
Chapter 1 - Introduction
The annulus fibrosus is composed of a series of 15 to 25 concentric lamellae of fibrocartilage, with the collagen fibers lying parallel within each lamella. The lamellae are approximately 0.05-0.5 mm thick, and the thickness increases from outer to inner layer. Approximately 48% of the lamellar layers are circumferentially incomplete and the percentage of incomplete layers increase with age. [Newell et al., 2017]. The fibers are oriented approximately 60° to the vertical axis , alternating between the left and right orientation in adjacent lamellae. Elastin fibers lie between the lamellae, helping the disc to return to its original arrangement following bending [Prithvi Raj, 2008].
The nucleus pulposus forms the core of the intervertebral disc and it is located slightly posteriorly as the lamellae of the annulus fibrosus are thinner and less numerous in the posterior side [Adams et al., 2014]. The NP is a gelatinous structure that accounts for 40-50% of the volume of the adult disc and 25%-40-50% of the transverse cross-sectional area. The NP has such a high water content that it exhibits a hydrostatic pressure which increases in response to compressive loading, and this pressure generates tension in the surrounding AF. Its main constituents are proteoglycan, collagen and water [Newell et al., 2017].
The boundary between NP and AF is very distinct in the young individuals; but during growth and skeletal maturation, it becomes less obvious, and increasing age the nucleus generally becomes more fibrotic and less gel-like [Prithvi Raj, 2008].
Finally, the cartilage endplates are a thin horizontal layer of hyaline cartilage. These interface the disc and the vertebral bodies. The collagen fibers run horizontal and parallel to the vertebral bodies, with the fibers continuing into the disc [Prithvi Raj, 2008].
The mechanical functions of the disc are given by the extracellular matrix of the annulus; its composition and organization govern the disc’s mechanical responses. The main mechanical role is provided by the two major macro-molecular components (Figure 1.4):
Collagen, present mostly as type I and type II fibrils; it provides tensile strength to the disc and anchors the tissue to the bone;
Proteoglycan, which is the responsible for maintaining tissue hydration and gives the osmotic pressure to the nucleus. The proteoglycan and water content of the nucleus is larger than in the annulus.
Figure 1.4 - Biochemical composition of the nucleus [Prithvi Raj, 2008].
1.2 Intervertebral disc tears
1.2.1 Types of lesions
Annular lesions are feature of IVD degeneration and that may precede morphological changes in the nucleus (Osti et al., 1990) and instigate changes in cellular activity that are consistent with IVD degeneration.
Annular lesions are defined as disruption of the arrangement of the annular fibers and can be distinguished in (Figure 1.5):
Concentric tears: circumferential lesions found in the outer layers of the annulus which represent splitting between adjacent lamellae of the annulus [Adams et al., 2014]; they are most prominent in the anterior periphery of the disc [Thompson et al., 2004];
Radial tears: irregular radial fissures that begin within the center of the disc (NP) and progress in radial direction either in the transverse plane or in a cranio-caudal direction [Adams et al., 2014]. They tend to appear in the posterior or postero-lateral part of disc [Thompson et al., 2004];
Rim lesions: are defined as a separation of the outer annulus from the vertebral rim of the adjacent vertebral body. They more commonly happen in the anterior annulus [Thompson et al., 2004].
Chapter 1 - Introduction
Figure 1.5 - Annular tears [Thompson et al., 2004].
1.2.2 Intervertebral disc tears: state of the art
A literary review was performed in order to understand how, in the last years , research tried to understand the damaged disc behavior simulating lesions on it.
Only in vitro human works were taken into account, excluding animal studies and finite element models, as shown in details in Appendix A
The majority of the studies removed partially or totally the nucleus pulposus from the disc postero-lateral region, only Goel et al., 1986, incised the posterior side of the disc, and Tencer et al., 1982, created staggered horizontal cuts around the disc circumference, near both endplates.
Lee et al., 2018, and Shea et al, 1994, made a circular hole in the annulus; whereas a square or a rectangular window was realized by Bostelmann et al., 2015, Kuroki et al, 2004, Seroussi et al., 1989, and by Panjabi et al., 1984.
All the other authors impacted the annulus fibrosus with different types of lesions: with a cruciform incision (Cleason et al., 2019, Showalter et al., 2014, O’Connell et al., 2011), an oblique incision oriented along the fiber direction (Heuer et al. in 2007 and 2008, and Krismer et al. in 1996), an horizontal incision (Ivicsics et al., 2014, and Goel et al., 1986) or with a vertical cut in Frei et al, 2001,. study.
In almost all the studies, the spine segment was loaded with an axial compression, or under pure bending in flexion and extension in some cases.
Many studies recorded the intradiscal pressure to register pressure variations inside the disc due to annulus fenestration and nucleus removal.
Range of motion was computed in six studies (Lee et al., 2018, Bostelmann et al., 2015, Heuer et al., 2008, Heuer et al., 2007, Kuroki et al., 2004, and Goel et al., 1986). In all cases pins, markers and dial gauges were attached on the vertebral bodies, and their displacements were tracked by 3D motion analysis system or laser scanner. Heuer et al, 2007, used a rotational potentiometers.
Internal disc deformation field and disc surface strains were both mainly acquired by imaging system as MRI (Cleason et al, 2019, Showalter et al., 2014, O’Connell et al., 2011) and laser scanner (Heuer et al., 2008). Only Frei et al, 2001, used triaxial strain gauges.
Load and displacement data were mainly acquired by displacement sensors, LVDT and potentiometers transducers.
1.3 Strains measurement over the disc surface
Strains analysis over the intervertebral disc surface has been a challenge through the years.
Although strain gauges are not recommended on the intervertebral disc because the discs have a low elastic modulus, few studies in literature used this method [Frei et al, 2001; Gustafson et al, 2016].
In general, due to the disc composition, studies that have been carried out to measure strains have used image-based methods. Heuer et al., 2008, used a laser scanner to acquire surface roughness, O’Connell et al., Showalter et al., and Cleason et al., used a MRI system. Similarly, Karakolis et Callaghan, 2015, extracted strains distribution by means of high resolution images.
Spera et al, in 2011, proposed a Stereo-Digital image correlation: a full-field measurement system recordings over more than 180° of the IVD surface was achieved by sequentially moving a single camera through fixed positions in order to cover the desired angle of vision. Their method does not seem applicable to segment comprising both hard and soft tissue [Ruspi et al., 2017].
Chapter 1 - Introduction
Recently, the feasibility of measuring the full-field strain distribution in the vertebrae and disc by means of Digital Image Correlation was successfully demonstrated [Palanca et al., 2018].
1.3.1 Digital Image Correlation
The Digital Image Correlation (DIC) is a contact-less, non invasive optical method for measuring surface displacement and strain of materials subjected to mechanical stress [Palanca et Brugo, 2015]. The method compares two images of the same specimen before and after deformation, acquired by mean of one (to obtain a two-dimensional outcome) or two cameras. Through two cameras, a three-dimensional outcome is obtained exploiting the concept of stereoscopic view of human vision: the final image is gained by merging two projection of the same scene obtained from two different points of view. The specimen must be illuminated by white homogeneous lights during the test (Figure 1.6). An accurate calibration of the image system prior to the measurements is a crucial point for ensuring the reliability of the measured data [Siebert et al., 2007].
Figure 1.6 - A schematic plot of a DIC testing setup [Liao et al., 2014].
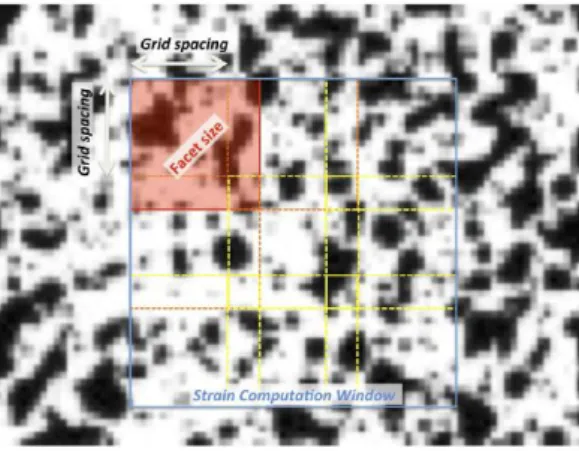
The correlation of digital images is based on the acquisition of a set of frames of the specimen at various stages of deformation (from the unload condition, the reference, to the stressed condition). The specimen surface is covered with a randomized speckle pattern, which is applied as a stochastic texture to the object before the measurements. After the acquisition, each object point on the specimen surface is identified based on the pattern [Siebert et al., 2007]. A correlation algorithm identifies corresponding points in the two cameras images by subdividing the first camera image into small sub-images, called facet. The correlation algorithm determines a suitable transformation of each of the
facets, which matches the homologous area in the second camera image. These transformations are determined for every loading step of the specimen under test. The displacement field is then computed, and subsequently, the strain filed is obtained by derivation. The size and the spacing (grid spacing) of these facets can be varied, influencing accuracy and speed of evaluation [Palanca et al., 2016] (Figure 1.7).
Figure 1.7 – Detail of the specimen surface prepare with a random speckle pattern
with facet parameters highlighted [Palanca et al., 2016].
1.4 A recent surgical treatment: Percutaneous Cement Discoplasty
Percutaneous Cement Discoplasty (PCD) is a novel minimally invasive technique fror the treatment of ‘vertical instability’ (dynamic foraminal stenosis) in patient who are not suitable for a more invasive surgical procedure, such as the gold standard treatment of degenerative disc disease.
Varga et al., presented this technique in 2015, as a surgical treatment to recover the disc height and free the nerve after its compression due to the vacuum phenomenon inside the intervertebral disc resulting in the collapse of the adjacent vertebra. PCD consists in filling the empty disc with an injection of acrylate cement. Varga et al., 2015, reported their clinical study on 47 patients showing a significant improvement of their quality of life. Sola et al., 2018, presented a surgery of a patient treated with PCD, and the following year, Kiss et al., 2019, showed the recovery of the lumbar alignment in 27 patients after a discoplasty surgery.
Thus, only few studies in literature report PCD surgery cases, and the impact of this new technique on the human spine biomechanics has not yet been investigated.
Chapter 1 - Introduction
An ongoing study [Techens et al., 2020] assessing mechanical consequences of PCD on lumbar spine stability, simulated the vacuum degenerated disc with an annular fenestration and a manual nucleus pulposus removal.
The influence of this disc damage on the AF behavior and the spine biomechanics is unknown.
1.5 Aim of the study
Because of the consequences of lesions presence of on the biomechanics of the motion segment are still not clear, this work aimed at enlarging the knowledge about this research question.
The aim of this in vitro study was to evaluate changes in spine flexibility, in terms of stiffness, range of motion and disc height, as a consequence of sequentially increasing the IVD damage, in order to:
i. Elucidate if there is a specific degree of damage where the biomechanics of the IVD is substantially altered;
ii. Explore the artifacts induced by simulated disc lesions, e.g. when studying discoplasty.
In addition, the impact of the annulus damage on the surrounding tissues was assessed using Digital Image Correlation to study the surface strains.
Chapter 2
Materials and Methods
This in vitro study has been conducted at the laboratory of Biomechanics of the Department of Industrial Engineering (University of Bologna).
For this study eight thoraco-lumbar spine segment were prepared simulating five disc defect configurations, starting from the intact disc and increasing the damage until the complete removal of the NP. All the specimens were tested sequentially in flexion and extension in all configurations with repeated measurements. DIC was used to acquire true principal strain distributions on the disc surface. Disc height was measured on the DIC images. In addition, Range of Motion and stiffness were computed to analyze the flexibility of the spine. Statistical analysis was performed to assess the result significance.
2.1 Specimens preparation
Fresh cadaver thoraco-lumbar functional spine units (FSUs) were used in this study, under ethical committee approval. A FSU consists of two adjacent vertebrae with the intervertebral disc and ligaments intact between them; it is a common specimen length used for modeling the mechanical behavior in a given region of the spine [Wilke et al., 1998]].
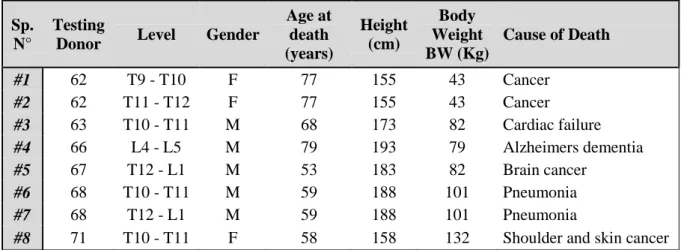
The spines, coming from six donors aged from 53 to 77years old, were separated into eight FSU testing specimens. (Table 2.1).
Sp. N°
Testing
Donor Level Gender
Age at death (years) Height (cm) Body Weight BW (Kg) Cause of Death #1 62 T9 - T10 F 77 155 43 Cancer #2 62 T11 - T12 F 77 155 43 Cancer #3 63 T10 - T11 M 68 173 82 Cardiac failure #4 66 L4 - L5 M 79 193 79 Alzheimers dementia #5 67 T12 - L1 M 53 183 82 Brain cancer #6 68 T10 - T11 M 59 188 101 Pneumonia #7 68 T12 - L1 M 59 188 101 Pneumonia
#8 71 T10 - T11 F 58 158 132 Shoulder and skin cancer
Chapter 2 – Materials and Methods
2.1.1 CT scans of the specimens
Before starting the specimens cleaning, CT scans were performed for all the spines, except the #6 and #7. CT scans were performed in a private hospital at Villalba (BO), and images were acquired by the scanner Aquilion, ONE, Toshiba, with a current of 200mA, a voltage of 120 kV and a 0.5 mm voxel. CT scans were observed to:
Assess the initial condition of the specimens; Chose the exact levels for the study;
Compute the offset for the load application;
From the CT images a fusion at the IVD level was seen between the T11 and T12 vertebrae in the specimen #2 and a fracture of the posterior process was discovered in the L5 and T10 vertebrae, on the #4 and #8 spine, respectively.
2.1.2 Cleaning of the specimens
The FSUs were prepared in accordance with accepted procedures defined by Wilke et al.,1998. All the specimens were stored sealed in a double plastic bags at -28°C; these storage conditions do not have any effect on viscoelastic biomechanical properties [Panjabi et al., 1985].
After having thawed the specimens in water at room temperature, the whole specimens were grossly cleaned detaching the most of soft tissues (skin, fat and muscles) covering the bone by surgical spoons and pincers (Figure 2.1). At this point, it was easier to identify the levels of interest, so the FSUs were separated cutting through the intervertebral disc adjacent to the vertebral bodies using the scalpel and the saw (Figure 2.1). FSUs cleaning war completed detaching the smallest part of soft tissues by scalpel and forceps, taking care to leave intact the anterior longitudinal ligament, the posterior longitudinal ligament, and the facet joints.
Figure 2.1 – Surgical instruments used for the specimens cleaning:
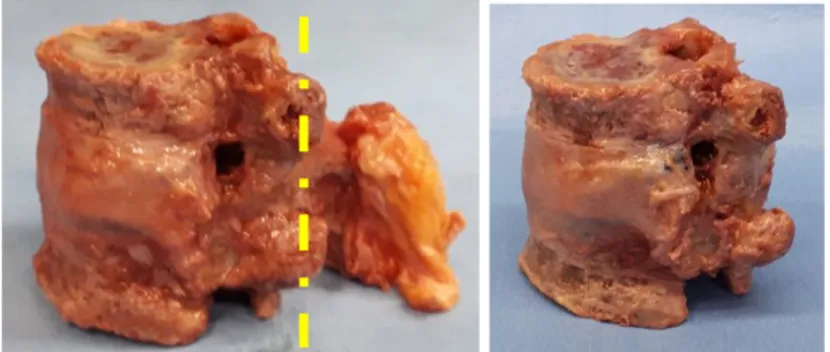
Because of the broken posterior processes (PP) of two FSUs, the PP were cut in all the specimens, to have the same condition for all of them. Posterior processes were cut at the facet joints level (Figure 2.2), in this way a small part of the PP and of the interspinous ligament kept, while the supraspinous ligament was totally removed. In addition bone fusion and ostheophytes were removed in the specimen #1 and #2 without damaging the disc.
Figure 2.2- FSU after the cleaning procedure. Left: FSU with the
posterior process and the supraspinous ligament intact; the yellow line is the cut level to remove the PP. Right: FSU after the PP cut.
2.1.3 Alignment of the specimens
To ensure that the specimen can be mounted in the testing machine in a repeatable way [WIlke et al., 1998] and that mechanical loading is applied appropriately to all the FSUs [Newell et al., 2017], it is important for motion segments to be secured in a fixative pot. In order to facilitate the anchoring of the specimen to the pot, all the soft tissues were removed from the vertebral endplates and cortical surfaced to within at least 1 cm of the endplates margins (Figure 2.3). In addition, screws were partially inserted into the cortical bone at cranial and caudal extremities (Figure 2.3), so that the screws heads were embedded in the cement. One, two or three screws were inserted in each extremity according to the size of the vertebral body and the surface of the endplate.
Figure 2.3 - Specimen with screws in the vertebral body extremity;
Chapter 2 – Materials and Methods
Indeed, in order to test the specimen under the same conditions of load the FSUs were aligned with the intervertebral disc horizontal following a reproducible and suitable procedure already existing.
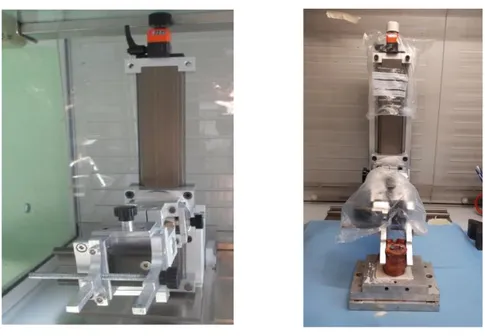
To obtain a stable alignment with the horizontal disc either in the frontal view either in the lateral view a 6 Degree of Freedom (DoF) test system (Figure 2.4) was used. One extremity of the FSU was clamped with the anterior side in front of the operator on the 6 DoF test system. With the help of a caliper the middle line of the disc was marked; that was aligned horizontally in the transverse plane. Then it was aligned horizontally also in the sagittal plane.; using the set square and the horizontal rules.
Figure 2.4 - Left: 6 DoF system;
Right: specimen clamped in the 6 DoF and embedded into cement inside a metallic pot.
Then the specimen was embedded into cement for 20 minutes, inside a metallic pot with a square hole (Figure 2.4). After the cement hardened, the specimen was turned clamping the cemented extremity on the 6 DoF. The previous procedure was repeated aligning upper and lower pots using the square set to be sure to have both pots horizontal and parallel.
Both extremities of the FSUs were potted with radiopaque Tecres cement, by mixing cement powder (PMMA) and the related monomer (MMA) in a ratio of 2:1.
In this way two cemented basis parallel to each other at both extremities of each FSU were created, with the horizontal intervertebral disc (Figure 2.5).
Figure 2.5 - FSU with the cemented basis at both extremities.
2.1.4 DIC Speckle - Pattern
In order to measure surface strains of specimens with Digital Image Correlation (DIC) system a white-on-black speckle pattern was sprayed on the
lateral side of the specimens. The side was chosen randomly, but attention has been paid to having, finally, half specimens with the left side painted and the other half with the pattern on the right side (Table 2.2). This was important to avoid that results depend on the side where defects were executed or on the side where the deformations were acquired.
The dark background was prepared painting the lateral side of the FSUs with a saturated solution of methylene blue, obtained mixing 25 ml of water and 1 g of methylene blue powder (Farmalabor).
Three layers of paint were deposited on the specimen with a soft brush to be sure the background was dark enough without impacting the properties of the disc [Palanca et al., 2018] (Figure 2.6).
Figure 2.6 - Specimen with the blue background.
Sp. N° Background side #1 Left #2 Left #3 Left #4 Right #5 Right #6 Right #7 Right #8 Left
Table 2.2 – Painted side
Chapter 2 – Materials and Methods
In order to apply the speckle-pattern on the specimen’s surface an airbrush gun (AZ3 THE 2, nozzle 1.8 mm, Antes Iwata, Italy) (Figure 2.7) was used with a solution of water-based paint (Q250201 Bianco Opaco, Chrèon, Italy) and
water.
Dot size have been previously optimized [Ruspi et al., 2018] in order to reach the 50:50 proportion of black-white color ( every single dots should have a dimension of 3-5 pixels). According to specimen sizes and lenses used:
20 ml of white paint were mixed with 8 ml of water; The air pressure was set at 1 bar;
The airflow knob of the airbrush gun was opened with 4 turns (Figure 2.7);
The white paint was sprayed holding the airbrush around 30 cm from the specimen.
The optimized pattern resulting is shown in the figure below (Figure 2.8).
Figure 2.8 - Speckle pattern on the lateral side of the specimen.
Figure 2.7 - Airbrush
gun; the red circle markes the airflow knob.
2.1.5 Defects of the disc
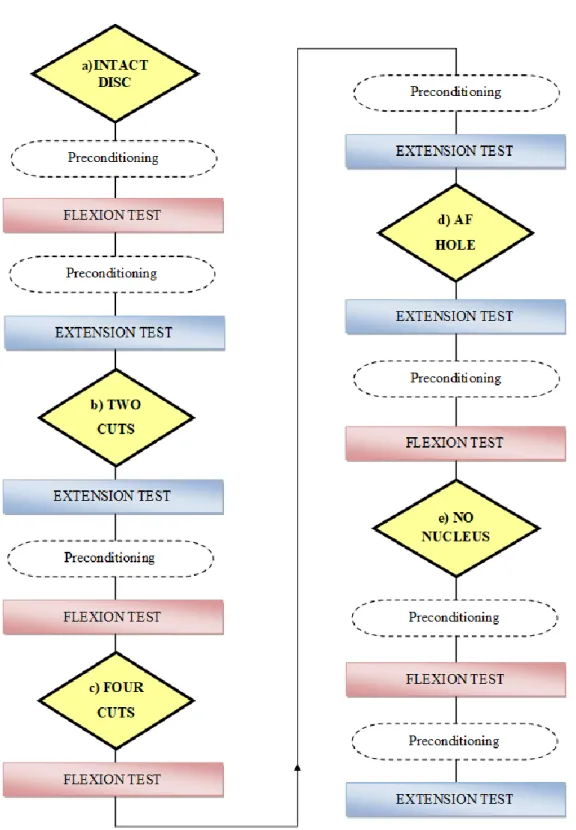
In order to explore how disc defects and lesions impact the spine biomechanics, the IVD tears (Figure 2.9) were gradually increased, starting from the intact disc as control condition.
Figure 2.9 –
IVD tears in the different configurations; the red parts represent the cuts and the removed materials.
All the specimens were sequentially tested in these five configurations: a) With the intact disc;
b) With two vertical cuts on the annulus fibrosus (Figure 2.10): Two vertical cuts were made in the lateral side of the disc with a number 11 scalpel blade, from the upper endplate to the lower endplate. The annulus has been cut to reach the nucleus. The table shows the size of the cuts;
Figure 2.10 - Specimen with the two vertical cuts.
c) With four cuts, forming a square, without removing any part of the annulus (Figure 2.11): Two additional horizontal cuts were made to separate the annulus from the endplates between the two previous vertical cuts, with a number 11 scalpel blade;
Chapter 2 – Materials and Methods
Figure 2.11 - Specimen with two additional horizontal cuts.
d) With a square hole in the annulus (Figure 2.12): The annulus square plug between the four previous cuttings was removed with a rongeur: in this way the nucleus was visible through the hole;
Figure 2.12 - Specimen with the square hole in the annulus;
the nucleus is visible through the hole (white part).
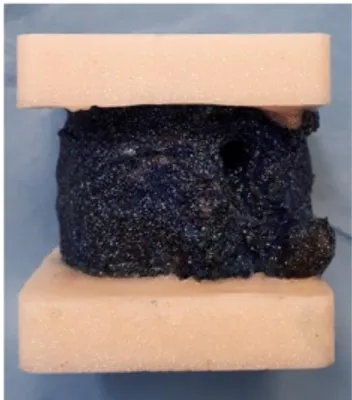
e) Without the nucleus pulposus (Figure2.13): through the annulus window created in the previous configuration, as much nucleus as possible was removed with a curette and a surgical spoon. Each specimen was weighed before and after the nucleotomy to assess the amount of nucleus removed (Table 2.3).
Figure 2.13 - Left: Removing of the nucleus by means a curette;
Sp. N° Lenght of cuts (cm) Distance between cuts (cm) Nucleus removed (g) #1 0,51 0,42 1,80 #2 0,52 0,62 2,80 #3 0,66 0,53 3,40 #4 1,66 1,05 8,90 #5 0,87 0,54 5,40 #6 0,50 0,56 2,90 #7 0,85 0,59 3,50 #8 0,65 0,59 1,70
Table 2.3 - Sizes of cuts executed in the configuration b)
and amount of nucleus removed in the configuration e).
All the defects were executed manually in the opposite side to that observed by the DIC and in order to reduce the variability between different test sessions. The disc lesions were produced directly on the testing machine up to configuration d). Removing all the nucleus pulposus from the FSU on the testing machine was not possible, so that the nucleotomy and the associated tests were performed at a later time.
2.1.6 CT measurements
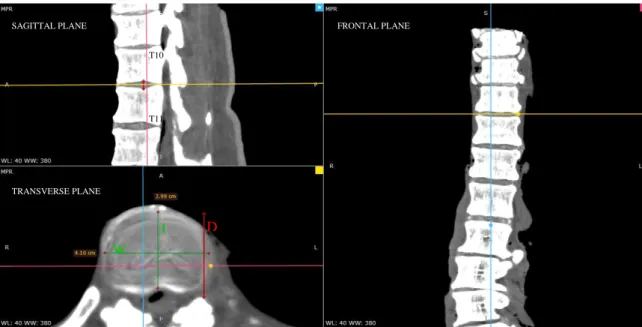
In order to apply the load in a pre-defined and reproducible position, according to the protocol described in the following section, anatomical measurements were made on the disc under study, in particular the antero-posterior length and the lateral width of the IVD. Measurements were taken on CT images, using the free software RadiAnt DICOM Viewer 5.5.0. The midplane of the disc was located in the sagittal plane by defining the disc height where it appeared the highest. In the transverse plane, at the disc midplane, the anterior-posterior length (L) was measured in the center of the disc, and the disc width (W) was measured as the lateral length in the center of the disc (Figure 2.14). Each quantity was measured three times and means were considered (Table 2.4).
Sp. N° Level L (cm) W (cm) #1 T9 - T10 2,43 3,02 #2 T11 - T12 2,66 3,55 #3 T10 - T11 2,99 4,10 #4 L4 - L5 4,94 6,64 #5 T12 - L1 3,35 4,87 #6 T10 - T11 3,74 4,39 #7 T12 - L1 3,85 4,51 #8 T10 - T11 2,34 3,41
Table 2.4 –Disc length and width values based on CT images;
Chapter 2 – Materials and Methods
Could not be applied to the specimens number #6 and #7, as CT scans were not available for these. For these FSUs the disc width (W) was measured on the specimens with a caliper. To obtain the disc length (L), the distance (D), between the anterior part of the disc and the posterior one, was manually measured with a caliper; this distance was greater than the real disc length. In order to evaluate the discrepancy between L and D, both these measures were taken on the CT images (Figure 2.14) of the same levels of the #6 and #7 FSUs. An error of 5% was found for the T10-T11 level and an error of 10% resulted for the T12-L1 level. So, to obtain a reliable value for the #6 and #7 FSUs disc height L, the 5% and the 10% respectively, was subtracted from the measured values (D) (Table 2.4).
Figure 2.14– RadiAnt DICOM viewer interface. In the sagittal planele yellow line marks the midplane of
the disc. In the transverse plane the green lines represent the disc length (L) and the disc width (W), the red lines is the distance D.
T10 T11 SAGITTAL PLANE TRANSVERSE PLANE L W D FRONTAL PLANE
2.2 Mechanical tests
2.2.1 Testing set-up
In order to see how the disc defects impact the biomechanics of the spine, all the specimens were tested on an uniaxial servo-hydraulic testing machine (8032, Instron, UK), equipped with a 100kN load cell.
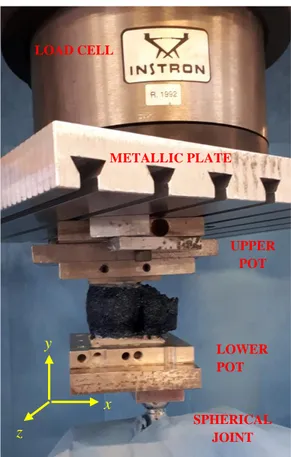
Tests were conducted applying a pre-defined load scaled (scaled for each donor body weight). The actuator speed was adjusted for each specimen so that the loading time was the same for all. During the test, each FSU was anchored with the metallic upper pot to the load cell by means of a metallic plate, which had the role to transfer the load between the pot and the load cell with an homogeneous distribution. The lower part of the specimen was linked to the actuator by means a spherical joint, able to move along the antero-posterior direction by means of a low-friction rail. In this way one free rotation of the loading plate was allowed only in the rail direction (Figure 2.15).
Figure 2.15 - Testing set up and in yellow the coordinates system.
LOAD CELL METALLIC PLATE LOWER POT UPPER POT SPHERICAL JOINT x y z
Chapter 2 – Materials and Methods
2.2.2 Testing protocol
All the specimens were tested in flexion and in extension in all the configurations described above. The position of the specimen under the testing machine was performed taking into account that the spherical joint had to impact the lower pot in its middle right-to-left direction, and that the lateral side with the speckle pattern had to be seen by the cameras.
The tests were sequentially performed and the disc defects were increased with cuts or removing materials after testing both the loading conditions.
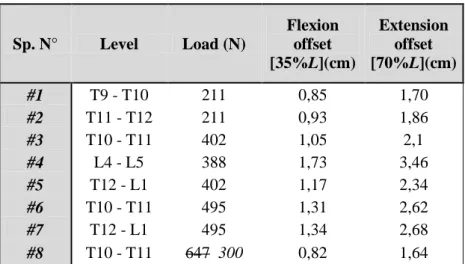
The specimens were tested under an axial load applied with an offset. For this combination, a load of 50% of the body weight was applied to be in the range of the in-vivo-load [x] (Table 2.5). Sp. N° Level Load (N) Flexion offset [35%L](cm) Extension offset [70%L](cm) #1 T9 - T10 211 0,85 1,70 #2 T11 - T12 211 0,93 1,86 #3 T10 - T11 402 1,05 2,1 #4 L4 - L5 388 1,73 3,46 #5 T12 - L1 402 1,17 2,34 #6 T10 - T11 495 1,31 2,62 #7 T12 - L1 495 1,34 2,68 #8 T10 - T11 647 300 0,82 1,64
Table 2.5 - Testing parameters: load and offset values for flexion and extension.
The estimated load of 647N for the #8 FSU was too high with regard to the size of the specimen, so, to avoid to damage the specimen, it has been decided to reach only 300N, after having non destructively check that the specimen was able to reach this. To be sure to reach the target load during the tests, a 10% increased load was applied.
Being in displacement control, the displacement needed to reach the targeted load was measured and then applied for the tests.
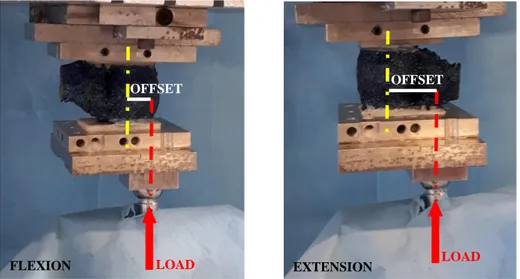
Specimens were solicited with the same load either in flexion either in extension, but the points of application of the load were different (Table 2.5). In particular, in flexion tests the load was applied with an anterior offset of 35% of the antero-posterior disc length from the center of the IVD; while, the extension offset were 70% of the antero-posterior disc length (Figure 2.16).
Before starting the tests preconditioning was performed to minimize viscoelastic creep effect, applying a sinusoidal loading at 0.5 Hz for 20 cycles, and it was repeated every time the loading condition was changed.
Each test consisted of six cycles of a trapezoidal wave. The amplitude of the wave was determined previously to the test by reaching manually the targeted load and recording the corresponding displacement. The loading curve lasted 1 second; le load was maintained for 0.3 second; le unloading curve lasted 0.5 second and after 0.2 second a new wave started.
This test was repeated five times for each different loading condition and configuration. Each test was repeated after 3 minutes from the previous one because it was found to be a time needed to recover the properties of the disc (Figure 2.17).
OFFSET OFFSET
FLEXION EXTENSION
Figure 2.16 - White lines represent the applied offsets between the center of the
disc and load in flexion (left) and extension (right).
LOAD LOAD
Chapter 2 – Materials and Methods
2.2.3 Data acquisition
During the test, the load and the displacement of the actuator were recorded by the PXI system. at 500 Hz.
Disc surface images were recorded by a 3D-DIC system (Q400, Dantec Dynamics, Denmark) at 15 Hz. The whole system consisted of:
Two monochromatic cameras (5 MegaPixels, 2440 x 2050 pixels, 8-bit) equipped with standard 35 mm lenses (Apo-Xenoplan 1.8/35, Schneider-Kreuznach, Bad-Kreuznac, Germany) for a stereo-scopic view (Figure 2.18);
Data acquisition card ( It manages to import images recorded by the cameras, and to connect, at the same time it records images, others measurement tools with the digital signal output);
Source of light (two white LEDs, were used) (Figure 2.18);
Computer with the associated DIC software for the images correlation and elaboration;
Calibration target (Mod. A14-BMB- 9x9, Dantec Dynamics).
The optimized parameters [Ruspi et al., 2018] used for the images correlations were: Facet Size: 35 pixel;
Grid Spacing: 19 pixel.
All images were filtered using Contour and Displacement Smoothing, filters with a local regression with a 07x07 kernel size.
Chapter 2 – Materials and Methods
2.3 Data Analysis
Analyzed data were extracted from the last cycle of each test, the first five cycles ensuring that the visco-elastic effect was negligible in the specimens. Indeed, it was confirmed that after three cycles, specimens reached an equilibrium.
Data-processing was performed with Matlab (Mathworks, Inc., Natick, Ma, Usa) dedicated scripts.
Images analysis was performed with the associated DIC software after that the images correlations were successfully performed using optimized parameters described above. Images processing was performed at the target load frame.
The load – displacement curves were obtained from the PXI data to evaluate the loading curve trend between the different configurations. Stiffness was defined as the average slope of the second half of the loading phase.
ROM was defined as the relative rotation between the two vertebral bodies in the sagittal plane at the peak load. In order to obtain the ROM, the following steps were performed on a Matlab scrip, assuming rigid body motion.
For each test:
The load signal was filtered with a median filter;
The signal was segmented into the six cycles of the test;
The peak load, the targeted load and their time interval were computed for each cycle, since to be sure to reach the target load, a targeted load more 10% was applied;
On the DIC correlated images, two regions of interest were selected corresponding to the upper fixed vertebral body and the lower moving one;
The position of the center of the each vertebra was plotted was plotted in order to identify the peak load and the unload frame for each cycle of the test;
Combining the time gap between the target load and the peak load, with the load peak frame allowed to identify the targeted load frame number;
Distance between the unload frame and the peak value frame were computed for both the centers of the lower vertebra and of the upper vertebra;
Considering vertebrae as rigid bodies, Singular Value Decomposition Algorithm [Chung et Teoh, 2002] was applied to take out the main rotation and;
The 3D rotations of the FSU resulted by the composition of the upper and lower vertebra rotation.
In order to assess how strain distribution changed in the different tested configurations, strain distribution maps were extracted over all the correlated surfaces, either for the maximum principal strains either for the minimum principal strains, at the targeted load frame. In addition, the mean, the maximum and the minimum value for the principal strains on the disc surfaces were extracted using the DIC software.
In order to assess changes in disc height under load and due to disc lesions, the disc height was measured on DIC correlated images following the 3D profile to recognize the disc geometry. The disc height was measured in the central lateral side, at the beginning (10N) of the last cycle, to have a comparable measures for all the specimens. The disc height measure in the postero-lateral of the IVD at the peak load was not always possible due to defects in the correlated images.
To limit the inter-specimen variability influence, stiffness, height and ROM values were normalized to the intact condition value. Median of all the outcomes were calculated and presented.
For each outcome, outliers checked and excluded using Peirce’s criterion [Ross, 2003].
2.4 Statistical Analysis
A statistical analysis was performed to evaluate the significance of the changes between the disc damage conditions.
The median stiffness and ROM, both in flexion and in extension, were compared using the Friedman One-Way Repeated Measure Analysis of Variance by ranks. Friedman’s test is a-non parametric statistical test for paired data used to detect differences in treatments across multiple test attempts.
A statistical significance of 0.05 was used for all statistical tests. A p-value smaller than 0.05 was considered statistically significant.
Chapter 3
Results
All the tests were successfully implemented without damaging the specimens.
Correlations and measurements were successfully performed for all the different configurations of all specimens.
3.1 Stiffness
For each specimen and for each type of motion, load – displacement curves were compared in the five conditions. Displacement offset was removed to have the curves starting at zero displacement. Being interested in the loading condition, only the loading phases until the targeted load were plotted.
Different behaviors were observed through the load – displacement curves were observed in the flexion condition: six specimens showed an increase of slope between configuration a) and d) (Figure 3.1), while the other two specimens (#4 and #6) exhibited the opposite tendency (Figure 3.2) The nucleotomy curves showed an effect more intense than the others in all the spine, except in one specimen.
Chapter 3 - Results
Figure 3.2 - Load – displacement plot with a slope decreasing between configuration a) and d), in flexion.
In addition, the FSU’s belonging to the upper part of the spine (between T9 and T11) presented a linear shape (Figure 3.1) whereas the lower part of the spine (between T12 and L5) showed an exponential shape (Figure 3.2).
A common trend among the specimens was the increase of the sigmoid-shape curve in the laxity zone (first part of the curve): usually the first curve (blue one, condition a)) was linear. Increasing the incision level, this effect was more stressed until the nucleotomy step (light blue curve, configuration e)) (Figure 3.3).
Figure 3.3 - Zoom on the initial load-displacement plot; the sigmoid-shape effect increase is visible from
In extension, load and displacement were linearly related, except for the lumbar FSU #4 which exhibited an exponential behavior (Figure 3.4). As in flexion, half of the specimens showed an increase of slope between configurations a) and d), while the others half exhibited the opposite tendency. In addition nucleotomy condition exhibited an effect more intense or comparable to the others, except for FSU #5, which manifested a sharp increase of the load – displacement slope after nucleus removal (Figure 3.5).
Figure 3.4 – Load – displacement curves with a slope decreasing between configuration a) and d) in
extension. Nucleotomy curve has a comparable effect to the others. All the curve show an exponential behavior.
Figure 3.5 – Load – displacement curves with a linear behavior in extension. Sharp increase of slope in
Chapter 3 - Results
Due to these different trends of the loading curves, in order to have a comparable parameter between the specimens, stiffness was estimated as the slope of the second half of the loading curve, which was more consistent for all specimens.
The median values of the stiffness normalized by intact state of the last cycle of the five repetitions are presented.
Deleted data on tables were classified as outliers according to Pierce’s criterion [Ross, 2003] and therefore they were excluded from analysis and plot.
In flexion, specimens presented very different trends among the various configurations (Table 3.1) but the dispersion of the values was comparable between the increasing disc lesions (Figure 3.6). CRANIAL <== ==> CAUDAL Sp. N° #1 #3 #6 #8 #2 #5 #7 #4 Median Level T9 - T10 T10 - T11 T10 - T11 T10 - T11 T11 - T12 T12 - L1 T12 - L1 L4 - L5 Conf. a) 1,00 1,00 1,00 1,00 1,00 1,00 1,00 1,00 1,00 Conf. b) 0,98 1,01 1,02 1,13 0,95 1,04 1,00 0,91 1,00 Conf. c) 1,01 0,96 1,03 1,16 1,02 1,06 1,02 0,87 1,02 Conf. d) 1,05 0,88 1,01 1,27 1,06 1,08 1,15 0,89 1,05 Conf. e) 1,01 0,96 0,95 1,13 0,78 1,20 1,58 0,76 0,98
Table 3.1 - Median stiffness values in flexion. Results have been sorted by levels.
Figure 3.6 - Normalized stiffness trend in flexion for each specimen in relation to the increasing degree of
disc damage from configuration a) (intact) to e) (complete nucleotomy).
0,70 0,80 0,90 1,00 1,10 1,20 1,30
Conf. a) Conf. b) Conf. c) Conf. d) Conf. e)
No rm alize d Sti ff n ess
Normalized STIFFNESS in Flexion
#1 #3 #6 #8 #2 #5 #7 #4
Median values of all the specimens, were very similar between damage levels (Figure 3.7). Configuration without nucleus (e) showed a little decrease in the median value of stiffness, but the minimal differences between the configurations were not statistically significant, with p = 0.86 (Friedman test).
Figure 3.7 - Median normalized stiffness in flexion for each configuration; from configuration b) (two
incisions) to e) (complete nucleotomy). The blue line represents the intact disc stiffness level.
In extension (Table 3.2), two vertical cuts (configuration b)) seemed not to have any effect on the stiffness of the specimens.
From 4 cuts (configuration c)), the specimens showed a larger variability, with a variation of stiffness between 40% reduction and 20% increase. Configuration c) and d) had similar stiffness for all specimens. Nucleus removal enhanced inter-specimen variability with a decreasing stiffness for half of the specimens and an increasing stiffness for the others (Figure 3.8). CRANIAL <== ==> CAUDAL Sp. N° #1 #3 #6 #8 #2 #5 #7 #4 Median Level T9 - T10 T10 - T11 T10 - T11 T10 - T11 T11 - T12 T12 - L1 T12 - L1 L4 - L5 Conf. a) 1,00 1,00 1,00 1,00 1,00 1,00 1,00 1,00 1,00 Conf. b) 1,08 1,01 0,99 1,05 1,01 0,98 1,09 1,02 1,02 Conf. c) 0,61 1,15 0,87 1,17 1,11 1,09 1,29 0,99 1,10 Conf. d) 0,62 1,14 0,88 1,22 1,14 1,12 1,44 0,96 1,13 Conf. e) 0,54 1,33 0,88 0,88 0,79 3,18 1,53 1,11 0,88
Table 3.2 - Median stiffness values in extension. Results have been sorted by levels.
1,00 1,02 1,05 0,96 0,00 0,20 0,40 0,60 0,80 1,00
Median normalized STIFFNESS in
Flexion
Chapter 3 - Results
Figure 3.8 - Normalized stiffness trend in extension for each specimen in relation to the increasing degree
of disc damage from configuration a) (intact) to e) (complete nucleotomy).
Applying defects b) and d) did not affect significantly the stiffness median values (Figure 3.9) with respect to the cases a) and c). An increment of 10% was obtained after the four cuts (configuration c)), while decrease of 12% occurred after nucleus removal with respect to the intact state.
Different configurations did not show statistically significant differences (p = 0.71, Friedman test).
Figure 3.9 - Median normalized stiffness in flexion for each configuration; from configuration b) (two
incisions) to e) (complete nucleotomy). The blue line represents the intact disc stiffness level.
0,40 0,60 0,80 1,00 1,20 1,40 1,60
Conf. a) Conf. b) Conf. c) Conf. d) Conf. e)
No rm a lized Stif fnes s
Normalized STIFFNESS in
Extension
#1 #3 #6 #8 #2 #5 #7 #4 1,02 1,10 1,13 0,88 0,00 0,20 0,40 0,60 0,80 1,00 1,20Median normalized STIFFNESS in
Extension
3.2 Range of Motion
Only motion in the sagittal direction was taken into account.
For each configuration, the median of the ROM of all specimens were normalized by the intact ROM for each motion.
Deleted data on tables were classified as outliers according to Pierce’s criterion [Ross, 2003] and therefore they were excluded from analysis and plot.
In flexion, two vertical cuts (configuration b)) resulted in an increase of the ROM for all specimens except two (Table 3.3).
CRANIAL <== ==> CAUDAL Sp. N° #1 #3 #6 #8 #2 #5 #7 #4 Median Level T9 - T10 T10 - T11 T10 - T11 T10 - T11 T11 - T12 T12 - L1 T12 - L1 L4 - L5 Conf. a) 1,00 1,00 1,00 1,00 1,00 1,00 1,00 1,00 1,00 Conf. b) 1,23 1,43 1,48 0,67 1,03 1,07 0,71 1,09 1,08 Conf. c) 1,22 1,28 1,26 0,62 0,91 1,05 0,79 1,12 1,09 Conf. d) 1,19 1,17 1,50 0,62 0,73 0,97 0,90 1,26 1,07 Conf. e) 1,03 0,86 0,81 1,50 0,85 0,70 0,63 1,13 0,85
Table 3.3 - Median ROM values in flexion. Results have been sorted by levels.
Between the configuration b) and d), no clear common trend was observed in the specimens but the ROM values remained in a range of [60%; 150%] for these three configurations. Nucleus removal decreased the ROM compared to the previous configurations, except in FSU #2; for the majority of the specimens the ROM was lower than the intact configuration value (Figure 3.10).
Differences between all the configurations were found to be not statistically significant, with p = 0.20.
Chapter 3 - Results
Figure 3.10 -- Normalized ROM trend in flexion for each specimen in relation to the increasing degree of
disc damage from configuration a) (intact) to e) (complete nucleotomy).
Looking at the median values among all the specimens (Figure 3.11), the disc lesions effect resulted in an increase of the rotation between 7% and 9% configurations b), c) and d), compared to the intact case. A 15% ROM decrease was achieved in the nucleotomy state (e)).
Figure 3.11 - Median normalized ROM in flexion for each configuration; from configuration b) (two
incisions) to e) (complete nucleotomy).The blue line represents the intact disc ROM level.
0,50 0,60 0,70 0,80 0,90 1,00 1,10 1,20 1,30 1,40 1,50
Conf. a) Conf. b) Conf. c) Conf. d) Conf. e)
No
rm
alize
d
ROM
Normalized ROM in Flexion
#1 #3 #6 #8 #2 #5 #7 #4 1,08 1,09 1,07 0,85 0,00 0,20 0,40 0,60 0,80 1,00 1,20
Median normalized ROM in Flexion
In extension, specimen #1 was excluded after the ROMs in configuration c), d) and e) were found to be outliers with values three times higher than the other specimens (Table 3.4). CRANIAL <== ==> CAUDAL Sp. N° #1 #3 #6 #8 #2 #5 #7 #4 Median Level T9 - T10 T10 - T11 T10 - T11 T10 - T11 T11 - T12 T12 - L1 T12 - L1 L4 - L5 Conf. a) 1,00 1,00 1,00 1,00 1,00 1,00 1,00 1,00 1,00 Conf. b) 0,94 0,99 1,01 0,93 1,23 1,06 0,80 0,92 0,99 Conf. c) 2,70 0,77 1,49 0,72 0,93 0,95 0,85 0,89 0,89 Conf. d) 1,97 0,77 1,38 0,66 1,11 0,90 0,80 0,88 0,88 Conf. e) 4,01 0,49 1,03 0,95 1,50 0,26 0,67 0,84 0,84
Table 3.4 - Median ROM values in extension. Results have been sorted by levels.
Figure 3.12- Normalized ROM trend in extension for each specimen in relation to the increasing degree of
disc damage from configuration a) (intact) to e) (complete nucleotomy).
Similarly to flexion, different behaviors between the specimens were observed in extension, in particular FSU #2 and #6 showed a completely different behavior from the other specimens (Figure 3.12). The majority of FSUs showed the same relative rotation between vertebral bodies after the first two cuts compared to the intact segment.
Except few cases, a ROM reduction was noticed in configuration c) and e), compared with the step before them (b) and d)). Furthermore, the final values were inferior to the
0,20 0,40 0,60 0,80 1,00 1,20 1,40 1,60
Conf. a) Conf. b) Conf. c) Conf. d) Conf. e)
No rm alize d R OM
Normalized ROM in Extension
#3 #6 #8 #2 #5 #7 #4
Chapter 3 - Results
intact case. After removing the annulus square, no remarkable variations were visible in relation to the previous configurations.
The median values among the specimen revealed no changes in ROM after the first lesion confirming the previous observations (Figure 3.13).
Figure 3.13 - Median normalized ROM in extension for each configuration; from configuration b) (two
incisions) to e) (complete nucleotomy). The blue line represents the intact disc ROM level.
There was no statistically significant difference between the five configurations although a prevalent trend of range of motion decreasing was observed (p = 0.48, Friedman test).
0,99 0,89 0,88 0,84 0,00 0,20 0,40 0,60 0,80 1,00 1,20
Median normalized ROM in Extension
3.3 Strain distribution
DIC correlation has been successfully performed for all tests in flexion and extension. Both in flexion (Figure 3.14) and in extension (Figure 3.15), the highest strain values were located in the disc while the vertebra underwent null strain.
In flexion, tensile principal strains were found in the center of disc. From a) up to d), the annulus surface was entirely strained, but in configuration e) the strained region concentrated along the mid-height plan of the disc. Strains direction showed that maximum tensile strains were circumferentially aligned in flexion. Compressive strains showed two different trends depending on the specimen level (Figure 3.16). In thoracic segments, high compressive strain values were located along the endplates starting from the anterior part (a)), propagated back along the endplates until the center of the lateral side of the disc. With the increasing damage, strains migrated and concentrated at the cranial and caudal borders, ending by covering the entire disc surface in the anterior (e)). In lumbar levels, segments with a small defect showed high compressive strains in the anterior ligament and along the endplates. The damages reduced the strains in the ligament, concentrating the high values along the endplate, propagating to posterior part of the disc.
In extension, thoracic and lumbar levels acted differently (Figure 3.17). In thoracic levels, tensile strains spread incrementally on the disc from localized high strain regions on intact thoracic discs to continuous distribution over the disc in e). In lumbar segments, not only the disc was strained but also the anterior ligament leading to high tensile strains covering the anterior part of vertebrae. Contrary to thoracic levels, the strain distribution reduced when the disc got more damaged, with a concentration of the strain on the disc only. Tensile strains presented an axial alignment for all spine levels. Compressive strained regions were observed at the posterior part of the disc. In thoracic segments, the strains extended to the anterior of the disc with the damage increase whereas in lumbar segment, the distribution reduced incrementally, and concentrated around the endplates after nucleotomy.
Chapter 3 - Results
Figure 3.14 –
Figure 3.15 –
Chapter 3 - Results
Figure 3.16 –
True principal strains in FLEXION, in configuration a) and e) in a thoracic segment (up) and in a lumbar segment (down).
Figure 3.17 –
True principal strains in EXTENSION, in configuration a) and e) in a thoracic segment (up) and in a lumbar segment (down).
Chapter 3 - Results
Median values of average, minimum and maximum values of true principal strain are shown in Table 3.5. Because of the inter-specimen variability, details for each specimen are in Appendix A.
Nucleotomy affected more compressive strains either for flexion either for extension, than tensile strains. No configuration showed peak of tensile strains values significantly higher compared to the other configurations whereas compressive strain values doubled for d) and e) compared to intact condition.
ɛ
1FLEXION EXTENSION
Mean [ɛ] Max [ɛ] Mean [ɛ] Max [ɛ]
a) 8550 45770 5150 40258 b) 8800 41001 6850 39145 c) 9550 43199 5700 50241 d) 9500 44281 6060 55377 e) 8000 47199 5150 48034
ɛ
2 FLEXION EXTENSIONMean [ɛ] Min [ɛ] Mean [ɛ] Min [ɛ]
a) -7000 -42690 -4755 -61289
b) -5650 -55972 -4400 -74290
c) -10000 -60316 -3500 -86160
d) -10900 -85611 -4850 -100874
e) -30000 -115889 -8700 -95802
Table 3.5- Median values of average, minimum and maximum