Journal of Clinical Virology 47 (2010) 4–7
Contents lists available atScienceDirect
Journal of Clinical Virology
j o u r n a l h o m e p a g e :w w w . e l s e v i e r . c o m / l o c a t e / j c vCorrelation between HIV-1 viral load quantification in plasma, dried blood spots,
and dried plasma spots using the Roche COBAS Taqman assay
Mauro Andreotti
a,1, Maria Pirillo
a,1, Giovanni Guidotti
b, Susanna Ceffa
b, Giovanna Paturzo
b,
Paola Germano
b, Richard Luhanga
c, David Chimwaza
d, Maria Grazia Mancini
a,
Maria Cristina Marazzi
b,e, Stefano Vella
a, Leonardo Palombi
b,f, Marina Giuliano
a,∗ aDepartment of Therapeutic Research and Medicines Evaluation, Istituto Superiore di Sanità, Viale Regina Elena 299, 00161 Rome, Italy bDREAM Program, Community of S. Egidio, Rome, ItalycDREAM Program, Community of S. Egidio, Blantyre, Malawi dDREAM Program, Community of S. Egidio, Lilongwe, Malawi eDepartment of Public Health, LUMSA University, Rome, Italy fDepartment of Public Health, University of Tor Vergata, Rome, Italy
a r t i c l e i n f o
Article history:Received 18 August 2009
Received in revised form 4 November 2009 Accepted 5 November 2009
Keywords: HIV
Resource-limited settings HIV-RNA
Dried blood spots
a b s t r a c t
Background: The use of simplified methods for viral load determination could greatly increase access to treatment monitoring of HIV patients in resource-limited countries.
Objective: The aim of the present study was to optimize and evaluate the performance of the Roche COBAS Taqman assay in HIV-RNA quantification from dried blood spots (DBS) and dried plasma spots (DPS).
Study design: EDTA blood samples from 108 HIV-infected women were used to prepare 129 DBS and 76 DPS on Whatman 903 card. DBS and DPS were stored at−20◦C. HIV-1 RNA was extracted from DBS/DPS using the MiniMAG system (bioMerieux). Amplification and detection were performed using the Roche COBAS TaqMan assay. Plasma viral load results were used as standard.
Results: There was a high correlation between measures of viral load in plasma and in DBS/DPS (r = 0.96 and 0.85 respectively, P < 0.001). Overall, viral load values in DBS and DPS tended to be lower than in plasma with mean (SD) differences of 0.32 log (0.22) for DBS and of 0.35 (0.33) for DPS. Detection rates were 96.4% for DBS and 96.1% for DPS in samples with corresponding plasma values >3.0 log copies/ml. Samples with HIV-RNA below 50 copies/ml were correctly identified in 18/19 DBS and in 7/7 DPS. Conclusions: Both DBS and DPS provided results highly correlated to the plasma values. High detection rate was obtained with both DBS and DPS when HIV-RNA was >3.0 log copies/ml. Our results support the use of DBS/DPS to detect virologic failure in resource-limited settings.
© 2009 Elsevier B.V. All rights reserved.
1. Background
Access to antiretroviral drugs in resource-limited countries has significantly increased in the last years and at the end of the year 2007 about 3 million people were receiving antiretroviral therapy (a 7.5-fold increase during the last four years).1Although this
cover-age is still low, representing only 31% of people requiring treatment, there is an urgent need to evaluate simplified methods to monitor treatment efficacy and to guide an appropriate switch to second line therapy. Evidence has been accumulating that identification of treatment failure based only on clinical or immunological criteria,
∗ Corresponding author. Tel.: +39 06 49903303; fax: +39 06 49387199. E-mail address:[email protected](M. Giuliano).
1Equally contributing to the work.
can be unsatisfactory because of a late identification of virologic failure with consequent accumulation of resistance mutations.2,3
The use of dried blood spots and dried plasma spots for viral load determination has been proposed because of the easiness of col-lection and the possibility of transport at room temperature (also from rural areas) to a centralized laboratory with molecular biology facilities.
Quantification of HIV-RNA from filter papers has been eval-uated in several studies using different techniques that have provided variable results.4–9 In general, satisfactory results have
been obtained at relatively high viral load, while samples with val-ues near the cut-off level have not produced reliable data.10–12
Recently, new assays for HIV-RNA determination using the real-time PCR methodology have been introduced and the performance of these new viral load assays with dried blood spots has not been extensively reported.
1386-6532/$ – see front matter © 2009 Elsevier B.V. All rights reserved. doi:10.1016/j.jcv.2009.11.006
M. Andreotti et al. / Journal of Clinical Virology 47 (2010) 4–7 5 2. Objectives
In the present study we evaluated the performance of the Roche COBAS TaqMan assay in quantifying HIV-RNA from both dried blood spots and dried plasma spots obtained from patients in Malawi.
3. Study design
3.1. Patients
From February 2008 to October 2008, blood samples were col-lected in EDTA from 108 HIV-infected pregnant women attending the Drug Resource Enhancement Against AIDS and Malnutrition (DREAM) program (designed and managed by the Community of S. Egidio) in Lilongwe and Blantyre (Malawi) and enrolled in a study to evaluate prevention of breastfeeding associated transmission by HAART administration [SMAC (Safe Milk for African Children) study]. The study was approved by the National Health Research Committee of Malawi.
Blood samples were collected in 102 women before ini-tiation of antiretroviral therapy and in 18 women after 2–6 months of treatment (regimen included stavudine or zidovu-dine + lamivuzidovu-dine + either nevirapine or lopinavir/ritonavir). HIV-1 subtype C is highly prevalent in Malawi.13
3.2. Preparation of specimens
All procedures were performed by locally trained people under tropical climate conditions. For dried blood spots (DBS) 75l of EDTA-collected blood samples were spotted onto each cir-cle of Whatman 903 filter paper card. After centrifugation at 800–1000× g for 15 min of the EDTA-collected blood, an aliquot of plasma was stored at−80◦C and 50l were spotted on
What-man 903 cards to prepare dried plasma spots (DPS). Both DBS and DPS were dried at room temperature for 4 h and then stored in indi-vidual ziplock bags containing a desiccant at−20◦C until shipment
to the laboratory of the Istituto Superiore di Sanità in Italy. DBS and DPS were shipped at room temperature and in Italy stored at −20◦C until processing. Plasma samples were shipped in dry ice
and stored at−80◦C until processing.
3.3. Processing of specimens
Initially, HIV-RNA extraction from DBS and DPS was attempted using the High Pure System Viral Nucleic Acid kit (manual extraction of the Roche COBAS TaqMan assay) but a significant underestimation of results was obtained. Subsequently there-fore, HIV-RNA extraction was performed with the NucliSENS miniMAG system (bioMerieux, Marcy l’Etoile, France) using the Boom technology with magnetic silica. Each spot was excised and incubated overnight at room temperature in 2 ml of NucliSENS lysis buffer with gentle rotation. The filter paper was then removed from the tube and the solution was processed accord-ing to the manufacturer’s instructions; the nucleic acids obtained were then processed for quantification using the COBAS Taq-Man real-time reverse transcriptase PCR assay (Roche Diagnostics, Branchburg, NJ, USA). All plasma samples were extracted with the High Pure Viral Nucleic Acid kit and quantified with the Roche TaqMan assay with a limit of detection of 47 copies/ml (1.67 log10copies/ml) (on the basis of a plasma input volume
of 500l). When the sample volumes were reduced to 75 l for DBS and 50l for DPS, the limits of detection were 313 copies (2.49 log10copies/ml) and 470 copies (2.67 log10copies/ml)
respectively.
3.4. Data analysis
All HIV-RNA values were log10 transformed before analysis.
Quantitative variables are expressed as means (±SD) and com-pared by the Student t-test. Log-transformed viral load measured in DBS and DPS samples and in the paired liquid plasma samples were compared by Pearson correlation analysis. For the analysis of concordance between the results obtained from plasma and those obtained from DBS and DPS, the method of Bland and Altman was used.14All statistical calculations were performed using SPSS
soft-ware (version 17.0, SPSS Inc. Chicago, USA).
4. Results
Samples were divided according to the HIV-RNA level in plasma: ≤2 log10(n = 19, all obtained from treated women), 2 log10(range
2.1–2.96, n = 15), 3 log10 (range 3.04–3.97, n = 28), 4 log10(range
4.0–4.97 n = 38), 5 log10(range 5.01–6.01, n = 29). DBS were
avail-able for all collected plasma samples (n 129) while 76 DPS were available for the analyses. Samples were analyzed after a mean time of 10.4 months (range 2–17.2 months) of collection and storage.
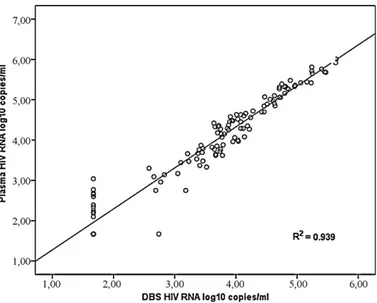
Fig. 1shows the correlation between the viral load determi-nations from plasma and from DBS. The overall R2 was 0.939.
Agreement between undetectable and detectable viral load for plasma and DBS was seen in 89.1% of samples. In 10% of the cases (n 13) HIV-RNA was not detectable in DBS while measurable levels were present in plasma (between 2.1 and 3.04 logs, mean 2.49). One DBS gave a result of 2.74 log10(549 copies) while the corresponding
plasma level was <1.67 log copies. In all other cases of undetectable viral load in plasma (n 18) HIV-RNA was not detectable in DBS.
The correlation between levels measured in DPS and in plasma is shown inFig. 2. Agreement between undetectable and detectable viral load was seen for 92.1% of the samples. There were 7 sam-ples with undetectable HIV-RNA in plasma and all of them were undetectable when measured from DPS. In 7.9% of the cases (n 6) HIV-RNA was undetectable in DPS while measurable HIV-RNA lev-els were present in plasma (between 2.1. and 3.3 logs, mean 2.50). Detection rates according to different HIV-RNA thresholds for DBS and DPS are reported inTable 1. Both DBS and DPS had a high sensi-tivity and specificity and a high Positive Predictive Value (Table 2). Negative Predictive Values were low as an effect of the low rate of detection of both DBS and DPS when plasma HIV-RNA was below 3.0 log copies/ml.
6 M. Andreotti et al. / Journal of Clinical Virology 47 (2010) 4–7
Fig. 2. Correlation between viral loads obtained from plasma and DPS.
Table 1
HIV-RNA detection rates in paired dried blood spots and dried plasma spots and liquid plasma samples (samples with detectable HIV-RNA in plasma).
DBS
VL in plasma N. of samples DBS-positive Detection rate
1.67–2.99 log10 15 3 20.0 3–3.99 log10 28 27 96.4 4–4.99 log10 38 38 100 ≥5 log10 29 29 100 All 110 97 88.1 DPS
VL in plasma N. of samples DPS-positive Detection rate
1.67–2.99 log10 6 1 16.6
3–3.99 log10 26 25 96.1
4–4.99 log10 30 30 100
≥5 log10 7 7 100
All 69 63 91.3
Among samples with detectable HIV-RNA, the correlation between viral load values obtained from the paired 97 plasma and DBS samples and the 63 plasma and DPS samples was high (Pearson correlation coefficient = 0.96, and 0.85, R2= 0.92 and 0.72, respectively, P < 0.01 for both correlations). The mean (±SD) dif-ference between the measured viral load in DBS samples and in plasma was 0.32± 0.22 log copies/ml. The mean difference for DPS was 0.35± 0.33 log copies/ml. HIV-RNA levels obtained from DBS were always lower than in plasma with the exception of 9 out of 97 samples (9.3%) in which levels were higher (from 0.02 to 0.43 log
Table 2
Sensitivity, specificity, positive and negative predictive values (95% confidence intervals) of DBS (panel a) and DPS (panel b) against plasma viral load determination.
(a) Plasma viral load
DBS POS NEG Total Sensitivity = 88.2% (80.3–93.3) POS 97 1 98 Specificity = 94.7% (71.9–99.7) NEG 13 18 31 PPV = 98.9% (93.6–99.9) Total 110 19 129 NPV = 58.1 (39.2–74.9)
(b) Plasma viral load
DPS POS NEG Total Sensitivity = 91.3% (81.3–96.4) POS 63 0 63 Specificity = 100% (56.0–100)
NEG 6 7 13 PPV = 100% (92.8–100)
Total 69 7 76 NPV = 53.8% (26.1–79.5)
Fig. 3. Bland-Altman analysis of agreement between plasma and DBS. The horizon-tal lines represent the mean difference and±1.96 standard deviations.
higher, plasma HIV-RNA range 2.75–4.08 logs). In 7 out of 63 cases (11.1%) DPS had HIV-RNA levels higher than in plasma (from 0.01 to 0.39 logs higher than in plasma, HIV-RNA range 2.96–4.35 logs). The mean (±SD) HIV-RNA levels (log10) in plasma and DBS were 4.45± 0.79 and 4.13 ± 0.71, respectively (P < 0.001). The cor-responding values comparing plasma and DPS were 4.17± 0.63 and 3.82± 0.53, respectively (P < 0.001).
Overall, viral load values between DBS and plasma differed by less than 0.5 log unit in 78.4% of the samples and by less than 1 log unit in 100% of the samples. For DPS the corresponding figures were 73% (less than 0.5 log) and 96.8% (less than 1 log).
Agreement between the two samples was calculated by the Bland and Altman method, in which the differences between indi-vidual viral load results from plasma and spots are plotted against the mean of the two results (concordance is good when the differ-ences are within the limits of 1.96 standard deviations of the mean). InFigs. 3 and 4it can be seen that all but 1 sample were within the 1.96 SD limits (−0.30–0.94) for DBS and all but 4 samples were within the limits (−0.36–1.07) for DPS, respectively.
Fig. 4. Bland-Altman analysis of agreement between plasma and DPS. The
M. Andreotti et al. / Journal of Clinical Virology 47 (2010) 4–7 7 5. Discussion
Assessing the reliability of dried blood spots or dried plasma spots for the detection of virological failure is a high priority research question for resource-limited settings. The performance in HIV-RNA quantification from DBS and DPS of the new method-ologies for viral load determination using a real-time PCR have been evaluated in few studies,9,10,12,15and in our work we aimed to
val-idate the use of the Roche COBAS TaqMan assay. To obtain good results we had to adapt the methodology and perform the extrac-tion with the Boom technology since in our hands (and as reported by others11) the High Pure Viral Nucleic Acid kit (manual
extrac-tion of the Roche COBAS TaqMan assay) was not efficient due to a significant underestimation (mean difference >1.2 log compared to plasma, data not shown). Following this modification we found a very good agreement between the results in plasma and in both DBS and DPS. The rate of detection at the viral threshold commonly defining virologic failure was >95% and both DBS and DPS had a very high Positive Predictive Value. Although we did not adjust for hematocrit our data from DBS, we found very similar results between DBS and DPS without any significant difference in detec-tion rates or sensitivity. As hypothesized by others,15,16it is possible
that the difference due to hematocrit is compensated by the con-centration of HIV-RNA present in the cells in whole blood. Since DBS eliminate the need for an initial centrifugation to separate plasma, the use of DBS is highly preferable especially for regions without electricity. Another very important aspect of our study is the sta-bility of the results over time if DBS/DPS are stored at−20◦C (even
if shipped from one laboratory to another at room temperature). In fact, our samples were processed after several months of collec-tion and no correlacollec-tion was found between the length of storage and the proportion of samples with >0.5 log difference between DBS and plasma (data not shown), although we cannot exclude that we could have obtained better results with a shorter storage. Indeed, a different study12assessing the performance of a real-time
PCR assay, obtained greater sensitivity and a lower mean differ-ence between plasma and DBS compared to our results, but it has to be underlined that we used a manual extraction method while in the paper by Marconi et al. an automated extraction was per-formed. However, the proportions of samples with >0.5 log or >1 log difference were similar in both studies.
In our work, unlike other reports,10–12we did not find false
pos-itive results with DBS. Only one sample that was undetectable in plasma had 549 copies/ml detected by DBS while the great major-ity of HIV-RNA levels obtained from DBS and DPS were lower than those obtained from plasma. The presence of proviral DNA in DBS was thought to be responsible for the presence of a large num-ber of false positives with DBS. However, in our study the same (very limited) proportion of samples among DBS and DPS had val-ues slightly higher than plasma (in the range of the variability of the method). Therefore, it seems that alternative hypotheses should also be considered for the results of the above mentioned studies.
In conclusion, in our study DBS and DPS, easily transported at room temperature from distant sites to reference laboratories (where storage at−20◦C is generally possible), are highly sensitive
in detecting virological failure and can contribute to increase access to virological monitoring of patients in resource-limited settings.
Competing interests
None.
Funding
Funds for this study were provided by the Istituto Superiore di Sanità, Italy.
Ethical approval
The study was approved by the National Health Sciences Research Committee in Malawi # 486.
Acknowledgments
The authors are grateful to Roberta Amici for technical assis-tance and to Alessandra Mattei for secretarial support.
References
1. World Health Organization – UNAIDS – UNICEF. Towards universal access. Scaling up priority HIV/AIDS interventions in the health sector. World Health Organization 2008. Accessed July 14, 2009.
2. Ferradini L, Jeannin A, Pinoges L, Odhiambo D, Mankhambo L, Karungi G, et al. Scaling up of highly active antiretroviral therapy in a rural district of Malawi: an effectiveness assessment. Lancet 2006;367:1335–42.
3. Chaiwarith R, Wachirakaphan C, Kotarathititum W, Prapartanaphan J, Sirisanthana T, Supparatpinyo K. Sensitivity and specificity of using CD4+ mea-surement and clinical evaluation to determine antiretroviral treatment failure in Thailand. Int Infect Dis 2007;11:413–6.
4. Cassol S, Gill MJ, Pilon R, Cormier M, Voigt RF, Willoughby, et al. Quantifica-tion of human immunodeficiency virus type 1 RNA from dried plasma spots collected on filter paper. J Clin Microbiol 1997;35:2795–801.
5. Fiscus SA, Brambilla D, Grosso L, Schock J, Cronin M. Quantitation of human immunodeficiency virus type 1 RNA in plasma by using blood dried on filter paper. J Clin Microbiol 1998;36:258–60.
6. Mwaba P, Cassol S, Nunn A, Pilon R, Chintu C, Janes M, et al. Whole blood ver-sus plasma spots for measurement of HIV-1 viral load in HIV-infected African patients. Lancet 2003;36:2067–8.
7. Brambilla D, Jenning C, Aldrovrandi G, Bremer J, Comeau AM, Cassol SA, et al. Multicenter evaluation of use of dried blood and plasma spot specimens in quantitative assays for human immunodeficiency virus RNA: measurement, precision, and RNA stability. J Clin Microbiol 2003;41:1888–93.
8. Uttayamakul S, Likanonsakul S, Sunthornkachit R, Kuntiranont K, Louisirirotchanakul S, Chaovavanich A, et al. Usage of dried blood spots for molecular diagnosis and monitoring HIV-1 infection. J Virol Meth 2005;128, 128.134.
9. Garrido C, Zahonero N, Corral A, Arredondo M, Soriano V, de Mendoza C. Correlation between human immunodeficiency virus type 1 (HIV-1) RNA mea-surements obtained with dried blood spots and those obtained with plasma by use of Nuclisens EasyQ HIV-1 and Abbot RealTime HIV load tests. J Clin Microbiol 2009;47:1031–6.
10. Waters L, Kambugu A, Tibenderana H, Meya D, John L, Mandalia S, et al. Evalua-tion of filter paper transfer of whole-blood and plasma samples for quantifying HIV RNA in subjects on antiretroviral therapy in Uganda. J Acq Immune Def Synd 2007;46:590–3.
11. Monleau M, Montavon C, Laurent C, Segondy M, Montes B, Delaporte E, et al. Evaluation of different RNA extraction methods and storage conditions of dried plasma or blood spots for human immunodeficiency virus type 1 RNA quan-tification and PCR amplification for drug resistance testing. J Clin Microbiol 2009;47:1107–18.
12. Marconi A, Balestrieri M, Comastri G, Pulvirenti FR, Gennari W, Tagliazucchi S, et al. Evaluation of the Abbott real-time HIV-1 quantitative assay with dried blood spot specimens. Clin Microbiol Infect 2009;15:93–7.
13. Travers SA, Clewley JP, Glynn JR, Fine PE, Crampin AC, Sibande F, et al. Timing and reconstruction of the most recent ancestor of the subtype C clade of human immunodeficiency virus type 1. J Virol 2004;78:10501–6.
14. Bland JM, Altman DG. Statistical methods for assessing agreement between two methods of clinical measurement. Lancet 1986;i:307–10.
15. Kane CT, Ndiaye HD, Diallo S, Ndiaye I, Wade AS, Diaw PA, et al. Quantitation of HIV-1-RNA in dried blood spots by the real-time NucliSENS EasyQ HIV-1 assay in Senegal. J Virol Meth 2008;148:291–5.
16. Alvarez-Munoz MT, Zaragoza-Rodriguez 1 S, Rojas-Montes O, Palacios-Saucedo G, Vazquez-Rosales G, Gomez-Delgado, et al. High correlation of human immunodeficiency virus type-1 viral load measured in dried-blood spot samples and in plasma under different storage conditions. Arch Med Res 2005;36:382–6.