University of Rome “Tor Vergata”
Department of electronic engineering
Doctorate in
Sensorial and learning systems
engineering
Title of the thesis
Analytical
System with Familiar Devices
XIX Cycle
Acknowledgments
First of all, I would like to give my special thanking to the Doctorate Coordinator, Prof. R. Marino, to my Doctorate Supervisor Prof. C. Di Natale, to Prof. A. D’Amico and Prof. R. Paolesse from our University for their important contribution to this thesis.
I wish also to thank Prof. I. Lundstrom and Prof. D. Filippini for giving me the possibility to establish a continuous and fruitful collaboration with the Department of Physics of
University of Linkoping, Sweden.
I would like to also thank Dr. G. Ciolfi and Dr. S. Moretti from Isituto Sperimentale per
l’Enologia, Velletri (Rome) for the contribution to the experiments on wines, and Ginevri s.r.l from Pavona (Rome) for the contribution to the experiments on bilirubin.
I’m deeply indebted with all my friends from laboratories of Electronic Engineering and
Sciences and Chemical Technologies Departments, and CNR-IMM, where I’ve been able
Index
Preface
IIntroduction
(Chemical Optical Sensors Overview)
IV
Chapter 1
CSPT: Computer Screen Photo-assisted Technique
Introduction 2
1.1 The Colour: the human perception of electromagnetic field 3
1.2 The Concept 10
1.2.1 LCD Screen as Programmable Light Source 10
1.2.2 WebCamera: three filters Light Detector 12
1.3 CSPT working principle 13
1.3.1 Programs description 16
1.4 CSPT-Spectral features: Fingerprints extraction 19
1.4.1 RGB-Colour sequence optimization 23
1.4.2 Effect of fingerprints conformation 24
1.4.2.1 Difference Fingerprints 25
1.4.2.2 Ratio Fingerprints 26
1.5 Measuring platform 28
1.6 Two different modalities: Spectroscopy and E-nose 33
Chapter 2
Chemical-Interactive-Materials: Porphyrins, related Metal complexes
and TetraPyrrolic Compounds
Introduction 45
2.1 Biological role of Porphyrins in Nature 46
2.2 A brief History of Porphyrin Chemistry 48
2.3 Properties and Characteristics of Porphyrins 49
2.4 Photophysical Features of Metalloporphyrins 52
2.4.1 Absorption Spectra 52
2.4.1.1 “Normal” 52
2.4.1.2 “Hypso” 54
2.4.1.3 “Hyper”: p-hyper, d-hyper 55
2.4.2 Emission Spectra 56
2.4.3 Optical Classification of Metalloporphyrins 59
2.4.3.1 Regular 59
2.4.3.2 Irregular 59
2.4.3.3 Pseudonormal 61
2.5 1,19-diunsubstituted a,c-Biladienes 62
2.6 Exploited CIMs Spectra 63
References 66
Chapter 3
CSPT-Enose mode based Chemical Sensor Array
Introduction 70
3.3.1 Experiment details and Measurements setup 76
3.3.2 Spectral-Fingerprints extraction 78
3.3.3 Principal Components Analysis of Spectral- Fingerprints 81
3.3.4 Analysis of the chemical responses 83
3.4 Fish Freshness Detection 85
3.4.1 Fish Headspace and Chemical Sensors 86
3.4.2 Description of two experiments type 88
3.4.2.1 Samples 89
3.4.2.2 Instrumentations 89
3.4.2.3 Procedures 93
3.4.3 Results and Discussion 94
References 104
Chapter 4
CSPT-Spectroscopy mode: Wine Optical Properties detection and
Bilirubin analysis
Introduction 111
4.1 Wine optical properties description 111
4.2 Measurements details 117
4.2.1 Wine Samples 117
4.2.2 CSPT Arrangement 118
4.2.3 Reference Methods 120
4.2.4 Results and Discussion: PLS Analysis of CSPT-Fingerprints 120
4.3 Bilirubin Analysis 125
4.3.1 Bilirubin in children blood 125
4.3.2 Bilirubin experiment description 126
Chapter 5
Further Applications
Introduction 136
5.1 A hybrid sensor array based on Optical and Mass transducers 136
5.1.1 Measurements Description 137
5.1.2 QMB features, CSPT fingerprints and Data Fusion PCA based on Analysis 140
5.2 A prototype of CSPT platform for mobile telephones 145
5.2.1 Measurements Description 145
References 151
Preface
In the last few years there has been a huge demand to monitor different chemical environments, such as for example urban indoor and outdoor atmospheres, food aromas, etc. Chemical sensors are among the most promising devices to be exploited for these kind of applications.
The structure of a generic chemical sensor can be ideally divided in two subunits: the sensing material and the transducer.
The Chemical Interactive Material (CIM) interacts with the chemical species present in the environment by changing some of its physico-chemical properties, while the transducer transforms these variations in a readable signal, generally an electric signal.
Then, one of the possibility, of course much rising, to developing a chemical sensor is to exploit the optical proprieties of the CIMs.
Indeed, optical properties of sensitive layers are very interesting to fabricate chemical sensors because the optical properties, such as absorbance and fluorescence, are strongly influenced by the interaction with guest molecules. Nonetheless, the chemical practice of this approach is badly balanced by the transducer counterpart. Indeed, traditional optical instrumentations of high quality are usually bulky and expensive.
For example, the measure of fluorescence for analytical purposes is rather limited by the relative complexity and cost of the opto-electronic setup although the miniaturization efforts have reduced the complexity and the cost of such instrumentations, the application of optical methods, although encouraging, has been hindered by the relative high cost of the instrumentation.
On the other side in the last decade, in spite of the high cost of optical instruments, we assisted to a fast growth of performance in fields as consuming electronics, giving rise to a number of low-cost advanced optical equipments such as digital scanners, cameras, and screens whose characteristics largely fit the requirements necessary to capture change of
optical properties of sensitive layers in many practical applications, that could be usefully exploited in routine analysis.
A first demonstration in this direction was given by Suslick and colleagues when they shown how a simple flatbed digital scanner could be converted into a powerful analytical instrument for the detection of subtle colour changes in chemical dyes for the detection of volatile compounds. More recently Filippini and Lundström showed that a combination of a computer monitor and an inexpensive web cam may be turned into a sort of spectrophotometer instrument. This last technique, known as Computer Screen Photo assisted Technique (CSPT) is based on the fact that a computer screen can be easily programmed to display millions of colour, combining wavelengths in the optical range. Compared with the use of digital scanner, to probe the sample with a variable combination of wavelengths instead of use the white light of scanners, gives the possibility to perform a spectroscopy measurement combining absorbance and fluorescence of samples. Due to the large diffusion of portable computers, PDAs, and cellular phones all endowed with colour screen, camera, and an even more extended computation capabilities, the application of the CSPT concept may be foreseen as to give rise to a sort of ubiquitous analytical capacity. Then CSPT could in principle be used to detect general parameters related to the absorbance-emission spectra of every material under observation.
In this Thesis, we show the possibility to use this very simple platform, based on computer screen and a web cam (CSPT), in two different configuration (Enose-mode and Spectroscopy mode), for very different kind of applications.
In fact, in the first case, we present a chemical gas sensor array where the optical features of layers of chemicals are transduced by CSPT-Enose mode (Chapter 3 and 4); while in the second case we highlight the potentiality to use the CSPT such as a spectrophotometer, to directly optical characterize the compounds that we are observing (Chapter 5).
I
NTRODUCTIONIn the last years there has been a huge progress in Chemical Optical Sensors, nowadays optical sensors are used in numerous scientific and technical applications. The recent increase of the exploitation of optical sensors in research and development, in automation and many kinds of measuring systems has made impossible describing in details all chemical optical sensors in few pages but only giving an introductory overview. There are also a large a variety of different components that are used in sensor technology: light sources, detectors and different kinds of optical parts. The availability of semiconductor light sources, detectors, fibre and integrated optics and image sensors has provided us with revolutionary opportunities for new and even, in some cases, low cost optical sensors. Furthermore different detection schemes depending on wavelength, phase and pulsetime. For all these reasons only some of the main sensors will be shown, providing knowledge on a variety of optical sensor techniques: in fact the unique aim of this survey is giving a concise collection of knowledge to this highly interdisciplinary field, an ideal starting point and a source of information.
O
PTICAL RADIATIONThe Optical radiation is part of electromagnetic radiation, which extends over a continuous spectrum and is embedded approximately from wavelengths of 1 nm to 1 mm, the range between X-rays and radio waves, as shown in Figure 1. The propagation of electromagnetic waves is completely described by a system of differential equations, known as Maxwell’s equations, and by the electromagnetic properties of the medium. The electromagnetic radiation has a continuous spectrum; the different spectral range are fixed by convention and there exists no discontinuity in the spectrum.
Figure 1: The electromagnetic Spectrum.
The basic laws of electromagnetism were found by Coulomb, Ampère, Gauss, Faraday, Biot and Savart. Maxwell combined the different observations to a consistent set of differential equations by introducing four vector fields, which depend on space and time.
For the purposes of this Thesis, it is not important describing in details the propagation laws of optical radiations and the optical components that are used in systems like sensors to collect, distribute, modify or analyze optical radiation, but the aim is showing an overview of the main techniques used in chemical optical sensing.
O
PTICALS
ENSORSOptical sensing became a key technique for many measuring tasks, so a growing numbers of chemical optical sensors are continuously developed. In general optical sensors are devices that measure the modulation of a light property, i.e. they can measure absorbance, fluorescence, reflectance, refractive index, interference, polarization and scattering. Optical sensors are formed by 4 or 3 components:
1. Light source (such as solid state laser, laser diode, light emitted diode (LED)
etc, for investigating the sensor;
2. Optics for guiding light to and from the Sensor;
3. Detector (such as photodiode, CMOS detector, charge coupled device (CCD)
camera etc)for detecting the light signal coming from the sensor; 4. The Sensor.
There are two many kinds of optical sensors:
♦ Intrinsic and
♦ Extrinsic.
In the first case the chemical species that must be measured, are themselves the sensors so only three components are required inasmuch as the sensor transduction mechanism is intrinsic to the molecule. In fact some organic molecules absorb light at particular wavelengths and/or fluoresce and therefore emit light at specific wavelengths. In this way we can detect directly these kind of molecules simply by measuring absorbance and/or fluorescence at their absorption and emission wavelengths.
In the second case, the most optical sensors, an sensing material, that changes the optical properties, is employed. These species can be very different, polymers, dyes, porphyrins and all the materials that can interact with the analytes changing or modulating optical signals. Besides a lot of substrates can be used for optical sensors such as glass slides, polymeric films etc.
A wide range of light-based chemical sensors have been developed using a variety of different devices and materials, then in the next paragraphs will be shown some of the key approaches for building optical sensors highlighting every time the different waveguides used, the several sensing materials exploited and the optical transduction mechanisms. The huge possibility of developing optical chemical sensors, for example matching different sensing materials with several waveguides, it has made impossible finding a key to separately classify the different methods used or the single applications developed , but only giving an brief overview.
F
IBRE-
OPTIC APPLICATIONSCentral to many optical chemical sensors is the exploitation of one of the several available waveguides. Fibre-optics, capillary tubes and planar waveguides all use the phenomenon of total internal reflection. The increasing use of optical fibres along with photosensors and optical transducers has led to the development of a range of devices that are specially intended for chemical optical sensors. The development of optical sensors became feasible with the availability of optical fibers in the visible range. Recent developments are concerned with the extension of the visible spectral range to include fiber-optic sensors in the UV, near-and mud-IR range. Apart from fiber optical sensors, there is also an interest in sensors based on planar optics.
One of the more interesting methods to employ for building a chemical optical sensors is the fluorescence, because of well separated excitation and emission spectrum, high quantum yield, and intrinsic sensitivity. Fluorophores are molecules that absorb light at specific wavelengths and emit light a longer wavelengths. This difference in wavelengths and thus in energy is due to the Stoke’s shift and represents vibrational relaxation and other energy losses [1]. Quantum yield or quantum efficiency is how well absorbed photons are converted to emitted photons.
In general, fiber optical sensors generate an optical signal in proportion to the analyte concentration. The application of optical fibre sensing technique to chemical and biochemical sensing, with applications in industrial plant and to a large range of biomedical functions, is one of the fastest growing areas in opto-electronics. There are essentially two main techniques currently under investigation:
The first uses a multimode fibre to convey light to a sample region, where it either suffers spectrally-dependent absorption or causes fluorescence in the chemical sample (or CIM). The absorption/fluorescence spectra are then monitored via the light returning in the same, or other, fibre.
The second technique involves coating the tip of a fibre with a material which reacts more or less selectively with an analyte present in a sample, in a predictable way, to provide measurable changes in the optical properties of the material. These changes may again be in the absorption/reflection spectra, or in the nature of the fluorescence. Furthermore if the indicator is immobilized on the core of a waveguide, the measurement of evanescent waves is feasible for determination of analyte.
The fibre tips, in both the above cases, are sometimes referred to as “optodres” or “optodes”. The simplest type of optical fiber sensor involves coupling an optical fibre to a spectrophotometer. With this device, the color of fluorescence of solutions or of bio-chemical matter can be measured. In this case, the waveguide merely serves to transfer the radiation. Instead of a photometer the fibers may be linked by means of a optoelectronic circuit; in this case, the light source can be a light emitted diode (LED) and the detector a photodiode.
In order to illustrate the applicability of fiber-optical sensors some fundamentals of waveguides are considered.
Fibre cable consists of a core (the waveguides) and a cladding both made from glass, quartz, or plastic. The cables diameters range from 0.05 μm to 0.6 cm. The light propagates down a single fibre or a fiber bundle. The bundle can be arranged randomly or in a fixed position at the input and output of the fiber. When light reaches the waveguide, part of it is transmitted and part is totally reflected.
For the total reflection of light to occur, a critical angle θ is necessary, and the refractive index of the core n1 has to be higher than the refractive index of the cladding
n2. The refractive index of the glass core is ~ 1.6 and that of glass cladding ~ 1.5. For
measurements in the mid-IR range other materials are necessary. The critical angle θ is determined by the numerical aperture (NA) of the waveguide. NA depends on the refractive index of the core n1 and of the cladding n2:
n
n
The larger the numerical aperture, the more light the waveguide can capture and transmit.
There are many examples of application that involve fibre-optics in optical chemical sensing. Walt [2] et al. first combined fiber-optics with fluorescent dyes for measuring of organic compounds in 1991. They had used a polarity-sensitive, solvatochromic dye Nile Red. Other research groups have also exploited fluorence-based technique for vapor sensing. There are some mechanisms that give florescent properties to dye. One of these is TICT, twisted intramolecular charge transfer, excited state. Exploiting this mechanism Orellana [3] has been able to demonstrate the reversible measurement of various alcohols by absorbing these particular dyes to silica gel and immobilizing the resulting gel at the tip of an optical fibre. Since these first experiences an increasing number of research groups have begun to incorporate betaine dyes onto the end of optical fibres in various ways to develop chemical sensors.
The sensors based on solvatochromic dyes embedded in polymers have been exploited to develop a cross-reactive vapor sensors array by Dickinson [4]. In this device, Nile Red was immobilized within different polymers, which were dip coated onto the ends of individual optical fibres. Nineteen sensors were bundled into an array format. Upon exposure to an organic vapor, each polymer sensor absorbed vapor according to its partition coefficient for that vapor. The change in each sensor’s fluorescence spectrum depended on how much vapor partitioned into that sensor as well as the difference between the vapor’s and polymer’s polarities. Fluorescence detection was accomplished by using a two-dimensional detector, a CCD camera, so that we could acquire fluorescent signals from all the sensors in the array simultaneously. To simplify signal detection, the fluorescence was collected at a single wavelength by interposing an emission filter between the fiber and the CCD chip. Some of the polymers exhibited a swelling effect in which the polymer volume increased as vapor partitioned into it. Therefore, the response of each sensor is due to a combination of vapor partitioning into the polymer, polarity differences between the polymer and the vapor, but also polymer swelling. But, because this deposition method ,there were a
lack of reproducibility of the sensing films. To avoid this effect has been exploited the difference in materials composition between clads and cores, that provides a method for selectively etching the cores. When the polished distal tip of a custom optical imaging fiber array is placed into an acid etchant, the cores etch at a faster rate than the clads leading to an array of wells. At the bottom of each well is the distal face of an optical fiber. In this way, each well is "optically wired" to its own individual optical fiber. We discovered that latex or silica beads, matched in size to the dimensions of the individual wells, would spontaneously assemble into each well in a highly efficient self-organizing fashion. This approach could be used to create sensor arrays based on polymeric microspheres. Microspheres sensors can be created by taking monodisperse polymeric microspheres and swelling them in a suitable organic solvent containing dissolved Nile Red [5]. Upon removal from the solvent, evaporation of residual solvent occurs resulting in Nile Red being trapped within the polymeric matrix. Another class of bead sensors uses surface modified silica beads to which Nile Red is adsorbed. Many different bead types can be prepared out of a variety of polymers and surface functional groups. To create a sensing array, the desired individual bead types are mixed, i.e. 100 milligrams of beads contains approximately 10 billion beads. Then, the beads are randomly distributed onto the distal face of an etched imaging fiber such that one bead occupies each well. In order to register the position of each bead in the array after fabrication, the fiber is connected to the optical imaging system and a vapor is pulsed onto the fiber’s sensor end and a registration protocol as “self-encoding” is used to identify them.
All the sensor beads of a particular type give virtually identical responses because they are all prepared at the same time. Another important feature of these cross-reactive optical arrays is the built-in redundancy of each of the sensors: replicates provide significant advantages in terms of signal-to-noise. The microsphere arrays also have several other advantages such as flexibility of array types, scalability, and simple manufacturing. The major limitation with fluorescent dyes for optical sensor arrays is photobleaching: upon exposure to light, any indicating material loses its intensity
because of photooxidation. Nevertheless all the limitations due to their short history, this kind of “optical electronic” noses are very interesting for very point of views. Another possibility is the exploitation of host-guest supramolecular chemistry for sensing. Host compounds that trap guest molecules have been used for detecting solvent vapors [6]. These host materials surround the guest vapor molecules and form inclusion complexes with specific crystal structures that show both wavelengths shift and quantum intensity changes in their emission spectra. This bathochromic shifts are due to various energy losses relative to increased packing density.
Another possible approach is the exploitation of chemiluminescence based sensors that used chemically reactive materials capable of directly emitting photons following oxidation, without using an excitation source to generate the emission signal. In this way becomes possible simplify the instrumentation. This technique has been used to detect oxygen, metal ion and organic vapors (chlorinated hydrocarbons, hydrazine and ammonia [7]). The reagent luminol was used to detect oxidants, while a Ru(bpy)33+ complex was used for reductants. Luminol sensing capacity was expanded to halogenated hydrocarbons by the addition of an in-line heated platinum filament used as a pre-oxidative step.
C
OLORIMETRIC TECHNIQUESThese sensors are able to measure indicator color changes. They can measure changes in absorbance and/or in local refractive index. There have been developed a lot of vapor sensors using colorimetric techniques. One of these was done by Wohltjen et al. [8] that developed a reversible capillary tube for detecting ammonia, hydrazine and pyridine, by coating a glass capillary with an oxazine perchlorate dye film. This dye upon exposure to these volatile compounds changes its color and then its transmission property. This change is revealed by using a simple phototransistor. Stetter, Maclay and Ballantine [9], in similar vay, detected and quantify H2S and HCl acid vapors down to 10 ppb level by using a coating of bromothymol.
Even commercial thermal printer papers have been exploited to measure solvent vapors. Wolfbeis and coworkers [10] showed that these materials have reversible interactions with solvent vapors, and when they were being exposed to ether they produced a black color or a dark blue. Were developed sensors for detecting typical laboratory solvents (i.e. alcohol, acetates etc) by incorporating these papers into various optical devices and monitoring light absorption at 605 nm.
Polymers are another class of compounds most exploited in optical vapor sensing for their differential vapors sorption and binding properties as well as their emissive properties. An example is a amine-containing poly(vinylchloride) membranes based sensor that detects 2,4-dinitrotoluene (DNT), a compound commonly present in land mines [11]. Absorption into the polymer generates a complex with an absorbance at 430 nm that is monitored over time to detect DNT level.
Therefore the importance of sensing material is clear in all of these different methods. Also inorganic compounds are successfully exploited as sensing materials. Mann et al. [12] have demonstrated shifts in maximum absorption and emission wavelengths of platinum and palladium isocyanide complexes upon exposure to VOCs. For example the Pt-Pt compound [Pt(p-C10H21PhNC)4][Pt(CN)4], was used to detect CHCl3.
Photostability and an insensitivity to water vapor make inorganic materials particularly attractive for incorporation into an electronic nose sensing device. Metalloporphyrins, as will be shown in detail in Second Chapter, are good inorganic sensing materials as they are well-characterized, stable and easily modifiable by a wide range of central metals and/or external substituents. D’Amico and colleagues [13] have developed a device for distinguishing between six different liquors by monitoring absorbance changes with a simple LED and photodetector system exploiting an array of cross-sensitive metalloporphyrins.
Suslick and Rakow [14] also exploited an array of different metalloporphyrins, in this experience with an inexpensive and consumer device, a flatbed scanner. This array was formed by spotting these CIMs onto silica TLC plates. The measure has been performed by simply color subtracting of the array imaging before and after vapor exposure, acquired by the scanner. 15 minutes exposures were used to ensure maximum array response, good reversibility, reproducibility and sensitivity. These two previous examples of optical sensors are the precursors of further opto-electronic noses.
S
URFACEP
LASMONR
ESONANCECoordination polymers can be also exploited as sensing layers in a Surface Plasmon Resonance (SPR) setup for detecting ethanol, water, toluene, benzene and acetonitrile [15]. The SPR method exploits the delocalized conducting electron clouds found at the surface of metal films such as gold or silver. These electron clouds maintain a collective wave vector parallel to the interface. Therefore, by lighting with a particular wavelength and polarization at the interface, any changes in the refractive index at the surface, caused by the sorption of vapor molecules into a polymer network at the surface, can be measured in real-time by monitoring the illumination angle needed to give a minimum in the measured reflected light. Otherwise a white light source can be used to investigate the wavelength at which the SPR occurs [16]. The refractive index change could be correlated with the swelling swelling and increased density of the polymer due to absorption of the volatile compounds. Abdelghani et al. [17] have exploited the PSR method with an optical fibre. They have coated the core of silica fibre by a 50 nm thick layer of silver and, to protect against oxidation, have assembled alkanethiol layers onto the silver layers. Finally they have chosen a fluorinated siloxane layer because its refractive index, surface tension and gas permeability properties. By this sensor they have detected high ppm level for both the aromatic and chlorinated compounds with very long measure and recovery times.
I
NTERFERENCE AND REFLECTION BASED TECHNIQUESAnother interesting technique is the use of interference spectroscopy. In fact the analyte-swelled polymer layers have much larger changes in optical thickness then refractive index [18]. In this way Gauglitz et al. have developed Reflectometric Interference Spectroscopy (RIfS) techniques for optical vapor sensing. In this approach, light incident at the interface between two planar optical layers can be reflected from both the top and bottom of a polymer sensing film, setting up an interference pattern that is very sensitive to changes in the optical thickness of the polymer layer. Unfortunately these devices are usually much expensive, even if less expensive RIfS sensors with comparable sensitivity have been developed using four inexpensive LEDs and a single photodiode [19].
The RIfS technique has also been extended to enantiomer discrimination. By depositing polymer solutions containing chiral peptide residues from the ‘Chirasil-Val’ chromatographic stationary phase, Göpel and colleagues [20] studied the responses of their sensors to several mixtures of (R) and (S) – methyl lactate in varying proportions. Interference methods have been also applied to porous silicon chips (PSi). Sailor et al. [21] have developed simple chemical etching methods for generating porous silicon films that display both interferometric and photoluminescence properties. In the case of photoluminescence, the quenching can be induced via energy transfer by the adsorption of analyte molecules in the pores of the silicon. Thus, by monitoring emission at a specific wavelength (670nm in this experience), sharp decreases can be observed in intensity as the interaction with analyte vapors becomes. Likewise, adsorption events give rise to refractive index changes that lead to shifts in Fabry-Perot interference fringes, measured as changes in reflectivity. Both of these optical attributes were recently used to measure a range of perfumes and solvent vapors.
Another absorbance-type of vapor sensor is based on simple transmission attenuation through a fibre. Microbending caused by the vapor-induced swelling of siloxane layers adjacent to the fibre results in transmission attenuation [22].
Resonating microcantilevers, such as those used in atomic force microscopy (AFM) for atomic-level imaging, are another creative reflection-based method for chemical sensing . Based on the mass-sensing concepts of resonating piezoelectric crystals (e,g, quartz crystal microbalance (QCM)), the approach uses 180 μm-long cantilevers micromachined into silicon that are sensitive to changes in mass occurring at their surfaces. Several groups have explored coating polymer films onto these cantilevers and measuring small changes in mass loading. The technique uses optical detection by measuring the deflection of an incident laser beam as analyte vapors are adsorbed to the surface.
Another research group [23] developed arrays of differentially-coated cantilevers for detecting alcohols, water vapor and several natural vapors. The array sensor was constituted of eight cantilevers coated with different thin films (platinum, PMMA, alkythiol SAMs and zeolites). They used a single laser and a photo-sensitive device for reading sequentially out the array.
S
CANNING LIGHT PULSE TECHNIQUELundstrom et al. [24] have developed an innovative optical technique: the so called Scanning Light-Pulse technique. The light impinges on the surface of a MOSFET coated with a thin metal film and penetrates the metal to induce a photocapacitive current. To maintain a constant current, the applied gate voltage must be varied to sustain a constant surface potential. Changes in the gate voltage are monitored and result in a map of ΔV as a function of position on the sensing surface. In a particular experience for detecting ethanol, hydrogen and ammonia, a MOSFET array was coated by three continuous strips of Pt, Pd, and Ir. The sensor surface was divided into a grid, and a temperature gradient (110 - 180°C) was established down the length of the sensor surface. This temperature gradient provided a different sensitivity and selectivity at each point of the sensor grid. The results of measurements were a map of the changes in voltage (ΔV). In this way image maps of the gases were created. These sensor grids can be applied to identifying gas mixtures, rapid and simultaneous screening of new sensing materials, and mapping spatially inhomogeneous reactions. Light-pulsed sensing combines many types of information, including the catalytic activity of the gate metals, gas flow turbulence, edge effects, etc. While not an optical detection technique, the method demonstrates the utility of employing light combined with electrochemical detection.
Transduction Technique
Description
Luminescence Fiber-optic sensors using polarity sensitive fluorophores such as
solvatochromic or TICT dyes.
Randomly-assembled solvatochromic bead arrays.
Host-guest supramolecular chemistry: shifts in wavelength and intensity of “fluoroclathrands” based on packing density changes caused by vapors.
Chemiluminescence-based detection, using luminol and Rubipy dyes.
Colorimetric Color changes of an oxazine perchlorate dye coated on glass capillaries.
Bromothymol blue in Nafion polymer layers. Thermal printer papers as vapor sensors.
Inorganic sensing materials (e.g. Pt-Pt compounds): color changes caused by perturbation of stacking in charged complexes.
Metalloporphyrins: formation of coordination complexes with analytes, and use of different metals for changing sensing properties..
Surface Plasmon Resonance (SPR)
Method for detecting changes in refractive index at a surface.
Interference, reflection Reflective Interferometric Spectroscopy (RifS) for detecting changes in
optical thickness of polymer layers.
Interference measurements using chemically etched porous silicon chips.
Mass loading Detecting mass changes on resonating AFM microcantilevers.
Scanning light pulse technique
Detecting voltage changes at a MOSFET surface using light to generate the photocapacitive current.
A
DVANTAGES ANDD
ISADVANTAGES OF OPTO CHEMICAL SENSORSOptical transduction methods based on sensors have a lot of advantages over other sensing methods. First of all most of devices (light sources, optics and detectors) used for optical sensors have been already well developed for other applications. Moreover optical signals are not sensitive to electromagnetic interferences. Light is fast and its attenuation is very low through modern optical fibre, that enables remote sensing over long distances without amplifiers or repeaters. Fluorescence, but in general all the optical measurements, is extremely sensitive and can be exploited to detect lowest concentration levels of molecules. Optical sensing can be multiplexed because different optical signals can be carried and detected simultaneously (i.e. optical fibres). On the other hand, there also some disadvantages. Optical devices are often much expensive and complex. Optical technique are sometimes sensitive to interference by stray light. Besides fluorescent indicators often are photodegradable. For these reasons a variety of electronic noses have been developed exploiting different optical transduction methods [25].
R
EFERENCES
[1] J. Lakowicz, Principles of Fluorescence Spectroscopy. Plenum Press, New York, 1982. [2] S. Barnard, D. R. Walt, Environ. Sci. Technol., 1991, 25, 1301-1304.
[3] G. Orellana et al, Anal.Chem. 1995, 67, 2231 – 2238.
[4] T.A. Dickinson, D.R. Walt, J. White, J.S. Kauer, Anal. Chem., 1997, 69, 3413-3418 [5] T.A. Dickinson, K.L Michael, J.S. Kauer, D.R. Walt, Anal. Chem., 1999, 71, 2192-2198.
[6] T. H. Brehmer, P. P. Korkas, E. Weber, Sensors and Actuators. 1997, 44, 595 – 600. [7] G. E. Collins, S. L. Rose-Pehrsson, Sensors and Actuators. 1996, 34, 317 – 322
[8] Giuliani et al. Reversible Optical Waveguide Vapor Sensor. United States Patent Number 4,513,087. April 23, 1985.
[9] J.R. Stetter, J. Maclay, D.S. Ballantine, Optical Waveguide Vapor Sensor. United States Patent Number 5,315,673. May 24, 1994.
[10] H. E. Posch, O. S. Wolfbeis, Pusterhofer, J. Talanta. 1988, 35, 89 – 94.
[11] L. Gheorghiu, W. R. Seitz, D. Arbuthnot, J. L. Elkind. SPIE Conference on Environmental Monitoring and Remediation Technologies II. 1999, 3853, 296 – 302.
[12] C. A. Daws, C. L. Exstrom, J. R. Sowa, Jr., K. R. Mann. Chem Mater. 1997, 9, 363 – 368.
[13] A. D’Amico et al. Sensors and Actuators. 1999, 65, 209 – 215. [14] N.A. Rakow, K.S. Suslick. Nature. 2000, 406, 710 – 713. [15] R. Casalini et al,. Sensors and Actuators. 1999, 57, 28 – 34.
[16] R.W. Nelson, J.R. Krone, O. Jansson, Anal. Chem., 1997, 69, 4369-4374. [17] A. Abdelghani et al,. Analytica Chemica Acta. 1997, 337, 225- 232.
[18] K. Spaeth, G. Kraus, G. Gauglitz, Fresenius’ J. Anal. Chem., 1997, 357, 292.
[19] R. Reichl, R. Krage, C. Krummel, G. Gauglitz. Applied Spectroscopy. 2000, 54, 583 – 586.
[20] K. Bodenhofer et al. Nature. 1997, 387, 577 – 580.
[21] S. Letant, S. Content, T. Tan, F. Zenhausern, M. Sailor, Sensors & Actuators B¸2000, 69, 193-198.
[22] A. Yasser, B. Lawrence. Sensors. 1996, April, 76 – 77. [23] H. P. Lang, et al. Appl. Phys. Lett. 1998, 72, 383 – 385.
[25] K.J.Albert, N.S. Lewis, C.L. Schauer, G.A Sotzing, S.E. Stitzel, T.P. Vaid, and D.R. Walt, Chem Reviews, 2000, 100, 2595-2626.
C
HAPTER
1
Computer Screen Photo-assisted
Technique
I
NTRODUCTIONA lot of chemical and biochemical analysis make use of visible absorption measurements [1] to read the information they codify. Assays typically are arrays of samples with different transmittance spectra which suffer changes upon target reactions, which are evaluated with dedicated and expensive instruments which minimally comprise a two dimensional position controlled light source of tuneable wavelength and modulated intensity.
Furthermore these kind of assays are not universal, but optimised to identify well defined target processes instead, in this work the evaluation of visible absorption-emission is quite reduced simply using inexpensive and ubiquitous devices which can be universally used for very different sorts of chemical analysis.
In fact, in this Thesis, we especially consider emerging applications as ‘home tests’ or ‘self-tests’ where the existing instrumentation is too expensive or complex, making necessary a more versatile and simpler approach.
In tune with this goal here are presented a method to measure visible absorption features by colour recognition using a programmable large area light source provided by broadly available LCD computer screens, working in the simplest case with a web camera as detector, the so called Computer Screen Photo-assisted Technique.
The computer screen photo-assisted technique (CSPT) is a method for optical characterization of absorbing, reflective or fluorescent substances that just utilizes regular computer sets and web cameras as a measuring setup. Due to their versatility and global dissemination, CSPT setups are an attractive alternative for the evaluation of home test; especially considering its natural ability to evaluate complex response patterns suitable with increasingly sophisticated tests for medical [2] or environmental purposes. CSPT is also an imaging technique able to adapt to multiple assay formats providing multiple determinations with a single familiar platform.
1.1. T
HEC
OLOUR:
THE HUMAN PERCEPTION OF ELECTROMAGNETIC FIELDTo well understand the CSPT work principle, it must be taken in account that the CSPT is essentially a colorimetric technique, for this reason in this Section will be shown some of the fundamentals of the Colour, and its perception by the human beings.
Optical radiation is part of electromagnetic radiation with wavelengths from 1 nm to 1 mm, the range between X-rays and radio waves. According to the vocabulary of the Commission International de l’Eclairage (CIE) [3] optical radiation is divided into many ranges which are shown in Figure 1 in the Introduction Section.
The visible spectrum is the portion of the electromagnetic spectrum that is visible to the human eye. Electromagnetic radiation in this range of wavelengths is called visible light or simply light. There are no exact bounds to the visible spectrum; a typical human eye will respond to wavelengths from 400 to 700 nm, although some people may be able to perceive wavelengths from 380 to 780 nm.
Figure 1.1: The CIE 1931 colour space chromaticity diagram with wavelengths in nanometers. Note that the colors depicted depend on the color space of the device on which you are viewing the image.
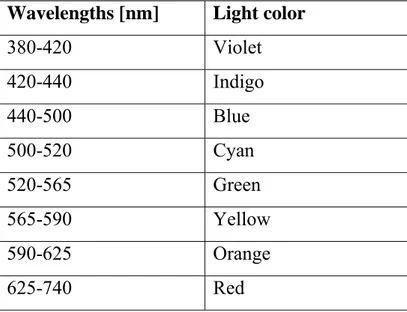
In Table 1.1 are reported all the primaries colors and relative wavelengths.
Wavelengths [nm] Light color
380-420 Violet 420-440 Indigo 440-500 Blue 500-520 Cyan 520-565 Green 565-590 Yellow 590-625 Orange 625-740 Red
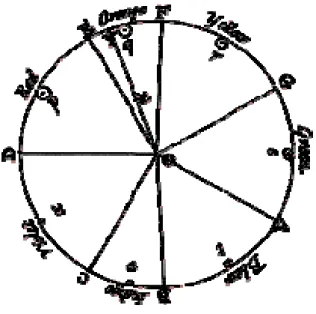
Newton divided the spectrum for the first time into seven named colors: Red, Orange, Yellow, Green, Blue, Indigo, and Violet; or ROYGBIV. He chose seven colors out of a belief, derived from the ancient Greek philosophers, that there was a connection between the colors, the musical notes, the known objects in the solar system, and the days of the week (Figure 1.2).
Figure 1.2: Newton's color circle, showing the colors correlated with musical notes and symbols for the planets.
The human eye is relatively insensitive to indigo's frequencies, and some otherwise well-sighted people cannot distinguish indigo from blue and violet. For this reason some commentators have suggested that indigo should not be regarded as a color in its own right but merely as a shade of blue or violet. Some of the explanations of the optical spectrum came from Isaac Newton, when he wrote his Opticks [4] (see Figure 1.3). Newton first used the word spectrum (Latin for "appearance" or "apparition") in print in 1671 in describing his experiments in optics. Newton observed that, when a narrow beam of white sunlight strikes the face of a glass prism at an angle, some is reflected and some of the beam passes into and through the glass, emerging as different colored bands. Newton hypothesized that light was made up of "corpuscles" (particles) of different colors, and that the different colors of light
moved at different speeds in transparent matter, with red light moving more quickly in glass than violet light. The result is that red light was bent (refracted) less sharply than violet light as it passed through the prism, creating a spectrum of colors.
Figure 1.3: Opticks or a treatise of the reflections, refractions, inflections and colours of light
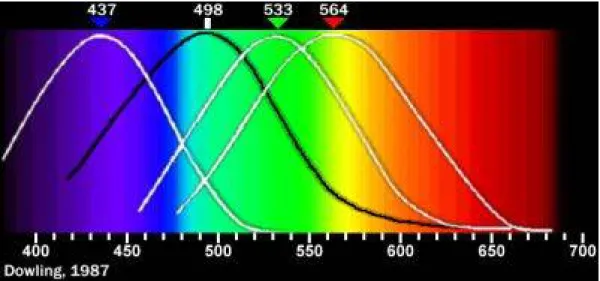
A light-adapted eye typically has its maximum sensitivity at around 555 nm, in the green region of the optical spectrum (see Figure 1.4). The spectrum does not, however, contain all the colors that the human eyes and brain can distinguish. Brown, pink, and magenta are absent, for example, it depends on the particular combination of the wavelengths in the light.
Figure 1.4: CIE eye sensitivity function V(λ) for the photopic vision regime mediated by retinal cone and rod cells. Also
shown is the eye sensitivity function for the scotopic vision regime, V (λ), that applies to low ambient light levels, and the circadian efficacy curve C(λ) derived from retinal ganglion cell photoresponse.
Then the colour is the human perception of light.
There are three types of color receptors (known as cone cells) in human beings. This confers trichromatic color vision, so these primates are known as trichromats. In the human eye, the cones are maximally receptive to short, medium, and long wavelengths of light and are therefore usually called S-, M-, and L-cones (Figure 1.5). L-cones are often referred to as the red receptor, but while the perception of red depends on this receptor, microspectrophotometry has shown that its peak sensitivity is in the yellow region of the spectrum. "Scotopic" (dark-adapted) and "photopic" (light-adapted) sensitivities differ; scotopic peak sensitivity (of the rod cells) is at about 500 nm, while photopic sensitivity (of the cone cells) peaks at around 550 nm (Figure 1.7). It is well known that the spectral sensitivity of the cone cell–rich central vision region of the retina is different from the rod cell–rich peripheral vision region of the retina.
Figure 1.5: Cone-cells properties.
Recently, a remarkable discovery was made: a fifth type of photoreceptor had first been postulated and then identified in the retina of the human eye, more than 150 years after the discovery of the rod cells and the red-, green-, and blue-sensitive cone cells [5, 6]. The fifth type of photoreceptor, the ganglion cell, had been believed to be merely a nerve interconnection and transmitter cell. Such cells are now believed to be instrumental in the regulation of the human circadian (wake-sleep) rhythm. Because ganglion cells are most sensitive in the blue spectral range (460 to 500 nm, Figure 1.4), they act as a “blue-sky receptor”, that is, as a high-color-temperature receptor. The physical process of seeing begins with the absorption of a photon by a pigment called "retinal". We can define a pigment as a substance which is "photoreactive", that is, which absorbs (and possibly re-emits) wavelengths in the visible range. The absorption causes a change in the geometry of the retinal (in the terms of organic chemistry, it changes from a "cis" to an "all-trans" configuration) [7].
This change in geometry takes place in about 6 ps. It has the effect of activating an enzyme (phosphodiesterase) which in turn hydrolyzes hundreds of "cylic-GMP" molecules (guanosine 3' - 5' phosphate) which in turn effects the sodium channels in optic nerves, initiating a nerve impulse. (Note that at the level of proteins, geometry defines function; this business of shape-changing, as well as "key and lock" shape fitting, is a ubiquitous signaling mechanism in the world of molecular biology.) The specific protein to which the retinal is linked determines the range of wavelengths to which it is sensitive. Retinal linked to rhodopsin has a peak sensitivity of about 498 nm. Rhodopsin is the protein in human rod cells as well as in many photoactive organisms.
The theories of color try to explain the phenomena of color vision; they are based on Grassmann’s law which states that each color can be realized by mixtures of three color stimuli [8, 9] matching the typical human cone responses (and the rod response) (see Figure 1.7)to monochromatic spectral stimuli.
1.2. T
HEC
ONCEPTThe measuring procedure of CSPT experiments is standard and very simple.
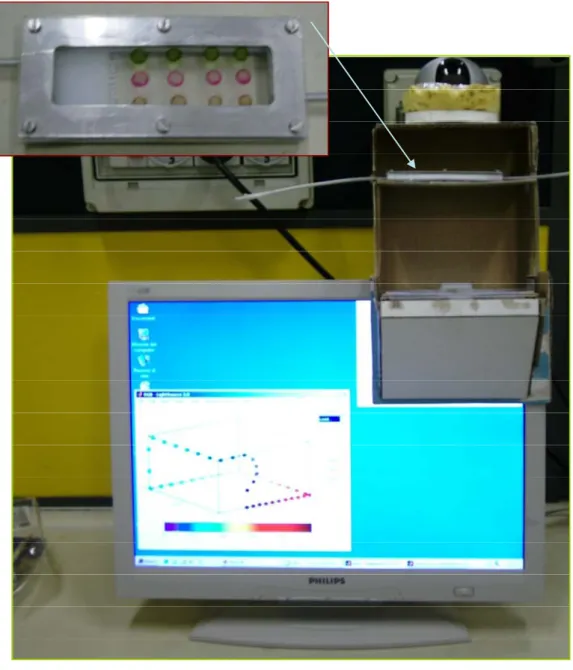
This kind of measurements only involves a desktop computer with a LCD screen and a webcam (in this Thesis a Logitech Quickcam pro 4000 operating at a resolution of 320x240 pixels) in addition to an suitable software that provides to acquisition and data analysis. During a CSPT measurement the screen illuminates the array with an appropriate sequence of colours, while the webcamera captures the image of the array under analysis in synchronism with the illumination. The result of this data acquisition is a video stream, where regions of interest (ROIs) are selected (white circles in Figure 1.8) and the intensity of the recorded pixels averaged into these regions chosen by us. The procedure is repeated along all 50 (length of the colour sequence) frames, corresponding to an illuminating sequence resembling the human perception of the visible spectrum. In this way a 50 elements vector is obtained for each ROI and camera channel. A fingerprint of the complete array is often constructed by concatenating red, green and blue channel vectors of each ROI and subsequently by collecting the different ROI vectors in a single (N*M*3) elements vector, where N is the length of the colour sequence, M is the number of the ROIs selected and 3 is the number of camera channel (Red, Green and Blue), as we will see in details in next paragraphs.
1.2.1. LCD Screen as programmable light source
Computer screens are not only our main computer interface, they are also widely configurable solid-state light sources [10]. They are capable of displaying confined areas of arbitrary shape, colour, and intensity that can be two-dimensionally scanned on the screen with 200 µm resolution [11]. All of this is achieved without moving parts and eventually has the possibility of becoming portable, as in the case of LCD displays in cellular phones. It is also true that they are not the natural choice of light sources for analytical purposes;
however, they are everywhere and always inherently combined with substantial computing power, and their versatility and processing capabilities allow many of their weaknesses to be overcome.
The research group of Suslick, as well as others, have already demonstrated that polychromatic source, as flatbed scanners, can be used as light source for colorimetric assays [12]. In our studies, the choice of LCD screen for this purpose has been shown more flexibility, as has been demonstrated by D. Filippini and I. Lundstrom [2]. In fact LCD screens and flatbed scanners have got similar lamp, how it can seen in Figure 1.8, where it is shown a comparison of the emission spectra for these two kind of devices. But the fundamental difference between using a device rather another one as light source, it is the possibility of modulating the intensity of emission spectra of the LCD screen [13]. The flatbed scanner give out pseudo white light whereas the emission spectra of second device can be suitable programmed with an appropriate software. In this way we can modulate intensity of the three primary band of emission (Red, Green and Blue) as we wish.
Instead of exiting the target assay only by a white polychromatic light, we are able to use different colours in order to deeper investigate optical properties of our array. Therefore we generate a two-dimensional widows with different tonality of colour simply weighting the three primary colours.
Figure 1.8: Scanner and LCD spectra emission comparison
1.2.2. Web Camera: 3 filters light detector
An increasing internet demand has allowed a multimedia devices evolution, like a web camera. Consequently a price reduction has introduced a huge number of suitable devices for our purpose. Therefore a web camera has become a familiar device with promising potentiality as instrumental for colorimetric assays [14].
The CCD (charge-coupled device) detector embedded, an invention originally intended for use as a digital memory, is the core of this kind of device. The basic building block for this detector is the MOS capacitor. It serves as a photon-sensing, storage and information-transferring element. A CCD is generally formed by an array of MOS capacitors in a two, three or four phase arrangement to the bus lines. Such as structure is capable of sensing a given light distribution by transforming incident photons into a pattern of discrete charges. A lot of webcameras have enough pixel resolution and a video setting control that enable for colour recognition. In fact a web camera like a Logitech Quickcam PRO 4000, with a CCD
detector operating at a low resolution of 320 x 240 pixels, it is enough for being used as light detector in the CSPT platform. It is obvious that the control of the camera parameters varies from platform to platform. So the goal is to retain as much as possible of the full range of each colour channel (0–255 counts) for spectrally coincident illumination, and simultaneously to have zero counts for illuminating spectra outside each camera filter.
1.3. CSPT
WORKING PRINCIPLEAs told above, the computer screen photo-assisted technique aims at evaluations of colorimetric assays [2] using only one instrumentation composed by regular computer sets and web cameras [15]. The availability and familiarity of such components are clear advantages, as are the versatility associated to the inherent computer power and the imaging capabilities supported by the web camera that enables the evaluation of assays with arbitrarily different formats.
In CSPT experiments, a part of the computer screen is used as a controlled light source displaying a colour sequence that illuminates the assay while the web camera records the image of the assay under the different illuminations. Further processing allows composing distinctive substance fingerprints from these measurements.
Figure 1.9: Schematic CSPT platform
Any colour, c(λ), displayed on the screen is represented by a linear combinations of the screen spectral radiances (R(λ), G(λ) and B(λ)) [10] as:
ci(λ) = riR(λ) + giG(λ) + biB(λ) (1)
where the triplet of weights (ri, gi and bi) specifies any particular color ci(λ) of an illuminating sequence s and λ is the wavelength, which in this thesis is limited to the interval [400, 700] nm.
True color screens can display up to 224 = 16.777.216 different colors defined by triplets (ri,
gi, bi) that can be represented as 3D points in a red, green and blue space. In the present study the color space is often represented by a 50 elements grid that retains its extremes and intermediate points.
Figure 1.10: User interface of MatLab Program that controls Acquisition of video stream (measure acquisition) . There is showed a sequence of 50 colors covering the whole visible range, represented in the 3D RGB Space.
The primaries themselves are not monochromatic but a particular spectral distribution instead, how it can be seen in Figure 1.11.
300 350 400 450 500 550 600 650 700 750 0 1000 2000 3000 4000 5000 6000 7000 8000 9000 10000 wavelenght /nm In te ns ity /a .u . 300 350 400 450 500 550 600 650 700 750 0 1000 2000 3000 4000 5000 6000 7000 8000 9000 10000 wavelenght /nm In te ns ity / a.u . 300 350 400 450 500 550 600 650 700 750 0 1000 2000 3000 4000 5000 6000 7000 8000 9000 10000 wavelenght /nm In te ns ity /a .u .
1.3.1. Programs description
All the processes, data acquisition, spectral fingerprints extraction and finally an appropriate multivariate data analysis, are managed by software.
A program written in MatLab® by us controls the illumination and camera acquisition composing as result of the measurement a video stream of the samples under different light colors. This can be done in different ways but in this case was carried out using specially designed software as described below.
Figure 1.12: Screen colors through magnitude of intensities of three primaries in 256 levels. Electronically determined through the choice of the three levels (color indices, rgb)
Acquisition v1.0, developed in MatLab 7 R14 conceived as a simple interface for users. This program controlled camera settings, image acquisition, illuminating colors and the numeric masking and data extraction of the ROIs, whose coordinates were read from a configuration file or manually written.
The software produced a data array containing intensity values of the selected ROIs that were transferred for analysis to a standalone mathematic kernel written in MatLab 7 R14. This program performed calibration and control routines, extracting CSPT spectral fingerprints from the ROIs that were then used for classification and subsequent evaluation of the assay. Subsequent processing allows the composition of sample fingerprints and color classification; the details of this processing and classification routines are discussed after, in the next paragraph.
All these processing steps are transparent to the user in Acquisition, which only interacts with a graphic user interface that does not request a particular carefulness and displays the results of the evaluation. The illuminating sequence can be chosen from a lot of presents or created by the user. The illuminating sequence oftener used in this study was a optimized 50 color set chosen for providing a good sample classification in a short measurement time. The optimization colour sequence is composed of 50 different colors displayed at a rate of 1 color per second, then the total measuring time is accordingly these 50 seconds used for acquisition plus few seconds for processing depending on the computational power of the particular device, computer, cellular phone etc. It must be noted that the imaging capabilities of CSPT allows acquisition of all the ROIs at the same time independently of the number of ROIs by contrast with conventional reading that takes several more time for colorimetric test.
Each frame of the video stream is masked with a configured pattern of circles (sensitive ROIs: Figure 1.13), as previous told, that extracts the average value of all the pixels within each circle (the pixels number changes in each different kind of assay) for each channel of the web camera and for each frame of the stream.So, for M samples illuminated by N different colors and observed through the three camera channels, all the acquired information can be collected in an average transmitted or reflected light intensity tensor Ii,j,k with:
In order to compensate from particular characteristics of the measuring platform and from random fluctuation of both LCD colour emission and Web camera RGB filters, a second set of regions is masked on the white regions between printouts. With similar procedures a reference tensor Ioi,j,k is composed (background ROIs: Figure 1.13)
Sensitive spots Background spots
Figure 1.13: ROIs selections : Two different kinds of ROI; On the left ROIs of a sensitive layer array; On the right a possible choice of ROIs for background compensation of the near sensitive spots.
1.4. CSPT-S
PECTRAL FEATURES:
F
INGERPRINTS EXTRACTIONFor each color displayed on the screen, a composed spectral radiance is emitted and specifically modulated by the transmittance of the tested substance T(λ). The emerging light passes through the camera filters (FR(λ), FG(λ) and FB(λ)) exciting the detector, which has a
defined spectral response D(λ).
The transmittance corresponding to a substance j, is modelled as:
2 ) ( -j( )=1- e T λ λ−λjσ (1.2)
where σ =50 nm and λj indicates the minimum transmittance of the substance j.
The measured intensities of every camera pixel, for every illuminating color i and substance
j is then calculated as:
( ) ( )
( ) ( )
( ) ( )
( ) ( )
( ) ( )
( ) ( )
⎪ ⎪ ⎪ ⎩ ⎪ ⎪ ⎪ ⎨ ⎧ ⋅ ⋅ ⋅ ⋅ = ⋅ ⋅ ⋅ ⋅ = ⋅ ⋅ ⋅ ⋅ =∫
∫
∫
λ λ λ λ λ λ λ λ λ λ λ λ λ λ λ λ λ λ d D F T c I d D F T c I d D F T c I B j i j Bi G j i j Gi R j i j Ri , , , (1.3)The result of illuminating with a color sequence of N colors is to obtain an intensity profile from each channel of the web camera.
A common practice in CSPT experiments is to concatenate the intensity profiles of the camera channels forming a 3×N elements vector for every substance j.
⎪ ⎩ ⎪ ⎨ ⎧ = = = + + j Bi, j 1,3N], [2N j Gi, j 1,2N], [N j Ri, j N], [1, I I I I I I (1.4)
Then the unfolding of the recorded information along the color channels of the web camera enables to generate distinctive substance features that retain key spectral information (spectral fingerprints), which are able to disentangle predominant emission from absorption features (Figure 1.14).
Red
Green
Blue
Red
Green
Blue
Figure 1.14: Overlap of fingerprints of the same substance in different conditions, obtained by Eq. 1.4, concatenating intensity profiles.
Then the measured space contains both the spectral signature of the substances and that of the particular CSPT assembly where the measurement is performed. In order to highlight the substance signature, the measured space is subtracted by the measured space without substance (a sort of background compensation). The resulting profiles are henceforth referred to as the CSPT fingerprints of the substances. This is not the only method to extract spectral fingerprints from substances, but of course it is quite intuitive and very interesting for our studies.
Therefore the CSPT measurement of any substance transmittance or reflectance transforms this illuminating space into a measured space distinctive of the substance. Each tested
substance produces an intensity signature according to Eq. 1.4. In theory the linear combination of three spectral radiances and the three overlapping filters of the web camera produce up to nine different spectral windows of analysis specifically modulated by a given tested substance, which means that more than three colors per substance are redundant [16] (Figure 1.15). Thus, the problem of classifying sets of n transmittances consist of maximizing the differences between these modulated windows of analysis [17] (evaluated by their areas according to Eq.1.3).
Figure 1.15: Nine spectral windows formed by combinations of a LCD screen spectral radiances and the web camera filters for a sample transmittance T(λ)=1 λ [390 nm,700 nm]. The hatched areas highlight the overlaps of the camera
filters. Note the different amplitude of the windows.
By the way, it is interesting underline the two main methods used to extract information from CSPT measurements. In fact, as we will see in details in the next chapters, there is not a rule to find the best method how to do this, but this strongly depends by the kind of the assay we are measuring, by the sort of spectra which is detecting (reflectance or transmittance) and last but not least by the mode we are using the CSPT platform (e.g.
Spectroscopy mode or E-nose mode). Then it is really clear the way that these CSPT signals are composed has a main impact on the ability to distinguish the tested substances and consequently to evaluate the tests. So the CSPT fingerprints (a distinctive spectral signature of the substances) can be either difference or ratio fingerprints depending on how the spectral features of the used platform are compensated, as mentioned above.
Exploring convenient ways for feature extraction it is become clear that to compensate the spectral features of any particular platform in the fingerprints extraction we should involve two main possibilities. One alternative consists of disentangling the samples signatures from the platform features in order to evaluate a ‘universal’ substance fingerprint. More practical and robust, however, is to measure the samples together with calibrations (e.g. a set of possible assay outcomes) and comparing signatures obtained in a same instrument. To improve the attainable classifications the way of performing the experiments can be flexibly tuned when using CSPT platforms, for instance, adapting the illuminating sequence to a particular assay, customizing the camera settings or as in this case exploring particular processing strategies for different kinds of measurements. These strategies will be described in details in next chapters 3, 4, 5 where very different measurements were performed by CSPT.
1.4.1. RGB-Colour sequence optimization
We also investigated the optimization of illuminating sequences and the best possible performances of these optimum configurations for sets of substance transmittances systematically scanning the whole visible spectrum. The numerous possible combinations of substance sets and optimum configurations excluded the systematic experimental examination of the problem, which instead has been accomplished with the aid of a CSPT model. It is experimentally known that the performance of the CSPT evaluation, assessed as its ability to distinguish sets of colour substances, depends on the composition of the illuminating sequences and on the colours of the tested array of substances. As can be seen, by customizing the illumination is possible to maximize the ability of CSPT to distinguish substance transmittances that just differ from each other in a 10 nm shift.
Considering the CSPT fingerprints, other alternatives are feasible to enhance the substances classification, such as adapting the illuminating colors to maximize a particular target, nevertheless, for practical applications it is also important to minimize the illuminating sequence in order to keep the measurement time short.
In principle, the illuminating colors are just linear combinations of three screen spectral radiances, and only three colors should be enough to reconstruct any spectra in about 9 points (considering the unfolding in the three channels of the web camera), however, in practice the classification of sets of color samples depends on the choice of the illuminating colors, which are not necessarily the same for a different set of samples. The selection of an optimum illuminating sequence for several sets of color indicators is not trivial, and has been solved ad hoc, by means of longer sequences that despite the redundancy have better chances to compensate for the ignored optimum conditions. This approach can compensate several instrumental weaknesses, then the influence of the CSPT platform in the classification is minimized, making it more robust to random fluctuations in the instrument and allowing a simpler use. Even with a non-optimum illuminating sequence, in the this
thesis there will be showed an appropriate performance of the CSPT evaluation for the intended use.
1.4.2. Effect of fingerprints conformation
Introducing equation 1.2 in equation 1.3 and rearranging, we obtain:
( ) ( )
( ) ( )
( ) ( )
( ) ( )
( ) ( )
( ) ( )
( ) ( )
( ) ( )
( ) ( )
( ) ( )
( ) ( )
( ) ( )
( ) ( )
( ) ( )
( ) ( )
( ) ( )
( ) ( )
( ) ( )
⎪ ⎪ ⎪ ⎪ ⎪ ⎪ ⎪ ⎩ ⎪⎪ ⎪ ⎪ ⎪ ⎪ ⎪ ⎨ ⎧ ⋅ ⋅ ⋅ ⋅ + ⋅ ⋅ ⋅ ⋅ + ⋅ ⋅ ⋅ ⋅ = ⋅ ⋅ ⋅ ⋅ + ⋅ ⋅ ⋅ ⋅ + ⋅ ⋅ ⋅ ⋅ = ⋅ ⋅ ⋅ ⋅ + ⋅ ⋅ ⋅ ⋅ + ⋅ ⋅ ⋅ ⋅ =∫
∫
∫
∫
∫
∫
∫
∫
∫
λ λ λ λ λ λ λ λ λ λ λ λ λ λ λ λ λ λ λ λ λ λ λ λ λ λ λ λ λ λ λ λ λ λ λ λ λ λ λ λ λ λ λ λ λ λ λ λ λ λ λ λ λ λ d D F T B b d D F T G g d D F T R r I d D F T B b d D F T G g d D F T R r I d D F T B b d D F T G g d D F T R r I B j i i B j i i B j i i j Bi G j i i G j i i G j i i j Gi R j i i R j i i R j i i j Ri , , , (1.5) Or briefly: ⎟ ⎟ ⎟ ⎠ ⎞ ⎜ ⎜ ⎜ ⎝ ⎛ = ⎟ ⎟ ⎟ ⎠ ⎞ ⎜ ⎜ ⎜ ⎝ ⎛ ⎟ ⎟ ⎟ ⎠ ⎞ ⎜ ⎜ ⎜ ⎝ ⎛ = ⎟⎟ ⎟ ⎟ ⎠ ⎞ ⎜⎜ ⎜ ⎜ ⎝ ⎛ i i i i i i B G R B G R B G R j Bi j Gi j Ri b g r x S b g r x b b b g g g r r r I I I , , , (1.6)where the terms of the substance matrix S are functions of T(λ), and retain up to nine spectral windows of the substance transmittances, captured through these combinations of screen radiances and camera filters. The intensities measured in this way contain the spectral information that would allow spectral reconstruction, but also the spectral characteristics of the platform embedded in the signature. So far, two main approaches have been followed for highlighting the substance features: difference CSPT fingerprints and