POLITECNICO DI MILANO
Master of Science in Computer Systems Engineering Dipartimento di Elettronica e Informazione
A MODEL FOR ASSESSING THE
VALUE OF INFORMATION
INTEGRATION
Author: Marcio Fossa VICENTINI (749156) Supervisor: Prof. Chiara FRANCALANCI Supervisor: Ing. Cinzia CAPPIELLO Date: 15/11/2011
2
ABSTRACT
Issues with combining heterogeneous data sources under a single query interface have existed for quite some time. The rapid adoption of databases after the 1960s naturally led to the need to share and merge existing repositories. Among the innumerous areas of study related to information technologies, data integration is the area that focuses on combining data residing in different sources and providing users with a unified view of these data. The purpose of this thesis is to discuss a model that aims to unify several concepts diffusely investigated in the information systems literature, namely information quality, structure, diffusion, capacity, utility, and value. Through this model we intend to assess the value of information integration initiatives. In order to provide the reader with a more pragmatic approach to this topic, we intend to apply the concepts studied to a real-world practical scenario. The case study here presented is based on experiences carried out in the Mobile Services for Agro-food project that aims to develop value added services for the agro-food sector. It’s important to notice that the issues considered in this paper have practical relevance for business in strategic and operational dimensions.
Key words: Databases, data integration, information, Mobile Services for Agro-food, quality, capacity, cost, utility, value, model.
3
SOMMARIO
Problemi con la combinazione di fonti di dati eterogenee sotto un'interfaccia unica di esecuzione di query esistono da parecchio tempo. La rapida adozione di basi di dati dopo il 1960 naturalmente ha portato alla necessità di condividere e fondere diversi repositori esistenti. Tra le innumerevoli aree di studio legate alla tecnologia dell'informazione, l'integrazione dei dati è l'area che si concentra sulla combinazione di dati residenti in fonti diverse in modo ad offrire agli utenti una visione unificata dei dati. Lo scopo di questa tese è quello di discutere un modello che mira a unificare diversi concetti diffusamente studiati nella letteratura dei sistemi informativi, cioè la qualità, la struttura, la diffusione, la capacità, l'utilità e il valore dell'informazione. Attraverso questo modello vogliamo analizzare il valore di iniziative di integrazione dell'informazioni. Per offrire al lettore un approccio un può più pragmatico di questo tema, applicheremo i concetti studiati in un scenario pratico del mondo reale. Il caso di studio qui presentato si basa sul l'esperienze svolte presso il progetto Mobile Services for Agro-food che si propone di sviluppare servizi a valore aggiunto per il settore agro-alimentare. È importante notare che i temi considerati in questo documento hanno rilevanza pratica per le imprese in dimensioni strategiche e operative.
Parole chiavi: Basi di dati, integrazione di dati, informazioni, Mobile Services for Agro-food, qualità, capacità, costi, utilità, valore, modello.
4
ACKNOWLEGMENTS
To my parents, Marcio and Eliete, and my brother, Murilo, who always believed in my potential and always provided support for my accomplishments.
To my friends, too many to name here, but that in many ways supported me and shared with me two amazing years here in Italy.
To my supervisors, Prof. Francalanci and Ing. Cappiello, for all the teachings, patience, and time devoted to help me develop this project.
5
TABLE OF CONTENTS
ABSTRACT ... 2 SOMMARIO ... 3 ACKNOWLEGMENTS ... 4 TABLE OF CONTENTS ... 5 LIST OF FIGURES ... 7 LIST OF TABLES ... 8 LIST OF ABBREVIATIONS ... 9 1. INTRODUCTION ... 10 1.1. Thesis Overview ... 112. MOBILE SERVICES FOR AGRO-FOOD: GOALS AND MOTIVATIONS ... 13
2.1. Mobile Services for Agrofood ... 13
2.1.1. Ms4A potential benefits ... 14
2.1.2. Reference Scenarios ... 15
2.2. Motivation ... 16
2.3. Goals ... 17
3. STATE OF THE ART ... 18
3.1. Data Integration ... 18
3.1.1. Data Integration Benefits and Applications ... 19
3.1.2. Data Integration Issues ... 21
3.1.3. Data Integration Approaches ... 22
3.1.4. Local-as-View vs. Global-as-View ... 26
3.2. Further Definitions ... 27
3.2.1. Data vs. Information ... 27
3.2.2. Information Variables ... 28
4. METHODOLOGY: ASSESSING THE VALUE OF INFORMATION INTEGRATION ... 33
4.1. Project Roadmap ... 33
4.2. A model of information capacity and value of integration technologies ... 34
6
4.4. Schema Integration Methodology Example ... 40
4.5. Data Integration and Mose for Agrofood ... 43
5. EMPIRICAL VALIDATION: A CASE STUDY IN THE AGROFOOD DOMAIN ... 45
5.1. Global Schema Design ... 45
5.2. Model Analysis ... 53 5.3. Cost Estimation ... 55 6. DISCUSSION ... 58 7. CONCLUSION ... 59 8. RECOMENDATIONS ... 61 REFERENCES ... 62 APENDICES ... 64
7
LIST OF FIGURES
Figure 1 - Ms4A General Schema ... 14
Figure 2 - General Integration Approaches on Different Architectural Levels ... 22
Figure 3 - Simple schematic for a data warehouse... 25
Figure 4 - Simple schematic for a view-based data-integration solution ... 26
Figure 5 - The proposed unified model of information capacity and value ... 35
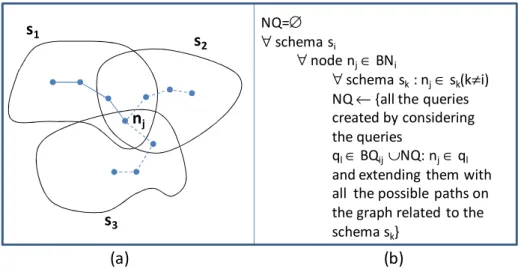
Figure 6 - Example and algorithm for the definition of the set of new queries NQ ... 37
Figure 7 - Original Schemas ... 41
Figure 8 - Renaming Key Words to Topics ... 41
Figure 9 - Make publisher into an entity from an attribute ... 41
Figure 10 - Superimpose the two schemas... 42
Figure 11 - Make Book a subset of Publication ... 42
Figure 12 - Remove Books common properties ... 42
Figure 13 – Source of information in the agrofood sector ... 47
Figure 14 - Agrofood products nutritional claims ... 48
Figure 15 - Agrofood products ingredients... 49
Figure 16 - Agrofood products and certificates ... 49
Figure 17 - Recipes and ratings ... 50
Figure 18 - Restaurants and ratings ... 50
Figure 19 - Source mapping representation ... 51
Figure 20 - Recipes / Dishes frontier tables ... 51
Figure 21 - Products frontier tables ... 52
Figure 22 - Product / ingredients frontier tables ... 53
Figure 23 - Three-year Total Cost of Ownership (TCO)... 56
Figure 24 - Average costs (3-year TCO) per project per end point (sources and targets) .... 57
Figure 25 - Average number of scenarios for which products/vendors are considered suitable ... 64
8
LIST OF TABLES
Table 1 - Data Integration Benefits ... 20
Table 2 - General Integration Approaches... 23
Table 3 - Integration Solutions Examples ... 24
Table 4 - Local-As-View vs. Global-As-View ... 27
Table 5 - Information Quality Dimensions ... 29
Table 6 - Supply Chain Phases vs. Information retrieved ... 46
Table 7 – Integration Project Initial Costs ... 56
Table 8 - Integration Project Annual ongoing Costs ... 56
9
LIST OF ABBREVIATIONS
Ms4A Mobile Services for Agro-food
DI Data Integration
EII Enterprise Information Integration
LAV Local as View
GAV Global as View
DBMS Database Management Systems ETL Extract, Transform, and Load OLTP On-Line Transaction Processing OLAP On-Line Analytical Processing
FDBMS Federated Database Management Systems WFMS Workflow Management Systems
P2P Peer-to-peer
CRM Customer Relationship Management IIC Intensional Information Capacity EIC Extensional Information Capacity SOA Service Oriented Architecture
10
1.
INTRODUCTION
With a compound annual growth rate of almost 60%, the digital universe is growing faster and is projected to be nearly 1.8 zettabytes (1.8 trillion gigabytes) in 2011. In this scenario, the picture related to the source and governance of digital information is nothing but intriguing: According to researches, approximately 70% of the digital universe is created by individuals, yet enterprises are responsible for the security, privacy, reliability, and compliance of 85% of the information (Gantz, 2008).
Among the innumerous reasons that help explain this overwhelming growth of information, it’s worth mentioning a few:
• Internet: Network of networks that consists of millions of private, public, academic, business, and government networks, of local to global scope, that are linked by a broad array of electronic, wireless and optical networking technologies.
• Web 2.0: Web applications that facilitate participatory information sharing, interoperability, user-centered design, and collaboration on the World Wide Web (O'Reilly, 2005).
• Business intelligence data: Organizations are increasingly interested in collecting social data and aggregating with third party information in order to support more targeted business decisions. In that sense, long-term retention of information is necessary in order to identify trends and predict future behavior.
Now, when we stop and think about the dimensions of this digital universe and all the possibilities that lie within, one cannot help but wonder: Are we making the best use of all the information that we have access to? How much more can we extract from this gigantic source of information? How do we tame chaos and extract the most value form it?
Among the many studies that have been conducted in the last few years, in order to answer these questions and provide reliable solutions to this issue, literature shows that the data integration theory has proved to be a very effective approach in the quest to extract more value from the information at our disposal.
In order to be useful to the users, information must be treated, as so to guarantee its quality, and also needs to be brought together (connected) in order to increase its relevance and accessibility. In a corporate environment, data integration initiatives boil down to money. While building standalone applications may be the "quick" solution to an immediate business problem, maintaining the resulting redundant and inconsistent databases and applications is a huge cost to organizations (Moss & Adelman, 2000).
11 According to (Moody & Walsh, 1999) there are seven laws of information: 1) information is infinitely sharable; 2) the value of information increases with use; 3) information is perishable; 4) the value of information increases with accuracy; 5) the value of information increases when combined with other information (integration); 6) more information is not necessarily better information (pertinence); 7) information is not depletable.
In this thesis, as well as gaining a better understanding on how data integration works, we also want to understand what are its impacts to information. In the following pages we will present innumerous concepts on data integration and information variables. In the end of this study, we expect to apply the knowledge acquired to a real-world case scenario in order to analyze in a more pragmatic way how to evaluate the value of information integration.
1.1.
Thesis Overview
In order to gain a more global understanding of how this study will be structured, the following paragraphs intend to summarize the concepts and procedures that will be covered/adopted in the following chapters of this work. The remainder sections of this thesis are organized as follows:
Chapter 2 – Goals and Motivations: As to guide our efforts in the development of this thesis, this chapter presents the main motivations and goals of this study. Also, for future reference, we will also specify the study case scenario in which we will apply the concepts later viewed in this work.
Chapter 3 – State of the art: This chapter covers a variety of topics that are relevant to the project in question. Background information acquired through literature review in the field of data integration will be presented here. By the end of this chapter we hope the reader will have a better understanding of what is data integration, what are its issues, what are its benefits and finally, which are the most common approaches for data integration nowadays. The final section of this chapter presents a miscellaneous of topics that are necessary for building a basic vocabulary that will most probably be requested in following chapters of this thesis.
Chapter 4 - Methodology: This chapter deals with the execution basis of the project. It covers the methods that will be used to implement the project, more specifically, the first section of this chapter describes the roadmap of this project; the second and third sections present a unified quality based model for information value and capacity analysis; the fourth section presents a didactical example of schema integration methodology; and finally, in order to bridge everything exposed so far, a section on the connections between the theory developed and the Ms4A project.
12 Chapter 5 – Empirical Validation: This chapter walks the reader through the application of the model in the Ms4A context, as well as it analyzes all the relevant parameters proposed in the model, namely, value, capacity, quality and cost of information.
Chapter 6 – Discussion: This chapter proposes a discussion of the results presented on the previous chapter, not only by simply re-stating the reported results but by critically trying to extract what are the implications of the results obtained and what were the main issues in the project execution.
Chapter 7 – Conclusion: This chapter concludes the work done in this project, by synthesizing the most remarkable findings and by specifically answering to the project’s established goals.
Chapter 8 – Recommendations: Finally, the last chapter proposes a look into the future and suggests directions for further researches as to fill in the gaps in our understanding of the still innumerous issues related to data integration.
13
2.
MOBILE SERVICES FOR AGRO-FOOD: GOALS AND
MOTIVATIONS
2.1.
Mobile Services for Agrofood
In the last years there has been an increased interest in issues related to health and diet, both by consumers, and scientific community. The problems related to intolerance, allergies or diseases such as overweight and obesity are rapidly increasing. Consumers are increasingly careful about what they eat, and on the other hand food companies must offer products that are in line with new market demands in order to be able to satisfy their customers (OECD, 2004).
For these reasons, the consumers’ interest towards food knowledge is growing, and in this context an important role is played by food labels. The role of labeling is to help consumers making the optimum choice during their purchasing activities and thus reducing information asymmetry (Levy & Fein, 1998).
Although labeling is regulated and is an important tool for consumers, the available space on the packaging is limited and some information cannot be reported even if they are important to consumers. Information overloading represents a potential source of danger to costumers, as it can deter them from making optimal decision.
In response to all the issues mentioned above, the Mobile Services for Agro-food (Ms4A) project was created to propose a state of the art solution to all these problems. The primary goal of this project is to facilitate consumers’ access to immediate, complete and constantly updated information on the most various aspects of a product of interest. Through the use of a smart label technology, the basic idea is that more information could be stored in the product’s package without incurring into information overloading problems.
Without going too deep into the technicalities of the smart labels, the relevant thing to say is that through this mature and well standardized technology, producers can now provide their customers with a far greater amount of information that is no longer limited to the size of the product’s package. All this information can be easily accessed by any personal smartphone or any similar device with camera or RFID functionality.
14 Figure 1 - Ms4A General Schema
Many studies have shown that costumer’s individual profiles, like instruction, nutritional knowledge, income, and also age and gender can affect purchasing behavior (Nayga, 1996). In other words, this means that different costumer profiles value different kinds of information and therefore behave differently when purchasing.
The idea of increasing the available information without having overload issues can only be achieved if not all the information available is shown to the consumer. In order to provide only the relevant information for each costumer we need to have access this person’s personal profile i.e. information such as, sex, occupation, age, income, instruction level, body mass index (BMI), intolerances, special diets, alimentary restrictions, etc. Only through the analysis of this information we are able to categorize the costumer and provide the appropriate information to each and every person. For more information on this topic refer to (Bantere & Cavaliere, 2011).
2.1.1.
Ms4A potential benefits
The main innovation point in this project regards the customized information provided to the users based on their profiles. Nowadays, when we refer to a certain product label we see no differentiation on the information displayed. Most times, we have to go through a whole bunch of seamlessly useless information in order to find exactly what we are looking for. It’s important to realize that through this customized approach, we no longer need to attain ourselves to the limited information set currently displayed in products packages. Through the use of ICT technologies (Smart Labels) it’s possible to store new kinds of information that might also be useful to consumers and are not currently available.
By providing a client/producer oriented service, the Ms4A project tackles many issues that concern both entities. For instance, the value to final users can be justified as follows:
- Time saving: Information is easier to access and reflects the consumers’ personal needs.
15 - Money saving: Additional information helps consumers to make more conscious
acquisitions, avoiding purchases that don’t fit the consumers’ needs.
- Saves on alternative technologies: e.g. phone calls, consulting, website searches, etc. In the other hand, for producers, the value can be justified as follows:
- Product differentiation by making available a series of more rich and interesting information from a commercial perspective.
- Increases quality and visibility of its production processes through integration of traceability system within the company.
- Reconstructs the geographical distribution of its products consumption and on this basis creates knowledge for targeted marketing.
- Dissemination of added-value services.
Once we have demonstrated the relevance of this project for consumers and producers, nothing makes more sense than to extend our efforts towards trying to better understand the feasibility aspects of this project and its potential economic value.
2.1.2.
Reference Scenarios
In a focus group study conducted by the Dipartimento di Economia e Politica Agraria, Agroalimentare e Ambientale (DEPAAA), some really interesting analysis were made regarding the general population impressions on labeled information in the Ms4A context (Bantere & Cavaliere, 2011).
In the first step of the interview, based on a list of information not currently available on the labels, the consumers were asked to express their level of interest on each item of this list. Subsequently, was examined what were the motivations for the expressed interest by consumers. In this scenario, consumers responded the most to the following information:
1) Animal welfare (81%) - perceived as the result of a product with a higher quality. 2) Breeding (72%) - perceived as the result of a product with a higher quality.
3) Packaging (71%) – because of concerns related to the environmental impact caused by packaging materials.
4) Food Miles (67%) – perceived as important for products such as milk, water, eggs, fruit, and vegetables that deteriorate rapidly.
In the second step of the interview, based on a list of information that is generally available on the labels. Consumers were asked to express their level of interest on each item of this list. In this scenario, consumers responded the most to the following information:
1) Origin of the product (86%)
16 3) Energy (70%) 4) Fat content (69%) 5) Organic agriculture (69%) 6) Absence of pesticides (67%) 7) Sugar content (67%)
The aim of the third step of the focus group was to investigate the interest of consumers in using the so called “smart label”. The main responses in this scenario were:
- Because of the easiness and the convenience of using smart labels, 81% of respondents affirm they would spend more time in getting information.
- Only 39% of respondents agree for a higher price in products for the smart label, while the remaining 61% wouldn’t like to pay any surplus.
- 72% of consumers agree to give private information in order to receive more personalized information. Only 28% of participants would not agree to give any private information.
By analyzing these reference scenarios, we can get a clearer understanding of what society’s needs are and what is the acceptance of this new solution among the general population.
2.2.
Motivation
As mentioned in the previous section, the population increased interest in food knowledge, raises the question of the role played by food labels in fulfilling this new need. In this new context, issues such as space restriction, personalized information, lacking of information or data overload need to be addressed.
The IT field is evolving and developing every day. Enabling technologies such as mobile devices, internet, computers, databases, etc. are shaping the way that people communicates with one another, gets work done, and spends free time. In this constantly mutating environment, the choices we make need to be constantly rethought in order to adapt to the always changing population needs.
New technologies such as smart labels, which have been successfully implemented in warehousing applications, are now a new option for revolutionizing the way we label our products and the way we access this information. It’s important to understand that with this change of labeling paradigm, new issues arise regarding the new background integrated infrastructure that has to be built in order to support the new labeling features proposed. More information on this issue will be discussed in the next session.
17
2.3.
Goals
What we have today, in many different areas, is a great quantity of relevant information divided and physically distributed throughout the web or as part of the business supply chain infrastructure. The idea of the Ms4A project is to identify and unify these heterogeneous sources of information in the agrofood business and by applying specific integration methodologies, optimize/maximize the information usage.
Despite the evidences that the Ms4A project represents a labeling solution of real value to customers and producers, just like any other IT project, before we implement any solution, the proposed scenarios of applications must be modeled/designed and evaluated through a qualitative/quantitative economic model in order to formally evaluate the convenience of this project.
This thesis goal can be divided in three parts:
1) Design/modeling of a data integration solution based on the Ms4A reference scenario presented in this chapter. The theoretical overview on how to accomplish this first step will be covered in chapters 3 and 4.
2) Application of the economic model to the integrated database solution in order to evaluate if there is indeed an actual increase in the information value, utility and quality. The theoretical overview of the economic model will be covered in chapter 4. 3) Cost variables examination in order to enable a cost/benefit analysis of the proposed
data integration solution. For this part, the best approach would probably be a benchmark analysis of costs, based on previous data integration projects.
By the time all these steps are successfully accomplished, we’ll hopefully have collected enough information in order to deliver a reasonable conclusion on the feasibility of the Mobile Services for Agrofood project.
18
3.
STATE OF THE ART
3.1.
Data Integration
Ever since the early 1960s the use of databases has become ever more prevalent in our modern societies. The storage of data has become a big part of our ability to use and manipulate information in order to generate knowledge. The increased use of databases and the development of collaboration between organizations have naturally led to the need for these organizations to make the data they own available to each other and also to their clients. In this way they are able to generate knowledge and in general make the information at their disposal more valuable and useful.
Data integration involves combining data residing in different sources and providing users with a unified view of these data (Lenzerini, 2002). This process becomes significant in a variety of situations, which include both commercial and scientific domains. In business circles, data integration is frequently referred as "Enterprise Information Integration" (EII).
Enterprise Information Integration, is a process of information integration, using data abstraction to provide a unified interface (known as uniform data access) for viewing all the data within an organization, and a single set of structures and naming conventions (known as uniform information representation) to represent this data; the goal of EII is to get a large set of heterogeneous data sources to appear to a user or system as a single, homogeneous data source (Halevy, 2005).
The issue of data integration generally arises when the component systems already exist, that is to say, integration is generally a bottom-up process. This topic has become ever more important in the modern day business environment as large corporations realize the importance of the data which is in their possession and in their information systems. Information that can be drawn from this data can give businesses a competitive advantage and help them survive highly competitive environments.
Another application of data integration is the combining of data sources that exist throughout the World Wide Web. The fact that web data sources are autonomous and heterogeneous makes the problem of web integration particularly tricky. Web integration can lead to the production of much more reliable search engines.
19
3.1.1.
Data Integration Benefits and Applications
There is a manifold of applications that benefit from integrated information. For instance, in the area of business intelligence (BI), integrated information can be used for querying and reporting on business activities, for statistical analysis, online analytical processing (OLAP), and data mining in order to enable forecasting, decision making, enterprise-wide planning, and, in the end, to gain sustainable competitive advantages. For customer relationship management (CRM), integrated information on individual customers, business environment trends, and current sales can be used to improve customer services. Enterprise information portals (EIP) present integrated company information as personalized web sites and represent single information access points primarily for employees, but also for customers, business partners, and the public. Last, but not least, in the area of e-commerce and e-business, integrated information enables and facilitates business transactions and services over computer networks.
With typical investment in data integration tools falling in the range of $200,000 to $500,000 for software licensing and $50,000 to $100,000 for annual maintenance (Gartner, 2008), it’s no surprise that so much investments is made either in the public or private sectors to foment researches in this field.
Now, if you are wondering why costs revolving data integration tools and maintenance are so high, the answer not surprisingly is the obvious one, implementing data integration is certainly not as easy as it sound. But let’s not get ahead of ourselves! The issues regarding data integration will be covered in the next session, for now, let’s focus on the reasons why organizations spend so much money in this solution.
As mentioned before, although not always simple, through data aggregation many positive things can be accomplished. Table 1 summarizes the main improvement points that can be achieved through data integration initiatives (Adelman & Moss, 2003).
20 Table 1 - Data Integration Benefits
Benefits Comment
Availability / Accessibility
Asset data that is easily retrieved, viewed, queried, and analyzed by anyone within an agency.
Timeliness Well-organized data can be quickly updated; one input will often apply the data across a variety of linked systems, and the information can be time-stamped to reflect its currency.
Accuracy and Integrity
Errors are greatly reduced because the integration environment drives a higher quality of input and can include automatic or convenient error checking and verification.
Consistency and Clarity
Integration requires clear and unique definition of various types of data, avoiding confusion or conflict in the meaning of terms and usage. Completeness All available information, including both historical and recent data, is
accessible in an integrated database, with any missing records or fields identified and flagged via the integration process.
Reduced Duplication
Identical data is eliminated reducing the need for multiple updates and ensuring everyone is working from the exact same information.
Faster Processing and Turnaround Time
Less time is spent on consolidating and transmitting data to various users in the agency. The integrated data environment saves time by eliminating consolidation and transmittal to disparate users and allows many users to conduct separate analyses concurrently.
Lower Data Acquisition and Storage Cost
Data are collected or processed only once, and the information is consolidated and stored at locations supporting optimal convenience and ease of maintenance.
Informed and Defensible Decisions
Highly organized, comprehensive databases allow users to drill down through successive levels of detail for an asset, supplying more information to support decisions and supporting different types of analysis using various data combinations.
Enhanced Program Development
Comprehensive and coordinated system information advances program development by providing timely data for high-priority actions, promoting efficient distribution of funding among competing programs, and improving consistency in programs from year to year and across departments, among other benefits.
Greater Accountability
Data integration allows rapid and more accurate reporting of costs and accomplishments, including full attribution of results to relevant agency units and functions.
Lower Costs Reducing the programs and the programmers that support the redundant systems. Despite the usually high cost of implementation, overall system maintenance costs drop considerably.
The integration of related data sources means that users are querying and manipulating a larger data set and for this reason they are able to retrieve more absolute and complete results thus favoring integrated decision making. Finally, the last aspect that needs to be taken in consideration is the system security issues. Studies have shown that data integration initiatives aid system security by focusing protection efforts in one centralized access point that can be more thoroughly and easily monitored.
21
3.1.2.
Data Integration Issues
To achieve this holistic view, all data has to be represented using the same abstraction principles (unified global data model and unified semantics). This task includes detection and resolution of schema and data conflicts regarding structure and semantics.
First order of work is to resolve any inconsistencies between the schemas of the physical data sources. The structure and semantics of the individual schemas must be analyzed in order to identify naming inconsistencies, implicit attributes, absent attributes and other differences so that these may be rectified and a new data model developed. In general, however, there is no quick fix solution to integrating several data sources and to a large extent the approach taken, in each case, is governed by the individual characteristics of the information systems being integrated (Tsierkezos, 2010).
In general, information systems are not designed for integration. Thus, whenever integrated access to different source systems is desired, the sources and their data that do not fit together have to be coalesced by additional adaptation and reconciliation functionality.
While the goal is always to provide a homogeneous, unified view on data from different sources, the particular integration task may depend on (Dittrich & Jonscher, 1999)
• the architectural view of an information system,
• the content and functionality of the component systems,
• the kind of information that is managed by component systems (alphanumeric data, multimedia data; structured, semi-structured, unstructured data),
• requirements concerning autonomy of component systems,
• intended use of the integrated information system (read-only or write access),
• performance requirements, and
• the available resources (time, money, human resources, know-how, etc.)
Additionally, several kinds of heterogeneity typically have to be considered. This include differences in
• hardware and operating systems,
• data management software,
• data models, schemas, and data semantics,
• middleware,
• user interfaces, and
• business rules and integrity constraints.
As of 2010 some of the work in data integration research concerns the semantic integration problem. This problem addresses not the architectural structuring of the integrated solution, but how to resolve semantic conflicts between heterogeneous data sources. For example if two companies merge their databases, certain concepts and definitions in their respective schemas like "earnings" inevitably have different meanings. In one database it may
22 mean profits in dollars (a floating-point number), while in the other it might represent the number of sales (an integer). A common strategy for the resolution of such problems involves the use of ontologies which explicitly define schema terms and thus help to resolve semantic conflicts.
Finally, it’s important to point out that most of the issues mentioned above are often times consequences of the fact that system developers rarely build application to be data-integration-friendly. Modern times require a mentality change in the IT industry. Application fragmentation begets data fragmentation. More often than not, applications are deployed as patches or quick fixes and in this practice developers rarely have the discernment of thinking through the consequences of their choices to the system as a whole in the future.
3.1.3.
Data Integration Approaches
Information systems can be described using a layered architecture, as shown in Figure 2: On the topmost layer, users access data and services through various interfaces that run on top of different applications. Applications may use middleware — transaction processing (TP) monitors, message-oriented middleware (MOM), SQL-middleware, etc. — to access data via a data access layer. The data itself is managed by a data storage system. Usually, database management systems (DBMS) are used to combine the data access and storage layer.
23 Seen through an architectural perspective, literature shows that there are several different ways to address the integration problem. The classification presented on Table 2 is based on (Dittrich & Jonscher, 1999) and distinguishes integration approaches according to the level of abstraction where integration is performed.
Table 2 - General Integration Approaches
Approach Description
Manual Integration
Here, users directly interact with all relevant information systems and manually integrate selected data. That is, users have to deal with different user interfaces and query languages. Additionally, users need to have detailed knowledge on location, logical data representation, and data semantics.
Common User Interface
In this case, the user is supplied with a common user interface (e.g., a web browser) that provides a uniform look and feel. Data from relevant information systems is still separately presented so that homogenization and integration of data yet has to be done by the users (for instance, as in search engines).
Integration by Applications
This approach uses integration applications that access various data sources and return integrated results to the user. This solution is practical for a small number of component systems. However, applications become increasingly fat as the number of system interfaces and data formats to homogenize and integrate grows.
Integration by Middleware
Middleware provides reusable functionality that is generally used to solve dedicated aspects of the integration problem, e.g., as done by SQL-middleware. While applications are relieved from implementing common integration functionality, integration efforts are still needed in applications. Additionally, different middleware tools usually have to be combined to build integrated systems.
Uniform Data Access
In this case, a logical integration of data is accomplished at the data access level. Global applications are provided with a unified global view of physically distributed data, though only virtual data is available on this level. However, global provision of physically integrated data can be time-consuming since data access, homogenization, and integration have to be done at runtime.
Common Data Storage
Here, physical data integration is performed by transferring data to a new data storage; local sources can either be retired or remain operational. In general, physical data integration provides fast data access. However, if local data sources are retired, applications that access them have to be migrated to the new data storage as well. In case local data sources remain operational, periodical refreshing of the common data storage needs to be considered.
24 In practice, concrete integration solutions are realized based on the six general integration approaches presented. Table 3 lists and concisely comments some of most popular integration solutions out there (Ziegler & Dittrich, 2005).
Table 3 - Integration Solutions Examples
Solution Description
Mediated Query Systems
Represent a uniform data access solution by providing a single point for read-only querying access to various data sources. A mediator that contains a global query processor is employed to send subqueries to local data sources; returned local query results are then combined (Wiederhold, 1992).
Portals As another form of uniform data access, portals are personalized doorways to the internet or intranet where each user is provided with information tailored to his information needs. Usually, web mining is applied to determine user-profiles by click-stream analysis; that way, information the user might be interested in can be retrieved and presented.
Data Warehouses Realize a common data storage approach to integration. Data from several operational sources (on-line transaction processing systems, OLTP) are extracted, transformed, and loaded (ETL) into a data warehouse. Then, analysis, such as online analytical processing (OLAP), can be performed on cubes of integrated and aggregated data.
Operational Data Stores
Second example of common data storage. Here, a “warehouse with fresh data” is built by immediately propagating updates in local data sources to the data store. Thus, up-to-date integrated data is available for decision support. Unlike in data warehouses, data is neither cleansed nor aggregated nor are data histories supported.
Federated
Database Systems (FDBMS)
Achieve a uniform data access solution by logically integrating data from underlying local DBMS. Federated database systems are fully-fledged DBMS; that is, they implement their own data model, support global queries, global transactions, and global access control.
Workflow Management Systems (WFMS)
Allow to implement business processes where each single step is executed by a different application or user. Generally, WFMS support modeling, execution, and maintenance of processes that are comprised of interactions between applications and human users. WFMS represent an integration-by-application approach.
Integration by Web Services
Performs integration through software components (i.e., web services) that support machine-to-machine interaction over a network by XML-based messages that are conveyed by internet protocols. Depending on their offered integration functionality, web services either represent a uniform data access approach or a common data access interface for later manual or application-based integration.
Peer-to-peer (P2P) Decentralized approach to integration between distributed, autonomous peers where data can be mutually shared and integrated. P2P integration constitutes, depending on the provided integration functionality, either a uniform data access approach or a data access interface for subsequent manual or application-based integration.
Among the many solutions presented above, the most popular and studied ones are probably Data Warehouses and Mediated Query Systems. For a
two approaches, let’s dig a little deeper and analyze more thoroughly what differentiate th two options.
The warehouse system extracts, transforms, and loads data from heterogeneous sources into a single common queriable s
Figure 3). This approach offers a tightly coupled architecture because the data is already physically reconciled in a single repository at query
resolve queries. However, problems arise with the "freshness" of data, which means information in warehouse is not always up
gets updated, the warehouse still retains outdated data and the ETL proc execution for synchronization.
Figure
As of recent years the trend in data integration between data and providing a unified query
schema (see Figure 4), which makes
original databases. This approach may need to specify mappings between the mediated schema and the schema of original sources, and transform a query into specialized queries to match the schema of the original databases. Therefore, this middleware architecture i termed as "view-based query
over the (nonexistent) mediated schema. 2000).
Irrespectively of the method used
schema and the sources, one basic service provided by the data integration system is to answer queries posed in terms of the global schema. Given the architecture of the system, query processing in data integration requires a reformulation step: the query over the global schema has to be reformulated in terms of a set of queries over the sources
Among the many solutions presented above, the most popular and studied ones are probably Data Warehouses and Mediated Query Systems. For a better understanding of these two approaches, let’s dig a little deeper and analyze more thoroughly what differentiate th
The warehouse system extracts, transforms, and loads data from heterogeneous sources into a single common queriable schema so data becomes compatible with each other
. This approach offers a tightly coupled architecture because the data is already physically reconciled in a single repository at query-time, so it usually takes littl
resolve queries. However, problems arise with the "freshness" of data, which means information in warehouse is not always up-to-date. Therefore, when an original data source gets updated, the warehouse still retains outdated data and the ETL proc
execution for synchronization. For further information refer to (Kimball & Ross, 2002)
Figure 3 - Simple schematic for a data warehouse
the trend in data integration has favored loosening the coupling and providing a unified query-interface to access real time data over a mediated
), which makes possible that information be retrieved directly from al databases. This approach may need to specify mappings between the mediated schema and the schema of original sources, and transform a query into specialized queries to match the schema of the original databases. Therefore, this middleware architecture i
based query-answering" because each data source is represented as a view over the (nonexistent) mediated schema. For more information refer to (Domenig & Dittrich,
Irrespectively of the method used for the specification of the mapping between the global schema and the sources, one basic service provided by the data integration system is to answer queries posed in terms of the global schema. Given the architecture of the system, ata integration requires a reformulation step: the query over the global schema has to be reformulated in terms of a set of queries over the sources (Lenzerini, 2002)
25 Among the many solutions presented above, the most popular and studied ones are better understanding of these two approaches, let’s dig a little deeper and analyze more thoroughly what differentiate these
The warehouse system extracts, transforms, and loads data from heterogeneous sources chema so data becomes compatible with each other (see . This approach offers a tightly coupled architecture because the data is already time, so it usually takes little time to resolve queries. However, problems arise with the "freshness" of data, which means date. Therefore, when an original data source gets updated, the warehouse still retains outdated data and the ETL process needs
re-(Kimball & Ross, 2002).
has favored loosening the coupling interface to access real time data over a mediated information be retrieved directly from their al databases. This approach may need to specify mappings between the mediated schema and the schema of original sources, and transform a query into specialized queries to match the schema of the original databases. Therefore, this middleware architecture is also answering" because each data source is represented as a view (Domenig & Dittrich,
for the specification of the mapping between the global schema and the sources, one basic service provided by the data integration system is to answer queries posed in terms of the global schema. Given the architecture of the system, ata integration requires a reformulation step: the query over the global (Lenzerini, 2002).
Figure 4 - Simple schematic for
The data integration systems we are interested in this work are characterized by an architecture based on a global schema and a set of sources. The sources contain the real data, while the global schema provides a r
sources. Modeling the relation between the sources and the global schema is therefore a crucial aspect. Two basic approaches have been proposed
called global-as-view (GAV), requires that the global schema is expressed in terms of the data sources. The second approach, called local
specified independently from the sources, and the relationships between the global sch and the sources are established by defining every source a
it will surely come in handy, let’s take a brief look at the differences between the LAV and GAV approaches, as well as their pros and cons
3.1.4.
Local-as
Generally speaking, it is well known that processing queries in the LAV approach is a difficult task. Indeed, in this approach the only knowledge we have about the data in the global schema is through the views representing the sources,
information about the data. Since the mapping associates to each source a view over the global schema, it is not immediate to infer how to use the sources in order to answer queries expressed over the global schema. On
GAV approach, where we can take advantage that the mapping directly specifies which source queries corresponds to the elements of the global schema. Indeed, in most GAV systems, query answering is based on a simple unfolding strategy.
Simple schematic for a view-based data-integration solution
The data integration systems we are interested in this work are characterized by an architecture based on a global schema and a set of sources. The sources contain the real data, while the global schema provides a reconciled, integrated, and virtual view of the underlying sources. Modeling the relation between the sources and the global schema is therefore a crucial aspect. Two basic approaches have been proposed for this purpose. The first approach, , requires that the global schema is expressed in terms of the data sources. The second approach, called local-as-view (LAV), requires the global schema to be specified independently from the sources, and the relationships between the global sch and the sources are established by defining every source as a view over the global schema it will surely come in handy, let’s take a brief look at the differences between the LAV and GAV
, as well as their pros and cons.
as-View vs. Global-as-View
Generally speaking, it is well known that processing queries in the LAV approach is a difficult task. Indeed, in this approach the only knowledge we have about the data in the global schema is through the views representing the sources, and such views provide only partial information about the data. Since the mapping associates to each source a view over the global schema, it is not immediate to infer how to use the sources in order to answer queries expressed over the global schema. On the other hand, query processing looks easier in the GAV approach, where we can take advantage that the mapping directly specifies which source queries corresponds to the elements of the global schema. Indeed, in most GAV systems,
on a simple unfolding strategy.
26 ration solution
The data integration systems we are interested in this work are characterized by an architecture based on a global schema and a set of sources. The sources contain the real data, econciled, integrated, and virtual view of the underlying sources. Modeling the relation between the sources and the global schema is therefore a this purpose. The first approach, , requires that the global schema is expressed in terms of the data , requires the global schema to be specified independently from the sources, and the relationships between the global schema s a view over the global schema. As it will surely come in handy, let’s take a brief look at the differences between the LAV and GAV
Generally speaking, it is well known that processing queries in the LAV approach is a difficult task. Indeed, in this approach the only knowledge we have about the data in the global and such views provide only partial information about the data. Since the mapping associates to each source a view over the global schema, it is not immediate to infer how to use the sources in order to answer queries the other hand, query processing looks easier in the GAV approach, where we can take advantage that the mapping directly specifies which source queries corresponds to the elements of the global schema. Indeed, in most GAV systems,
27 From the point of view of modeling the data integration system, the GAV approach provides a specification mechanism that has a more procedural flavor with respect to the LAV approach. Indeed, while in LAV the designer may concentrate on declaratively specifying the content of the source in terms of the global schema, in GAV, one is forced to specify how to get the data of the global schema by means of queries over the sources, thus making LAV a more reasonable choice for systems in which data sources constantly change.
In more reachable words, Table 4 summarizes the main differences between these two approaches.
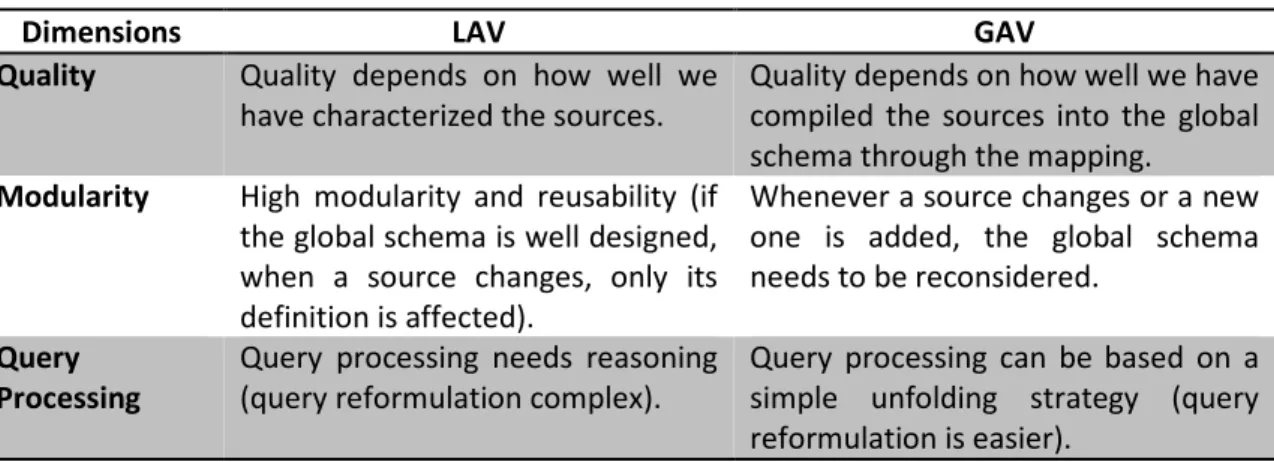
Table 4 - Local-As-View vs. Global-As-View
Dimensions LAV GAV
Quality Quality depends on how well we have characterized the sources.
Quality depends on how well we have compiled the sources into the global schema through the mapping.
Modularity High modularity and reusability (if the global schema is well designed, when a source changes, only its definition is affected).
Whenever a source changes or a new one is added, the global schema needs to be reconsidered.
Query Processing
Query processing needs reasoning (query reformulation complex).
Query processing can be based on a simple unfolding strategy (query reformulation is easier).
3.2.
Further Definitions
Without going too deep in each of the topics below, our intent in this section is to establish a basic vocabulary (based on literature) that might assist us during the explanation of this research. Also, especially in the model analysis, the concepts treated here will come in handy for a better understanding of the variables involved in data integration.
3.2.1.
Data vs. Information
People often miss the subtle difference between data and information and use these two words interchangeably. In an informal environment not being able to differentiate these two concepts might not be frown upon, but when it come to information systems it’s imperative to comprehend both definitions.
28 Data are plain facts. When data are processed, organized, structured or presented in a given context so as to make them useful, they are called Information. It is not enough to have data (such as statistics on the economy). Data in themselves are fairly useless. But when these data are interpreted and processed to determine its true meaning, they become useful and can be called Information (Bellinger, Castro, & Mills, 2004).
According to Russell Ackoff, a systems theorist and professor of organizational change, data, information and knowledge can be differentiated as shown below (Ackoff, 1989).
• Data: Often viewed as the lowest level of abstraction from which information and then knowledge are derived. Raw data, i.e. unprocessed data, refers to a collection of numbers, characters, images or other outputs from devices that collect information to convert physical quantities into symbols (Data on its own carries no meaning).
• Information: data that are processed to be useful, but does not have to be; provides answers to "who", "what", "where", and "when" questions. Information is data that has been given meaning by way of relational connection. In computer parlance, a relational database makes information from the data stored within it.
• Knowledge: application of data and information; answers "how" questions. Knowledge is the appropriate collection of information, such that its intent is to be useful.
When it comes to data integration, our final product is information. Information itself can be evaluated in many different levels namely quality, value, utility, capacity, cost, etc. As to interpret how information changes through data integration, it’s important to have at least a basic understanding of all these variables. The next sections attempt to concisely define these concepts.
3.2.2.
Information Variables
Information Quality
Information quality is a term to describe the quality of the content of information systems. It is often pragmatically defined as: "The fitness for use of the information provided."
Information quality is one of the measures of the value that information provides to the user. "Quality" is often perceived as subjective and the quality of information can then vary among users and among uses of the information. In an attempt to deal with this subjectivity, qualified professionals primarily representing the researchers' guild, have at one point or another identified particular metrics for information quality. They could also be described as 'quality traits' of information, since they're not so easily quantified, but rather subjectively identified on an individual basis (Wang & Strong, 1996). Table 5 lists the main information quality dimensions considered nowadays.
29 Table 5 - Information Quality Dimensions
Dimensions Comments
Accuracy Is the degree to which data correctly reflects the real world object or an event being described.
Accessibility Accessible information is information that can be obtained when needed.
Completeness Is the extent to which the expected attributes of data are provided. It is possible that data is not available, but it is still considered completed, as it meets the expectations of the user.
Consistency Means that data across the enterprise should be in synch with each other (absence of any violation to business rules in a database.
Reliability Refers to the accuracy and completeness of computer-processed data, given the intended purposes for use.
Timeliness Timeliness refers to the currency of the information presented to the users. Currency of data or information is the time gap between the occurrences of an event until its presentation to the user.
Information Value
Information value can be defined as the amount a decision maker would be willing to pay for information prior to making a decision. The key component for information value analysis is to understand the relevance of the information provided to the user. In other words, does the information address its user’s needs? If not, that user will find the information inadequate regardless of how well the information rates along other dimensions such as accuracy, accessibility, completeness, consistency, etc.
Even though information quality does not guaranty great information value, it’s known for a fact that information value decreases if data contains errors, inconsistencies or out-of-date values. Therefore, high information quality levels can be considered as an initial parameter for the potential usefulness of the information objects but cannot assure it.
The correlation between information value and accuracy has been analyzed in (Moody & Walsh, 1999): the higher the accuracy of information, the higher its usefulness and value. Low accuracy levels can be very costly since they can cause both operational errors and incorrect decision-making. (Moody & Walsh, 1999) also point out that information value also depends on the age of the information.
Information is often very dynamic and its validity decreases over time. With the advent of the web, new quality dimensions have been investigated for characterizing the quality of an information source, e.g. believability, which considers whether a certain source provides data that can be regarded as true, real and credible, and reputation or trustworthiness that considers how trustable the information source is.
30 Information has become an element of commerce. In earlier times, success was based on such criteria as control of finance, physical resources, writing, food, fire or shelter. Today, successful people and businesses are those who control information: its development, access, analysis and presentation. We refer to our era as the "Information Age." We buy and sell information, sometimes with money and sometimes by trading it for other information. Information, as an element of commerce, is a commodity, yet there are no convergent, universally accepted accounting or economic theories of information (Fenner, 2002).
Information passes through many stages before it has value to anyone. It exists first in a latent state, waiting for the right paradigm or perspective, long before anyone recognizes it to be information. Then we realize that raw, unorganized data may be of some use. We collect it, organize it, analyze it and draw conclusions from it. Both the information and our conclusions can be communicated. Only when information has been comprehended, can we value it and respond to it (Howard R. , 1966).
A determination of the actual value of information can be made only at this final stage. Data has no value in itself; its value is derived from its understanding and subsequent application. Before this last stage we can do no more than estimate the value we expect it to have. Society values only the product, or result, of information.
Due to this subjectivity in determining information value, more often than not, information providers and information seekers struggle to get into an agreement on what the information is actually worth.
Information Utility
Underlying the laws of demand and supply is the concept of utility, which represents the advantage or fulfillment a person receives from consuming a good or service. Utility is an abstract concept rather than a concrete, observable quantity. The units to which we assign an “amount” of utility, therefore, are arbitrary, representing a relative value. Total utility is the aggregate sum of satisfaction or benefit that an individual gains from consuming a given amount of goods or services in an economy (Investopedia).
As mentioned before, society regards information as a commodity (marketable item produced to satisfy wants or needs) and the possession of it as an asset. Under these assumptions, information utility tries to measure the fitness or worth on a certain piece of information to some purpose or end. As seen in information quality and value, information utility is also a subjective concept which makes the attempt of quantifying it a laborious and imprecise activity.
31 Information Capacity
One predominant theme in much of this work is to build a new schema from existing ones using various structural manipulations. The new schema is intended to have equivalent information capacity with the original ones, or to subsume the information capacity of the original schemas in some sense.
The concept of information capacity investigated within data integration architectures, is seen as the increment in the number of queries that can be expressed over a set of databases integrated in a data integration architecture, and that could not be performed querying databases locally (Cappiello & Francalanci, 2011).
It’s important to notice that the concept of capacity and quality seems to evoke an intrinsic property of data and information, a potential that can be defined and evaluated independently from the usage, while value and utility seem to evoke a property that depends on several factors, but especially the context and the usage.
Information Cost
Information can, to some extent, be valued and costed in the same way as the other assets of organizations, and included in their financial reports. As inventory, information goes through the value-added stages of raw material (events or processes to be measured), work-in-progress (information in development), and finished goods (marketable information). Information gathering and presentation require capital investment and human labor. Besides being costly to acquire, information incurs management costs. Like physical assets, information faces quality control inspection before it can be distributed. Information is subject to just-in-time requirements, just like physical inventory. Left on its own, its value may depreciate over time (Fenner, 2002).
The adoption of data Integration architectures can be designed as part of a corresponding IT project and, thus, involves different types of costs, namely design time costs and run time costs (Cappiello & Francalanci, 2011). Design time costs are:
• Source wrapping cost: Local sources have to be registered in the data architecture and wrapped to enable information extraction. This cost depends on the number of sources that have to be integrated.
• Mapping cost: Design cost for the definition of the relations between global schema and local schemas.
• Maintenance cost: Maintenance cost of the integrated architecture. This is composed of the maintenance costs for wrapping and for mapping operations. Maintenance costs also vary with the number of sources integrated.
32
• Data quality cost: Costs associated with data quality assessment and cleaning operations.
Run time costs concern with query execution costs and depend on the frequency with which the information is queried and updated.
All the costs mentioned above will be more thoroughly covered in the methodology chapter of this research. For now, last thing worth mentioning is that just like in any IT project, technology mediating the information provision and its use/consumption cannot be taken for granted, and hence it has to be included in the cost analysis. Added to all design costs mentioned above, data integration also requires hardware and software investment (licensing) that account for fixed costs that must be considered in the beginning of any integration project (Howard P. , 2010).
Information Structure
In computer science, a data structure is a particular way of storing and organizing data in a computer so that it can be used efficiently (Black, 2004). Different kinds of data structures are suited to different kinds of applications, and some are highly specialized to specific tasks. For example, B-trees are particularly well-suited for implementation of databases, while compiler implementations usually use hash tables to look up identifiers.
Data structures are used in almost every program or software system. Data structures provide a means to manage huge amounts of data efficiently, such as large databases and internet indexing services. Usually, efficient data structures are a key to designing efficient algorithms. Some formal design methods and programming languages emphasize data structures, rather than algorithms, as the key organizing factor in software design.
In data integration, information structure is a very relevant issue especially when it comes to the design of the integrated databases. Understanding Local sources’ structure and defining the more convenient data structure for a mediated schema is imperative to the efficiency and easiness of how the data is manipulated.