UNIVERSITÀ DI PISA 13 43 IN S UP REM ÆDIG N IT A T IS
Facolt`a di Ingegneria
Corso di Laurea in Ingegneria Aerospaziale
Tesi di Laurea
Operational design of a test stand for
an applied field MPD thruster
Relatori:
Prof. Mariano Andrenucci
Dr.-Ing. Michael Winter
Dipl.-Ing. Daniel Haag
Candidati:
Matteo Chesi
Alessio Gori
FACOLT `
A DI PISA
Corso di Laurea in
Ingegneria Aerospaziale
UNIVERSITÀ DI PISA 1 34 3 IN S UP RE MÆ DIGN IT A T ISUNIVERSIT ¨
AT STUTTGART
Luft und Raumfahrt technik
INSTITUT F ¨
UR
RAUMFAHRTSYSTEME
Tesi di Laurea
Operational design of a test stand for
an applied field MPD thruster
Relatori:
Prof. Mariano Andrenucci
Dr.-Ing. Michael Winter
Dipl.-Ing. Daniel Haag
Candidati:
Matteo Chesi
Alessio Gori
Contents
1 Thesis Objectives 1
1.1 Numerical simulation program SAMSA . . . 3
1.2 Optimization process . . . 5
1.3 Thesis organization . . . 7
2 Space Propulsion 9 2.1 Thrust and specific impulse . . . 9
2.2 Tziolkovsky equation . . . 11 2.3 Thruster classification . . . 13 2.3.1 Chemical propulsion . . . 15 2.3.2 Nuclear propulsion . . . 15 2.3.3 Electric propulsion . . . 16 2.4 Electrothermal propulsion . . . 18 2.5 Electrostatic propulsion . . . 20 2.6 Electromagnetic propulsion . . . 23 3 Magnetoplasmadynamic thruster 27 3.1 Self-Induced magnetic field MPD . . . 28
3.2 Applied magnetic field MPD thruster . . . 34
3.3 Non ideal behaviour of MPD thrusters . . . 36 i
3.4 The AF-MPD laboratory thruster at IRS . . . 37
3.4.1 Ground test facility problematic . . . 38
3.4.2 IRS AF-MPD thruster geometry . . . 38
4 Ground test-facility design 41 4.1 The thrust balance . . . 41
4.1.1 Thrust balance old design . . . 42
4.1.2 Thrust balance new design . . . 43
4.1.3 Thermal control . . . 45
4.1.4 The force sensor . . . 50
4.1.5 Stiffness analysis . . . 53
4.2 The calibration system . . . 57
4.2.1 The force sensor subsystem . . . 58
4.2.2 The calibration mass subsystem . . . 59
4.2.3 The wheel mounting . . . 60
4.2.4 The calibration masses . . . 61
4.2.5 The mass lifting device . . . 64
4.3 The coordinate table . . . 66
4.3.1 Constraints . . . 67
4.3.2 Development . . . 70
4.4 Test facility devices and instrumentation . . . 78
5 Thrust balance calibration 81 5.1 Sensor calibration . . . 81
5.2 Thrust and sensor axes misalignment . . . 84
5.3 Calibration procedure . . . 86
5.4 Cooling water flow influence on the thrust measurement . . . . 87 ii
6 Magnetic coil characterization 93
6.1 Magnetic field in a coil . . . 95
6.2 Magnetic coil cooling system . . . 97
6.3 Hall probe . . . 107
6.4 Probe calibration . . . 109
7 First test of the thruster 113 7.1 Test description . . . 113
7.2 Results . . . 115
7.3 Mechanical solutions . . . 119
8 Conclusions 121
A Data sheet 129
B Magnetic coil characterization program 131
C Coordinate table program 139
D Table design 165
List of Tables
1.1 DFVLR-X16 performances and operational parameters. . . 2
2.1 Specific impulse Is and thruster . . . 14
2.2 Electric propulsion thruster principles . . . 25
4.1 Thermal shield geometrical and operational parameters . . . . 47
4.2 Temperatures and heating flow transmitted by conduction in the thrust balance . . . 49
4.3 Stiffness and deformation parameters . . . 56
4.4 Calibration mass table of quality . . . 63
4.5 Axis shield characterization . . . 68
5.1 Thrust measurement per cent error . . . 91
6.1 Magnetic coil geometrical constraints . . . 94
6.2 Magnetic coil operational constraints . . . 94
6.3 Multi-pipe solution lengths with dint=4 mm and dext=6 mm . 105 6.4 Comparison between singular pipe and multi-pipe solutions . . 105
6.5 Magnetic coil characterization geometry and power parameters 106
List of Figures
1.1 The DFVLR-X16 design. . . 3
1.2 AF-MPD laboratory thruster optimization process. . . 6
2.1 Mass propellant to specific impulse . . . 17
2.2 HIPARC arcjet thruster . . . 18
2.3 Ion thruster diagram . . . 21
2.4 MPD thruster diagram. . . 23
2.5 Hall effect thruster diagram . . . 24
3.1 Pumping and blowing effects in MPD thruster . . . . 29
3.2 Conic cathode MPD ideal model . . . 31
3.3 Hibrid MPD ideal model . . . 32
3.4 AF-MPD diagram. . . 34
3.5 MPD thruster characteristic diagram . . . 36
3.6 Design of the AF-MPD . . . 40
4.1 Thrust balance working principle. . . 42
4.2 The old thrust balance configuration. . . 43
4.3 The thermal shield. . . 46
4.4 Conduction heating model. . . 49
4.5 The sensor system. . . 50
4.6 Load cell specifications. . . 51 vii
4.7 Load cell calibration stand test. . . 52
4.8 Thrust balance scheme for stiffness calculation. . . 53
4.9 Stress model. . . 54
4.10 Swing arm scheme. . . 56
4.11 The linear unit. . . 58
4.12 Comparison wheel mounting solutions . . . 60
4.13 Calibration masses solutions. . . 62
4.14 Calibration mass geometry. . . 63
4.15 The mass lifting device. . . 64
4.16 New thrust balance configuration. . . 65
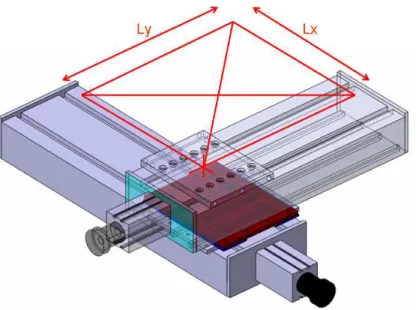
4.17 Assembly and movement field of the coordinate table. . . 67
4.18 Thermal shields size. . . 68
4.19 Probe support and heating shield. . . 69
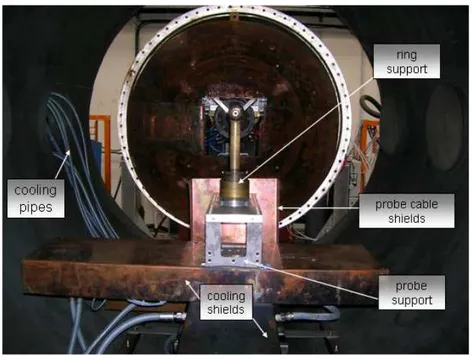
4.20 Coorinate table mounting fixed in the tank. . . 70
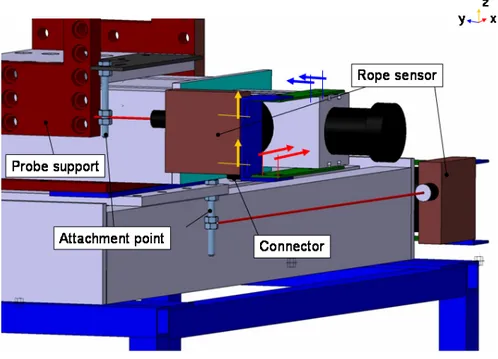
4.21 Rear view of the coordinate table and probe support. . . 71
4.22 Complete assembly of rope sensors. . . 72
4.23 Calibration of rope sensor signal model. . . 73
4.24 Systematic error introduced by attachment point and the rope sensor mounting. . . 74
4.25 Programme functions diagram. . . 76
4.26 Final coordinate table configuration. . . 77
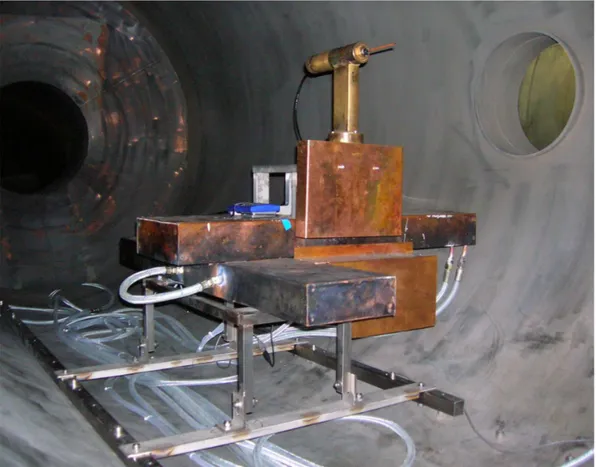
4.27 The test ground facility. . . 79
5.1 Sensor calibration. . . 82
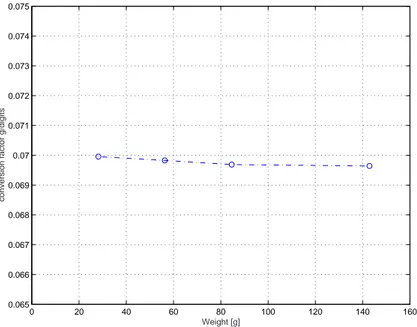
5.2 Conversion factor g/Digits. . . 83
5.3 Conversion factor N/Digits. . . 83
5.4 Thrust balance geometrical factor. . . 84
5.5 Sensor calibration . . . 85 viii
5.6 Low pressure cooling water influences. . . 87
5.7 High pressure cooling water test. . . 88
5.8 High pressure cooling water second test . . . 89
5.9 Average calibration line for high pressure cooling water test. . 90
6.1 Magnetic coil . . . 94
6.2 Magnetic induction by close circuit current. . . 95
6.3 Magnetic coil model with true size. . . 96
6.4 Length of copper pipe to diameters ratio for specific inner
diameter. . . 97
6.5 Heating power to diameters ratio for specific inner diameter. . 98
6.6 Mass flow rate to diameters ratio for specific inner diameter. . 98
6.7 Water flow velocity to diameters ratio for specific inner diameter. 99
6.8 Pressure drop in copper duct to diameters ratio for specific
inner diameter. . . 99
6.9 Outer diameter to diameters ratio for specific inner diameter . 100
6.10 Axial length to diameters ratio for specific inner diameter . . . 100
6.11 Maximum magnetic induction to diameters ratio for specific
inner diameter . . . 101
6.12 Multi-pipe solution: the longest of 5 pipes to diameters ratio
for specific inner diameter . . . 102
6.13 Multi-pipe solution: mass flow rate to diameters ratio for
spe-cific inner diameter. . . 102
6.14 Multi-pipe solution: water velocity to diameters ratio for
spe-cific inner diameter. . . 103
6.15 Multi-pipe solution: heating power to diameters ratio for
spe-cific inner diameter. . . 103
6.16 Multi-pipe solution: pressure drop to diameters ratio for
spe-cific inner diameter. . . 104
6.17 Hall generator. . . 107
6.18 Magnetic field interaction. . . 108
6.19 Magnetic center position along the linear unit. . . 109
6.20 Comparison of numerical and experimental data. . . 110
6.21 Comparison of numerical and experimental data. . . 111
6.22 Magnetic field distribution due I = 100 . . . . 112
7.1 First operation of the AF-MPD laboratory thruster. . . 114
7.2 Damaged PVC mounting. . . 115
7.3 Thruster and magnetic coil missalignement after the test. . . . 115
7.4 Inner thruster view. . . 116
7.5 Cathode mounting damage. . . 117
7.6 Damage representation. . . 118
7.7 New thruster axial section. . . 120
7.8 New thruster configuration representation. . . 120
A.1 Linear guide. . . 129
A.2 Axial Hall probe. . . . 130
A.3 Perpendicular Hall probe. . . . 130
Nomenclature
Variable Description Unit
∆m Propellant mass consumed [kg]
∆p Pressure drop [bar]
∆t Interval integration time [s]
∆T Interval temperatures [0C]
∆v Vehicle variation of velocity [m· s−1] Ae Exit thruster cross section [m2] Acopper Copper pipe cross section [m2] Apipe Pipe cross section [m2]
b Proportional constant between F and I2 [-]
B Magnetic induction [T]
Bz Axial magnetic induction component [T]
Br Radial magnetic induction component [T]
Bθ Azimuthal magnetic induction component [T]
Bext Applied magnetic field [T]
ce Propellant effective exhaust velocity [m· s−1]
cp Propellant specific heat at constant pressure [J· g−1· K−1]
d Distance between electrodes [m]
dint Inlet diameter pipe [m]
dext Outer diameter pipe [m]
d ~B Infinitesimal magnetic induction [-]
d~l Infinitesimal length [-]
dV Infinitesimal volume [-]
Dint Inlet diameter coil [m]
Dext Outer diameter coil [m]
E Electric field [V· m−1]
F Thrust [N]
FBself Thrust component by self-induced magnetic field [N] FBapplied Thrust component by applied magnetic field [N] Fgasdynamic Thrust obtained expanding in a nozzle [N]
Fp Thrust due at the pressure [N]
Ftot Total thrust [N]
Fr Radial Lorentz force [N]
Fz Axial Lorentz force [N]
~
Fext Vector external force [N]
I Current [A]
Is Specific impulse [s]
Itot Total specific impulse [s]
j Ion current density [A· m−2]
jr Radial j component [A· m−2]
jz Axial j component [A· m−2]
jθ Azimuthal j component [A· m−2]
k Proportional constant between P and mp [-]
K Stiffness [N·m−1]
Lcoil Magnetic coil wire length [m]
Lpipe Pipe length [m]
M Vehicle mass [kg]
˙
m Mass flow rate [kg· s−1]
mp Mass power unit [W· kg−1]
M0 Start vehicle mass [kg]
Mf Final vehicle mass [kg]
Mion Ion mass [kg]
pe Exit section average pressure [kg· m−2]
p(r) Plasma pressure on radius r surface [kg· m−2]
pext Plasma pressure [kg· m−2]
p∞ Ambient pressure undisturbed [kg· m−2]
P Power [W]
Pdissipated Power dissipated [W]
Pexhaust Effective power absorbed [W]
PF F Frozen flow power [W]
Pdep Power loss through the electrods [W]
Q Ion charge [C] ˙ Q Heating power [W] r Radial coordinate [m] ra Anode radius [m] rc Cathode radius [m]
Rcoil Magnetic coil electric resistance [ω] Rpipe Pipe electric resistance [ω]
Re Reynolds number [-]
t Time [s]
Tc Combustion chamber temperature [K]
u Macroscopic velocity [m· s−1]
ue Propellant average exhaust velocity [m· s−1]
~v Vehicle vector velocity [m· s−1]
V Potential [V]
Vh Hall voltage [V]
w Cooling water flow velocity [m· s−1]
W Weight force [N]
z Axial coordinate [m]
δ Linear deformation [m]
θ Angular deformation [m] ξ Load loss coefficient [-] η Thruster efficiency [-]
ε Dielectric permittivity [F· m−1] µ Propellant molecular mass [g· moli−1] σe Electrical conductivity [Ω· m]−1
Constants
cp Specific heat capacity at constant pressure of water, cp= 4, 186 J · g−1· K−1 g0 Acceleration gravity, g0= 9.801 m · s−2
µ0 Magnetic permeability of free space, µ0= 4π·10−7 T · m · A−1 ν Kinematic viscosity of water at 20oC, ν = 1, 4 · 10−6 m2· s ρ Copper resistivity , ρ = 0, 0167 Ω· mm2·m−1
ρwater Water density, ρwater = 1000 kg·m−3
σ Stefan-Boltzmann constant, σ = 5.67 · 108 W· K−1· m−1
xv
Ringraziamenti
Alle uniche due persone con le quali ho condiviso i sacrifici fatti per il raggiungimento del traguardo.
Un grazie di cuore hai miei genitori per il costante impegno con cui mi hanno sostenuto imprescindibilmente duranti gli anni di Universit`a.
Abstract
MPD thrusters are suitable for interplanetary missions for their high speci-fic impulse and high thrust density, but they are still characterized by low efficiency (lower than 50%). Their experimental investigation is necessary to better understand accelerating mechanisms and to find an optimal thruster design. In the present work the assembly of a test stand for the investigation of the IRS laboratory thruster is given.
A more detailed description concerns the design and the installation of the thrust balance for thrust measurement, the coordinate table for plasma dia-gnostic probe positioning and the magnetic coil. The thrust balance has been characterized under the influence of cooling water and calibrated in order to have a good accuracy in thrust measurement.
A first test has been made on the applied magnetic field distribution using the coordinate table which supported a Hall probe. The IRS laboratory th-ruster has been put into operation to establish stable operation conditions. The experimentation and the activities have been carried out at IRS plasma laboratory of the University of Stuttgart under the supervision of Dr.-Ing. Michael Winter and Dipl.-Ing Daniel Haag.
Chapter 1
Thesis Objectives
Forthcoming high-power interplanetary missions are inconceivable without the assistance of high specific impulse. That is why AF-MPD thrusters are suitable candidates for a manned Mars mission. Besides, other relevant ad-vantages are high-thrust density, good scalability to high power levels and compact geometry. They have been studied for over than thirty years [1] in several research centers in Germany, USA, Russian and Japan, but they are not flight-qualified yet. In laboratory tests very low pressure must be achieved in the tank. In addition, the interaction of the magnetic field with the tank wall must be avoided.
The best way to test an AF-MPD would be to do so in space and this was considered from the Institute of Space System of Stuttgart (IRS) in 1996. The IRS proposed an experimental platform for an AF-MPD thruster to be mounted on the International Space Station (ISS). That would help to bet-ter understand acceleration mechanisms and clarify environmental influences. Before the investigation of AF-MPD thrusters in space can start, it is neces-sary to optimize a magnetoplasmadynamic thruster design.
For this reason the DFG (Deutsche Forschungs-gemeinschaft) has funded a 1
2 CHAPTER 1. THESIS OBJECTIVES
project for the development and the experimental investigation of an AF-MPD laboratory thruster which later will be optimized using comparison with a numerical simulation software, called SAMSA (Self and Applied field MPD thruster Simulation Algorithm) developed also by IRS.
The laboratory thruster model was designed in 2005 and it was built follo-wing the same design as one of the best AF-MPD thruster for noble gases ever tested up to date: the DFVLR-X16 [2]. This thruster is shown in Fig.
1.1. The following table represents DFVLR-X16 performances1 and
opera-tional parameters, the starting points of this project.
DFVLR-X16 η 38% Thrust 250 mN ce 36 km/s B 0.6 T I 80 A Pin 12 kW pamb 5 · 10−4 bar
Table 1.1: DFVLR-X16 performances and operational parameters. The main goals of this thesis are the design of the test stand for an AF-MPD of 10÷20 kW - in particular the thrust balance to measure the thrust - the coordinate table for probe positioning and plasma diagnostic and the ma-gnetic coil. Once these objectives are reached, the work can continue with the characterization of every stand component and thruster experimental investigation.
1.1. Numerical simulation program SAMSA 3
Figure 1.1: The DFVLR-X16 design.
1.1
Numerical simulation program SAMSA
The numerical simulation program SAMSA (Self and applied MPD thruster simulation algorithm) has been developed by IRS [2].
The code is based on a axialsymmetric finite volume method on unstructured, adaptive meshes. Because of the axialsymmetric geometry of the thruster, the plasma flow inside the channel is analyzed with the two-dimensional form of the conservation equations.
With regards to all accelerating mechanisms which must be considered in the simulated AF-MPD thruster, SAMSA includes into the physical model also azimuthal components of current density and the anomalous diffusion. The approach to the numerical problem can be considered quasi-three dimensional and it uses azimuthal derivatives set to zero.
4 CHAPTER 1. THESIS OBJECTIVES
The main assumption that has been made on the plasma flow is to con-sider it as a continuous flow on which a two-fluid analysis in thermal and chemical non-equilibrium can be applied.
Turbulences can be assumed to be negligible because of the strong viscous dissipation in the hot plasma and low pressure level in AF-MPD thrusters. Besides the azimuthal component of the magnetic field conservation equation considered for S-MPD, SAMSA includes also the axial and radial compo-nents.
The inlet boundary conditions are given from specified values of the mass flow rate and the temperature, which are kept constant by a numerical flow controller. On solid walls the velocity is set to zero, heavy particles tempe-rature is set to a specified wall tempetempe-rature and electrons flux is set to zero. These three assumptions represent a no-slip boundary condition.
The outflow and the remaining inflow in the vacuum chamber can be simula-ted with subsonic or supersonic flow conditions depending on the local Mach number.
The inlet operational parameters which can be changed are: the anode cur-rent, the coil curcur-rent, the ambient pressure, the anode and cathode mass flow rate. The geometric parameters are: anode and cathode length and diame-ter, the coil position along the thruster and the relative distance between the anode and cathode tips.
1.2. Optimization process 5
1.2
Optimization process
Before the IRS laboratory thruster can be optimized, it is necessary to vali-date the numerical simulation program SAMSA.
That is possible by making SAMSA to work with the same operational con-ditions which are used for the AF-MPD thruster tests and by comparing simulated and experimental results.
The validation of SAMSA is very important as it allows to limit the high cost due to the manufacture of the mechanical components of the thruster. When the simulation programme gives reliable data, the optimization pro-cess of the laboratory thruster can start. The same initial thruster design and operational conditions are considered for SAMSA and the experimental test.
By comparing tested and simulated thruster performances it is possible to understand if the thruster design is in a condition of optimum or if it is ne-cessary to modify its geometry. The AF-MPD thruster optimization process is represented in Fig. 1.2.
6 CHAPTER 1. THESIS OBJECTIVES
1.3. Thesis organization 7
1.3
Thesis organization
In chapter 2 an overview on space propulsion thrusters is given. The characteristic physical lengths of space thrusters are defined and thruster classified respect to their acceleration processes and power system supply. In chapter 3 an overview on magnetoplasmadynamic thrusters is given. The acceleration process is explained in the general case of self field MPD thrusters and in the specific case of AF-MPD thrusters. After a short review of non-ideal MPD thrusters behaviour, a section is dedicated to the IRS laboratory thruster model description.
In chapter 4 the ground test facility and the development of the coordinate table and the thrust balance system are explained.
In chapter 5 the setting and the characterization of the thrust balance system under cooling water influences at low and high pressure is shown in order to quantify external influences on the thrust measurement.
In chapter 6 a description of the magnetic coil mounted on the thruster and results of magnetic field measurements are given to show some differences from numerical results obtained from the numerical simulation with SAMSA. In chapter 7 the IRS laboratory thruster model is analyzed after a first experimental test. Mechanical modifications of the thruster are described. In chapter 8 a summary and conclusions are given .
Chapter 2
Space Propulsion
Rocket propulsion systems can be classified in two main categories. The first includes all chemical thrusters having a F/W thrust to weight ratio greater than one. They have to supply the energy required to overcome the gravita-tional earth field.
Proper to the second category are all these propulsion systems characteri-zed by F/W much lower than one, such as: electrothermal, electrostatic and electromagnetic thrust generators. These kinds of thrusters are particu-larly suitable for orbit transfer, satellites control and generally for launchers starting from space platforms. Their employment enables to increase the payload.
2.1
Thrust and specific impulse
In the aerospace field the propulsive force acting on a vehicle is obtained by accelerating the propellant to high velocity. This principle is based on the motion conservation equation; the propellant is initially stored in the space-craft, then it is energized and secondary accelerated and expelled externally
10 CHAPTER 2. SPACE PROPULSION
through a duct. The propellent expelled is the mass flow rate ˙m.
The result of such a process is a thrust force acting on the vehicle along the same direction but opposite versus the expelled propellant.
F = ˙m · ue (2.1)
The exhaust velocity is not completely uniform on the exit section of the
nozzle, in fact ue is the average exhaust velocity. If the medium pressure
of the flux on the exit section is different from the ambient pressure, than another contribution to the thrust must be considered, given by:
Fp = Ae· (pe− p∞) (2.2)
where, Ae is the exit cross section, pe is the exit section average pressure and
p∞ is the ambient pressure undisturbed.
The total thrust result to be:
Ftot = ˙m · ue+ Ae· (pe− p∞) (2.3) Defining the effective exhaust velocity as:
ce = ue+ Ae· (pe− p∞) ˙ m (2.4) Thus : Ftot = ˙m · ce (2.5)
The total impulse is defined as: Itot =
Z t
0
2.2. Tziolkovsky equation 11
The specific impulse is the total impulse for weight unit of the consumed propellant: Is= Rt 0 F dt g0· Rt 0 m dt˙ (2.7)
In case of constant thrust and constant propellant flux, the above equation becomes:
Is = F g0· ˙m
(2.8)
The specific impulse is measured in seconds and it indicates the impulse rea-chable with 1 kg of propellant. With a specific impulse of 200 s and 1 kg of propellant it is possible either to produce a thrust of 1 N for 200 s or a thrust of 200 N for 1 s.
2.2
Tziolkovsky equation
The vectorial equation describing the motion of a vehicle in space is: M ·d~v
dt = − ˙m · ~ce+ ~Fext (2.9)
Where:
M, vehicle mass ˙
m, expelled propellant mass flow ~v, vehicle velocity
12 CHAPTER 2. SPACE PROPULSION
~
Fext, resultant of external forces acting on the vehicle
If external forces are not present, or the engine time shot is really short (impulsive thrusters), the last term in the second member of the equation is negligible:
M · d~v = −~ce· dm (2.10)
Multiplying it scalarly by the unit vector −→V k−→V k and observing that
dm=−dM, we obtain the following scalar equation:
M · dv = −ce· dM (2.11)
The integration of last formula gives Tziolkovsky equation, which relates the vehicle variation of velocity to the propellant mass consumed (∆m = M0− Mf): ∆v = ce· ln à M0 Mf ! (2.12) This equation shows the importance of a high specific impulse. By taking
constant ∆v and increasing the effective exhaust velocity, the ratio M0/Mf
decreases. This means that it is possible to store less propellant and use a higher payload mass.
2.3. Thruster classification 13
2.3
Thruster classification
Thrusters for space propulsion can be classified either on the basis of the acceleration process of the propellant or considering the energy source used. Three acceleration processes can be listed:
1. gasdynamic: the propellant at high pressure and temperature is ex-panded and accelerated through a well defined nozzle.
2. electrostatic: the propellant is at first ionized, than ions are separated from electrons and finally accelerated by an electric field.
3. electromagnetic: the propellant, in state of plasma, is accelerated thanks to a force deriving from the interaction between an electric current and a magnetic field (Lorentz force).
Moreover, it is possible to make another classification of the thrusters, looking at the different ways of power supply:
1. chemical propulsion: the energy is supplied by an exothermic chemical reaction (burning).
2. nuclear propulsion: the energy is gained from nuclear fission and sup-plied as heat to the gas propellant.
3. electrical propulsion: a generator supplies electric energy which is used for producing electric and magnetic fields able to ionize and accelerate the propellant.
14 CHAPTER 2. SPACE PROPULSION
Chemical propulsion Nuclear propulsion Electric propulsion
Gasdynamic Liquid fuel Nuclear fission Resistojet
process Is= 300÷ 450 s Is= 800÷ 1000 s Is= 280÷ 350 s
Solid fuel Arcjet
Is= 180÷ 250 s Is= 400÷ 2000 s
Electrostatic Ion thruster
process
-
-
Is= 3000÷ 8000 s FEEP Is< 8000 Electromagnetic MPD thruster process-
-
Is= 1000÷ 3000 s Hall thruster Is= 2000÷ 3500 s2.3. Thruster classification 15
2.3.1
Chemical propulsion
Chemical thrusters are mainly summarized in two categories:
• solid propellant chemical thrusters: which can reach between 180 and
250 seconds specific impulse.
• liquid propellant chemical thrusters: which are characterized by a
spe-cific impulse not higher than 500 seconds.
Both types of thrusters work thanks to the energy obtained from a exother-mic cheexother-mical reaction. Cheexother-mical species are contained in the propellant and the energy provided from the reaction makes the reaction products tempe-rature increase, so that they can be accelerated gasdynamically through a nozzle.
The exhaust velocity as the specific impulse depends on the combustion chamber temperature and on the propellant molecular mass.
ue∝ s
Tc
µ (2.13)
The heighest specific impulse obtainable is related to the upper level of energy given from a chemical reaction. This aspect represents a limit of chemical propulsion which must be considered together with the structural limit due to the high temperatures reachable in the combustion chamber.
2.3.2
Nuclear propulsion
As in chemical thrusters, also in nuclear thrusters accelerative process is gasdynamic. Here the energy necessary to heat the propellant is supplied by a nuclear reaction. In particular, the heat available is the product of a nuclear fission reaction between uranium isotopes. With this method specific impulse of 800 ÷ 1000 s can be reached using hydrogen as propellant.
16 CHAPTER 2. SPACE PROPULSION
2.3.3
Electric propulsion
In the electric propulsion the propellant is accelerated by electric heating and/or by forces of electric and magnetic fields. Electric thrusters convert the energy produced from a generator in kinetic energy of the accelerated propellant and they take advantage of all accelerating processes mentioned before (gasdynamic, electrostatic, electromagnetic). The specific impulse is one order higher than in chemical propulsion and the energy required, which can be obtained from solar energy or in form of nuclear energy, is also greater compared to chemical propellants.
The low mass of propellant consumed can be considered another advantage together with the high payload mass. However, the mass of the power sup-ply subsystem must be as low as possible. The thrust density, defined as the thrust to the thruster exit section ratio, is very low. That makes the mission flight time increase and flight trajectories complicated.
By developing such innovative type of propulsion we wish to reach high spe-cific impulse values. Considering for example a mission where the thruster works during an interval ∆t with thrust and mass flow rate constant, the propellant mass consumed is:
∆m = ˙m · ∆t = F · ∆t
ce
= F · ∆t Is· g0
(2.14) It means that higher is the specific impulse lower is the propellant mass consumed.
Unfortunately the electric generator must supply all power required. In first
approximation it can be taken the power unit mass mp to be proportional to
the power generated P :
2.3. Thruster classification 17
Then, given the thruster efficiency η as the power of the expelled mass flow to the thruster power supply ratio:
η = 1 2 · ˙m · c2e P = Is· g0· F 2 · P ⇒ P = Is· g0· F 2 · η (2.16) it follows that: mp = k · Is· g0· F 2 · η (2.17)
A higher specific impulse corresponds to a higher power generator mass. It is necessary to find a value of compromise for the specific impulse. The task
is to minimize ∆m + mp in order to get a higher payload mass.
In Fig. 2.1 a minimum value of the mass for the optimum value of the spe-cific impulse is shown. This is an approximated model (for constant-thrust mission) by which it is possible to evaluate the maximal payload mass for a
Is value of specific mission.
Figure 2.1: Dependence of propellant mass ∆m and power supply mass ˙m
18 CHAPTER 2. SPACE PROPULSION
2.4
Electrothermal propulsion
Electrothermal propulsion includes all thrusters where the propellant is elec-trically heated and then expanded through a nozzle to convert the thermal energy in kinetic energy. Three subclasses of this family can be listed on the basis of the different heating technique of propellant:
1. Resistojet, in which the heat is transferred to the propellant by a solid surface, like the wall chamber or an electric resistance.
2. Arcjet, in which the propellant is heated by an electric arc generated between electrodes, shown in Fig. 2.2.
3. Inductive and radioactive heating systems, in which propellant is hea-ted by high frequency radiations.
Figure 2.2: HIPARC arcjet thruster 100 kW, H2 propellant [18].
In these thrusters effects like heat, wall transfer and frozen flow losses (losses due to lost energy, ”frozen”, in the inner modes and in the molecular dissociation) are observed.
2.4. Electrothermal propulsion 19
Generally, the performance of an electrothermal thruster can be studied with one-dimensional energetic considerations by estimating the upper limit of the flow exhaust velocity with the exhaust velocity of a completely expanded nozzle, as:
ue ≤ p
2 · cp· Tc (2.18)
Where Tcis the maximum temperature tolerable in the chamber and cp is the
specific heat capacity at constant pressure. Since all propellants with a lower molecular weight are preferred, hydrogen would be an optimal propellant, but it is difficult to be stored and because of its low temperature it often cools the flow. For this reason more complex molecular gases like ammonia and hydrazine are preferred.
20 CHAPTER 2. SPACE PROPULSION
2.5
Electrostatic propulsion
Thermal limitations observed in electrothermal acceleration processes in-fluence negatively the exhaust velocity and the thruster life time.
With ion thrusters this problem can be overcame by accelerating the pro-pellant by an external mass force. In Fig. 2.3 is shown a beam of atomic ions accelerated with an applied electric field and then neutralized. The ve-locity of the neutral current is determined by the potential fall between the ions source and the neutralizer plan, but also by the charge to mass ratio of the ionic species. The specific impulse reachable is often between 3000 and 4500 s [12]. Because of the considerable mass necessary to the power system, which is proportional to the exhaust velocity, this thrusters optimize their thrust efficiency at too high exhaust velocities. Electrostatic thruster have a big disadvantage as they are limited in the thrust density obtainable because of the electric field distortion produced from space charge distribution. The maximum ion current density which can be reached in a one-dimensional accelerative scheme with an electrodes distance d and an applied potential V is: j = 4ε 9 · Ã 2Q Mion !1/2 · V3/2 d2 (2.19)
where ε is the dielectric permittivity and Q/Mion is the charge to ionic mass
ratio. Thus, the maximum thrust density only depends on V /d:
F Ae = m · c˙ e Ae = j · Mion· ce Q = 8ε 9 · Ã V d !2 (2.20)
2.5. Electrostatic propulsion 21
while the correspondent exhaust velocity only depends on Q/Mion and of V :
ce= Ã 2 · Q · V Mion !1/2 (2.21)
For typical values of V , d and Q/Mion, it is evident that the power and thrust
densities are rather low, few Newton and 105 W for square meter [12], in the
best hypothesis.
Figure 2.3: Ion thruster diagram .
The positive aspect of these thrusters is that the thrust efficiency is essen-tially limited only by the energetic cost necessary for ions production which is a little fraction of their exhaust kinetic energy.
The thrusters have a quite long life (> 20.000 hours), a relatively low plume
divergence (< 20o), high efficiency (∼ 65%) with exhaust velocity of 30000
÷ 45000 m/s and supplied power between 200 and 4000 W [1]. Advantages are reduced by a low thrust density, a complex system for the ions generator, the accelerative grid design and high voltages which mean a heavy power sy-stem mass supply to power ratio. Most ions generators are constituted from electronic bombardment devices where positive ions are produced thanks to
22 CHAPTER 2. SPACE PROPULSION
the impact of a propellant gas as Xenon or Mercury with electrons emitted thermoionically from incandescent cathodes. Other solutions are represented from radiofrequency ions generators (RF ), in which ions are created inside an isolated discharge chamber, generally made of quartz or ceramic, by the excitation of free electrons radiofrequency in the used gas propellant.
2.6. Electromagnetic propulsion 23
2.6
Electromagnetic propulsion
Electromagnetic thrusters are based on the interaction between an electric current flowing through the conductive propellant and a magnetic field which occupies the same region. This interaction produces a mass force accelerating the propellant up to exhaust velocities much higher than in an electrothermal thruster. Also, the thrust densities obtainable are greater than in the elec-trothermal case, but the physical phenomenology taking part in this accele-rative processes is more complex and analytically less tractable. In addition, unlike the electrostatic thrusters, the highly ionized working fluid is macro-scopically neutral and it does not have space charge limitations. Applied magnetic fields and inner currents can be stationary, pulsed or alternated on a frequency range. The magnetic field can be applied externally and/or induced by currents flowing in the plasma. Many propellants, solid and li-quid can be used. Further on, electrodes geometry, the duct form, injection devices, ionization systems and electric power supply modes can be varied.
24 CHAPTER 2. SPACE PROPULSION
The most advanced thrusters in this category are:
• Self-induced magnetoplasmadynamic thrusters, S-MPD, Fig. 2.4: the propellant is ionized by the current discharge between the anode and the cathode. The interaction between the currents and the induced magnetic field produces a mass force accelerating the flow. The specific impulse reaches 1500 s.
• Applied magnetic field MPD thrusters, AF-MPD: they are different from S-MPD for an external and coaxial magnetic coil which introduces an external magnetic field to increase the azimuthal Hall current in order to get higher thrusts.
• Hall Effect Thruster, HET, Fig. 2.5: the propellant is ionized by a strong azimuthal electrons current generated from the interaction of a longitudinal electric field with a radial magnetic field induced by a coil mounted externally. The specific impulse values are around 2000 ÷ 3500 s.
2.6. Electromagnetic propulsion 25 Thruster T yp e Prop ellan t Adv an tages, Disadv an tages, Remarks Electrostatic complicated design, for lo w p ow er lev els < 5 kW, ION Xenon difficult to scale up, high efficiency , high ce (20 ÷ 80 km/s), (Mercury) lo w thrust densit y, needs neutralizer Hall Ion uncomplicated design, but difficult to scale up (Stationary Plasma Thruster) Xenon ab ov e 5 ÷ 10 kW, medium ce (20 ÷ 30 km/s) SPT (Krypton, Argon) lo w thrust densit y; needs neutralizer Thermal Hydrogen restricted ce : 10 ÷ 20 km/s for hydrogen Arcjets Hydrazine 5÷ 7 km/s for hydrazine,ammonia Ammonia high thrust densit y, no neutralizer needed Self Field limited ce : 15 km/s, uncomplicated design, MPD Noble Gases but only for p ow er lev els > 100 kW, lo w efficiency (h ydrogen) high thrust densit y, no neutralizer needed Applied Field medium ce : 10 ÷ 40 km/s, uncomplicated design, MPD Noble Gases but only for p ow er lev els > 5 kW, easy to scale up (Alk ali Metals) high thrust densit y, no neutralizer needed T able 2.2: Electric propulsion thruster principles [5]
Chapter 3
Magnetoplasmadynamic
thruster
In MPD thrusters plasma acceleration is mainly due to the Lorentz force produced by the interaction of an electric current density j with a magnetic field B.
If the plasma has a conductivity σ, a macroscopic velocity u and an applied electric field E, the current density j = σ · (E + u × B) interacting with the electric and magnetic field will give a mass force F = j × B which accelerates the plasma.
As shown in Fig. 2.4 a MPD thruster is characterized by a coaxial geometry consisting of a central cathode, a ring anode and an insulator positioned between the electrodes. The propellant is fed upstream of the channel and ionized through the arc discharge generated between the electrodes.
If the discharge current is high enough, the azimuthal induced magnetic field is sufficient to apply axial and radial forces which accelerate the propellant downstream and compress it towards the symmetry axis. The plasma is very hot at this point and its subsequent expansion along the axial direction
28 CHAPTER 3. MAGNETOPLASMADYNAMIC THRUSTER
breeds the exhaust velocity useful for the generation of the thrust. MPD thruster distinguish in two categories:
1. Self-induced magnetic field MPD
2. Applied magnetic field AF-MPD
The geometrical configuration is the same for both types of thrusters with
the only difference that in AF-MPD thrusters, the applied Bext magnetic
field gives additional contributions to the thrust which becomes greater than in S-MPD.
3.1
Self-Induced magnetic field MPD
Considering the gas as continuous, different force components taking part in the magnetoplasmadynamic interaction can be distinguished. The main acceleration is the axial one due to the combination of a radial current with a self-induced azimuthal magnetic field. This product is defined as the blowing electromagnetic effect. Another effect, defined as pumping and created by the interaction of an axial current with the self-induced azimuthal magnetic field, is produced when an electromagnetic force restricts the plasma near the axis. For an analytical analysis, this schematization with the pumping and blowing effects is used. First of all, let is consider the potential difference applied between the two electrodes generating an electric discharge.
The product is a mainly radial current j which produces an azimuthal
self-induced magnetic field Bθ. As j has an axial component jz and a radial
component jr , the Lorentz force has two components too:
1. Fz = jr·Bθ, directed axially and mainly responsible for ions acceleration
3.1. Self-Induced magnetic field MPD 29
2. Fr = −jz · Bθ, directed radially and pushing ions towards the central
axis of the thruster. This is defined as the pumping effect, which gives a considerable contribution to the thrust by increasing the pressure in front of the cathode tip.
The blowing effect can be evaluated by considering only the radial component of the arc discharge. Besides the hypothesis of uniform current distribution along the azimuthal and axial direction, and coaxial and cylindrical electrodes
of finite length, with radius rc for the cathode and ra for the anode is made.
From the Maxwell equation [12], the magnetic field induced from the charges
Figure 3.1: Pumping and blowing effects in MPD thruster [10]. motion can be evaluated. The magnetic field is a function of the current. It is totally azimuthal, linear along the axial direction z and proportional to 1/r: Bθ(r, z) = µ0· I 2 · π · r à 1 − z z0 ! (3.1)
30 CHAPTER 3. MAGNETOPLASMADYNAMIC THRUSTER
where, z0 is the axial cathode length or the chamber length, rc is cathode
radius and ra is the anode radius. The current I is given by:
I = 2 · π · rc· z0· jr (3.2)
The axial thrust component Fz is given by the volumetric integral of the
thrust density:
Fz = Z
V
(jr· Bθ) dV = Fblowing (3.3)
And considering the thrust scheme of Fig. 3.2, it becomes:
Fz = µ0· I2 4 · π · ln à ra rc ! (3.4)
If the tip of the cathode is defined, as shown in Fig. 3.2b, the integral in Eq. 3.3 changes. Besides, if the current distribution on the cathode surface is variable as 1/r, the axial thrust component is given by:
Fz = µ0· I2 4 · π " ln à ra rc ! +1 2 # (3.5) Otherwise, if the current distribution is assumed to be constant on the cathode surface and variable as 1/z on the anode surface, the axial thrust component is given by : Fz = µ0· I2 4 · π " ln à ra rc ! +1 4 # (3.6)
3.1. Self-Induced magnetic field MPD 31
Figure 3.2: Ideal MPD model, (a) uniform radial current, (b) radial current on conic cathode [10].
the discharge current flows uniformly through the base surface of a cylindrical cathode, as shown in Fig. 3.3. In the equilibrium the radial force density
must be equivalent to the plasma pressure pextwith p(r)is the plasma pressure
on radius r surface; integrating the difference of pressure on the surface a new contribute to the thrust is given:
Fpumping = Z S (p(r)− pext) dS = µ0· I2 8 · π (3.7)
The total thrust can be calculated adding the two contributes previously considered separately: F = µ0· I2 4 · π " ln à ra rc ! + K # (3.8) The constant K is depending on the tip form (for example K = 0.75 for a cathode with conic tip). Equation 3.8 represents only a first approximation of the thrust, as for this calculation the specific trajectory of the discharge
32 CHAPTER 3. MAGNETOPLASMADYNAMIC THRUSTER
Figure 3.3: MPD ideal model,(c) uniform axial current, (d) hibrid model [10].
current was not considered. In non-ideal MPD most current lines have arc trajectories. For every AF-MPD thruster the total thrust is proportional to the square of the current flowing throughout the thruster:
F = b · I2 (3.9)
The thrust law shows that the electromagnetic acceleration does not depend on the mass flow rate or the axial dimensions, but it depends on the radial dimensions. The effective power absorbed from the thruster and the exit power to the thruster efficiency ratio is:
Pexhaust = 1 2 · ˙m · c 2 e = F2 2 · ˙m = b2· I4 2 · ˙m (3.10) Thus: P = b 2· I4 2 · η · ˙m (3.11)
The potential difference applied to electrodes is:
V = P I =
b2· I3
3.1. Self-Induced magnetic field MPD 33
The main relations of proportionality in a MPD thruster can be reassumed as follows:
F ∼ I2 (3.13)
V ∼ I3 (3.14)
P ∼ I4 (3.15)
The previous relations are exact just in case of ideal MPD. In real case other phenomena must be considered, such as: the incomplete ionization and plasma instability.
34 CHAPTER 3. MAGNETOPLASMADYNAMIC THRUSTER
3.2
Applied magnetic field MPD thruster
When an applied external magnetic field is superimposed on the accelerative MPD channel, the situation changes considerably. The Lorentz forces pro-duce a vortex effect in the plasma. The strong axial magnetic field obstructs electrons flowing to the anode and makes them follow longer trajectories out of the thruster, as shown in Fig. 3.4.
Figure 3.4: AF-MPD diagram.
In this type of thruster the self-induced magnetic field is often as high as the applied magnetic field generated from the magnetic coil. The Hall pa-rameter is around 3 ÷ 5, so that the AF-MPD behaviour can be collocated between the one of S-MPD and Hall thrusters.
The presence of the applied magnetic field Bext with Bz and Br
compo-nents provides greater efficiencies, minor sensitivity to instabilities and lower cathode erosion than in S-MPD thrusters.
3.2. Applied magnetic field MPD thruster 35
Concerning the thrust other contributes must be considered:
1. The axial component Bz interacts with the radial discharge current,
generating an azimuthal Lorentz force. The result is a new azimuthal
electric current density jθ which, added to the axial component of the
applied magnetic field, produces a Lorentz force directed radially to the center of the thruster. This also contributes to the pumping effect.
2. The radial component Br interacts with the azimuthal current jθ,
ge-nerating a force which accelerates axially the plasma (increasing the blowing effect).
The total thrust of an AF-MPD thruster can be estimated as follows: F = FBself + FBapllied+ Fgasdynamic (3.16) where the first two terms on the right side are electromagnetic components derived from self-induced field and applied field respectively, while the third
term is the gas-dynamic component. The term FBself is given by 3.9 and
the following relations express each thrust component in terms of thruster operating and geometrical parameters [16]:
FBapplied = 0.1 · I · B · Da (3.17)
Fgasdynamic= 1.6 · ˙m · ap (3.18)
In the previous formula, B is the applied field and Da is the anode
dia-meter, both evaluated at the thruster outlet, I is the discharge current, ˙m is
the total propellant mass flow rate and ap is the plasma sound velocity for
36 CHAPTER 3. MAGNETOPLASMADYNAMIC THRUSTER
3.3
Non ideal behaviour of MPD thrusters
Expressions 3.13, 3.14 and 3.15 are verified only within a rather restricted range of MPD working field. At too high or too low currents the behaviour of a MPD thruster cannot be considered ideal anymore. Below a specific value of the current, depending on the chosen mass flow rate, the potential rate with the current is linear and not cubic. Above this current value the
potential rate is ideal again (V ∼ I3), but at increasing current, another non
ideal zone begins: V ∼ I.
The difference between the ideal and the non ideal curves, shown in Fig. 3.5, is due to different phenomena such as the ionization process of the propel-lant at low current values and the electric discharge instability, also defined as onset, at high current values.
3.4. The AF-MPD laboratory thruster at IRS 37
3.4
The AF-MPD laboratory thruster at IRS
AF-MPD thrusters are considered the most powerful electric propulsion de-vices compatible with today’s spacecraft (S/C) boundary conditions cha-racterized by high specific impulse, sufficient thrust and compact geometry. However, there is a widespread difference of opinion as to the effectiveness and competitiveness in comparison to the other electric propulsion devices. Operational conditions that lead to optimal performance must still be inve-stigated. The reason is that the significance of the individual acceleration mechanism in the system is not sufficiently understood and may change with operating conditions. Moreover, the same study relative to AF-MPD thru-sters can show different results and conclusions because of discrepancies in optimization hypothesis and the absence of a relevant design and operating standard. The development of this type of thrusters started almost forty years ago, but they have not been put in operation yet because of the lack of missions, appropriate power available in space and qualification. Future generations of satellites are capable to provide electric power of 10 kW or more, so that power for the propulsion system is available in periods when this power is not used by the payload. Their main application fields can be summarized as follows:
- Spiralling-up missions for geosynchronous Earth orbit (GEO) satellites
- North-south-stationkeeping
- Drag compensation
38 CHAPTER 3. MAGNETOPLASMADYNAMIC THRUSTER
3.4.1
Ground test facility problematic
The main goal of AF-MPD laboratory tests is to quantify the specific impulse and the efficiency of the thruster. Better results would be obtainable by operating the thruster in space. It has been shown that these thrusters cannot be operated realistically in the laboratory, mainly because of the low ambient pressure needed to exclude unknown environmental interaction with the plume. Low pressures in test facilities are feasible only if the thruster works continuously at high power levels. The lower the back pressure, the farther out the forces act. This phenomenon is more relevant in vacuum tanks because of the limited geometry and effective pumping capacity. Background pressure degrades thrust by interfering with the acceleration mechanism, and the background gas is entrained in the discharge to be accelerated with the propellant.
3.4.2
IRS AF-MPD thruster geometry
The IRS AF-MPD thruster laboratory model has been designed following the main design criteria of the DFVLR-X16 which was the best AF-MPD thruster for noble gases tested up to today in Germany. The main criteria taken into account has been the radiation-cooled design, which simplifies the design and allows further development of the thruster with regard to a flight model. The thruster shown in Fig. 3.6, is 355 mm long and has an outer anode diameter of 40 mm. It has two independent gas inlets: one through a hollow cathode and one through an annular gap near the anode. The depletion of density and charge carriers in the anode zone shall be prevented by the gas feeding near the anode. In this way, instabilities could be reduced and efficiency could be improved [2]. The modular design of the thruster
3.4. The AF-MPD laboratory thruster at IRS 39
allows changes in electrodes geometry and magnetic field configuration as a consequence of numerical and experimental results. The assembly of the thruster is flexible. It is possible to find an optimized thruster configuration by varying the distance between the cathode tip and the anode exit plane, and the distance between the neutral linear exit plane and the anode exit plane. The layout of the coil, which will be used for creating the applied magnetic field for the experimental investigations, is only limited by the outer diameter of the radiation shield.
40 CHAPTER 3. MAGNETOPLASMADYNAMIC THRUSTER Figure 3.6: Design of the AF-MPD lab oratory thruster without magnet coil.
Chapter 4
Ground test-facility design
In this chapter a description of the work done to prepare the thrust balance for the AF-MPD thrust measurements and the coordinate table for probes positioning is given. The last section describes all devices and instruments of the vacuum chamber number 8 of the IRS plasma laboratory.
4.1
The thrust balance
The thrust balance is a mechanical system by which the propulsive force of a thruster can be measured. The explanation of its general working principle can be provided assuming the thruster frame to work like the pendulum shown in Fig. 4.1. The upper side of the parallelogram corresponds to the main frame of the tank, while the lower parallelogram side represents the thruster frame. The thrust balance is displaced by the propulsive force of the thruster. The force necessary to keep the parallelogram motionless is assumed to be the measured thrust.
42 CHAPTER 4. GROUND TEST-FACILITY DESIGN
Figure 4.1: Thrust balance working principle.
4.1.1
Thrust balance old design
The thrust balance of the vacuum chamber number 8 of the IRS plasma laboratory was not use for fifteen years. The last experiments made in this tank concerned high power Arcjet (up to 100 kW), performing thrusts of some Newton (3 N ÷ 10 N). The old configuration of the thrust balance, shown in Fig. 4.2 could be considered in principle an upgraded design of a previous one, which was successfully used at the IRS for MPD and Arcjet performance measurements.
The moveable part of the balance carrying the thruster is suspended on three swing arms. Each swing arm is supported by two knife edge bearings. The force of the thruster is transmitted as a tension force via a stainless steel wire over a reversing sheave to a measuring box containing the force transducer. The measuring box is mounted on the outer frame. In order to allow the calibration of the balance during vacuum conditions (closed tank), a remotely operated weight lever will be installed.
This lever places a weight on a scale which creates a defined force on the platform.
4.1. The thrust balance 43
Figure 4.2: The old thrust balance configuration.
The electric power is fed to the thruster with as low a resistance as possible by two metallic copper rods which are submerged in mercury filled tubes. They can float inside the mercury pots making it into a sort a damping system for the thrust balance. To avoid evaporation of the mercury, the surface is sealed with silicon oil. The balance can be remotely locked to avoid damage in case of strong vibrations. Heat protection is achieved by a cold plate surrounding the thruster and dividing the tank into hot/cold regions.
4.1.2
Thrust balance new design
The old thrust balance had to be modified in order to experiment the 12 kW power IRS laboratory AF-MPD. Initially it was necessary to understand which components of the old thrust balance could be reused and which part had to be re-designed. This evaluation was made while trying to maintain some important advantages that the old balance design was already able to
44 CHAPTER 4. GROUND TEST-FACILITY DESIGN
guarantee, such as:
• simplification for diagnostics (the thruster does not move because it is
fixed on the balance),
• the minimum experimental risk provided by the design,
• high accuracy (calibration directly before and after each experiment).
The new thrust balance must be designed to measure thrust up to 1N with an accuracy of 5%. It must be possible to re-use the old thrust balance components which can be integrated in the new configuration satisfying the design requirements. The following section will describe the design proce-dure. First it was necessary a thermal control on the balance frame in order to understand which force sensor could be chosen; secondly a calculation re-lative to the balance stiffness was presented. This evaluation was been done to establish wether the old main balance structure and in particular the old swing arms could be reused. Then, a description of the calibration system new design is given and finally the new thrust balance configuration is shown. The calibration procedure which allows a better understanding of the wor-king principle of the thrust balance is described in Chapter 5. The balance structure is a double pendulum, more stable than a single one as it is not sensitive to the shift of the gravity center. Other components which could be reused in the new thrust balance design are the mercury rods, which just needed to be maintained after a long period of inactivity, the thermal shield and the lifting device.
4.1. The thrust balance 45
4.1.3
Thermal control
A thermal control on the thrust balance is necessary because the force sensor for thrust measurement must be chosen on the basis of the temperature rea-ched on the frame behind the thermal shield. In the following calculation the radiation heating of the plasma power, extended to the thermal shield and the power transmitted by conduction to the thrust balance are considered. The theoretic efficiency of the thruster is around 38% and is given by:
η = Pt Pin (4.1) Pt= T2 2 · ˙m (4.2) Pin = Pt+ PF F + Pdep (4.3)
Where Pt is the thrust power, PF F is the frozen flow power caused by the
enthalpy drop and Pdepthe power loss through the electrodes. With reference
to the performance values of table 1.1 the thrust power Pt is 4560 W, while
the other power components, in first approximation by Tikonov theory [17]
are estimated to be PF F=4560 W and Pdep=2880 W.
Radiation heating
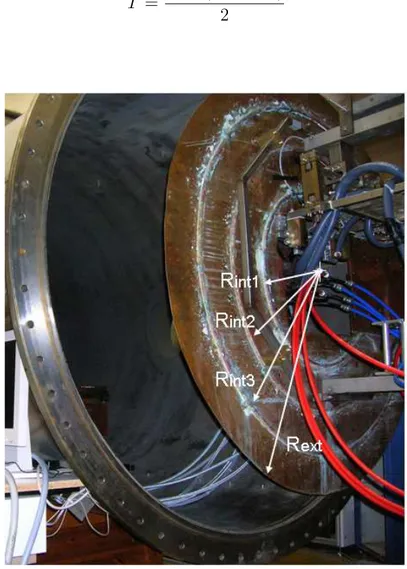
The thermal shield of the vacuum chamber is composed of a 1.9 meter large circular thin surface of copper which is cooled by three coaxial pipes, (see
Fig 4.3). The cooling system works with low pressure water (pmax of 5 bar)
and a maximal temperature Tmax of 50oC.
By assuming a one-dimensional duct flow model, the the mass flow rate necessary to cool down the pipe, (in this case the heating power is associated at the plasma power), is:
˙
m = Q˙
∆T · cp
46 CHAPTER 4. GROUND TEST-FACILITY DESIGN
where cp is the specific heat capacity at constant pressure of water at the
average work temperature of:
T = T0+ (T0 + ∆T )
2 (4.5)
Figure 4.3: The thermal shield.
The relative flow velocity, assuming a constant mass flow rate is:
w = m˙ Apipe· ρwater
4.1. The thrust balance 47
with Apipe the pipe cross section. Now it is possible to calculate the
pres-sure loss inside the pipe and compare it with the higher pumping prespres-sure. Reynolds number for a circular cross section is:
Re=
w · dint
ν (4.7)
where ν is the kinematic viscosity of water at the work temperature. In this
case Re is higher than 3000 and the flow can be considered turbulent using
Blasius law. The load loss coefficient ξ determines the pressure drop:
ξ = 0, 316√4 Re (4.8) ∆p = ξ · Lpipe dint · w 2 2 · ρwater (4.9)
The thermal shield can dissipate a power of 7.5 kW. The following table 4.5 shows thermal shield characteristics.
Thermal shield characteristics
dint 5 mm Lpipe 9.82 m dext 7 mm m˙ 0.0938 kg/s Rint1 300 mm v 4.82 m/s Rint2 500 mm Re 41039 Rint3 700 mm ∆p 4.9 bar Rext 900 mm Qdis 7.5 kW
48 CHAPTER 4. GROUND TEST-FACILITY DESIGN
Conduction heating
In first approximation it is possible to consider the frozen flow of power as responsible for conducting heating through the thruster support and towards the thrust balance frame. The power diffusion is determined by the Fourier law:
~˙q = −k · ~∇T (4.10)
The problem is simplified if for each material the same conductive cross section is taken. The equilibrium temperature on the inlet cylindrical wall of the thruster is given by the equilibrium between the radiation heating by
the PF F and the absorbed heating from the cathode:
PF F
A = α · σ · T
4 (4.11)
In this equation A is the cylindrical surface inside the cathode (30 mm diameter), α is the absorptivity of the specific material (0.05 for TZM) and σ is the Stefan-Boltzmann constant, 5.67 · 108 W/moK.
As shown in Fig. 4.4, the problem can be solved by electrical analogy to compute the heating resistance, in cylindrical coordinate, inside the thruster.
˙q · Req = ∆T (4.12)
Req= ΣRi (4.13)
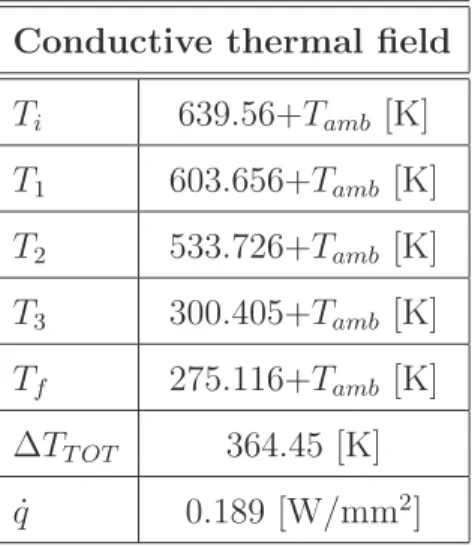
The following table summarises the temperature reached in every part pre-viously analyzed. From the results, it is clear that the temperature increase on the balance frame is very low. If compared with the ambient pressure
4.1. The thrust balance 49
it is negligible, so that the force sensor can be chosen without particular restriction on temperature.
Figure 4.4: Conduction heating model.
Conductive thermal field
Ti 639.56+Tamb [K] T1 603.656+Tamb [K] T2 533.726+Tamb [K] T3 300.405+Tamb [K] Tf 275.116+Tamb [K] ∆TT OT 364.45 [K] ˙q 0.189 [W/mm2]
Table 4.2: Temperatures and heating flow transmitted by conduction in the thrust balance
50 CHAPTER 4. GROUND TEST-FACILITY DESIGN
4.1.4
The force sensor
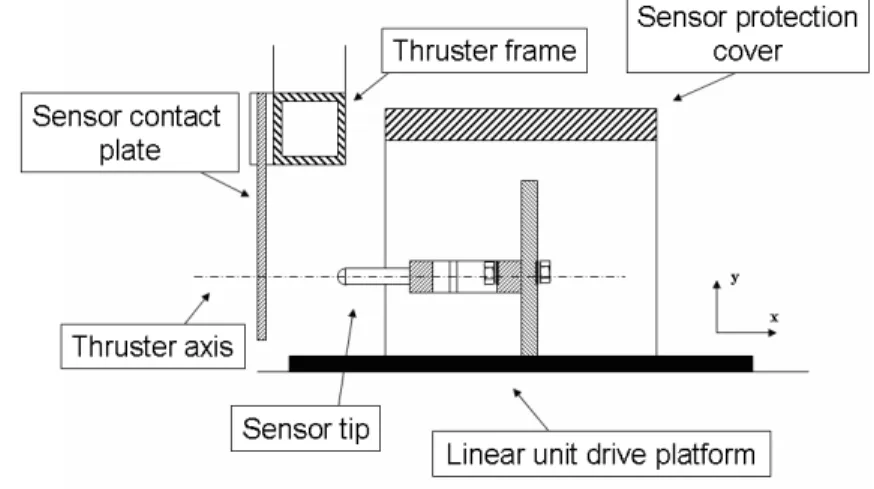
For the thrust measurement, a sensor which gives a signal proportional to the deflection along its symmetry axis was chosen. As shown in Fig. 4.6, it has the geometry of a miniature load cell and the force transmission is displaced parallel under loading. It is designed as a multi-range sensor with an accuracy of 0.1% which is already reached at a nominal output of 0.5 mV · V −1.
Figure 4.5: The sensor system.
That is very important considering that the thrust expected to be mea-sured is around a few hundred mN. Its tip has a cylindrical geometry and it is positioned so that its axis is coincident with the symmetry axis of the thruster. The sensor is screwed on the linear unit and covered with a box protecting it from accidental manoeuvres as long as it is not moved forward to touch the thrust balance. The sensor plate is electrically insulated from the thrust balance with two thin plates of Teflon and connected with the sensor with an electric circuit, (see Fig 4.5). When there is contact between the sensor and the plate, the circuit is closed and a light at the control unit indicates the contact. Then, it is possible to measure a force which is
equi-4.1. The thrust balance 51
valent to the reset force necessary to prevent displacements of the thrust balance caused by the thrust or by the calibration force. The load cell has a total accuracy of 0.1% (non-linearity, hysteresis and non-repeatability).
Figure 4.6: Load cell specifications.
The maximal error for the expected thrust of 250 mN is equal to the 2% of the propulsive force.
52 CHAPTER 4. GROUND TEST-FACILITY DESIGN
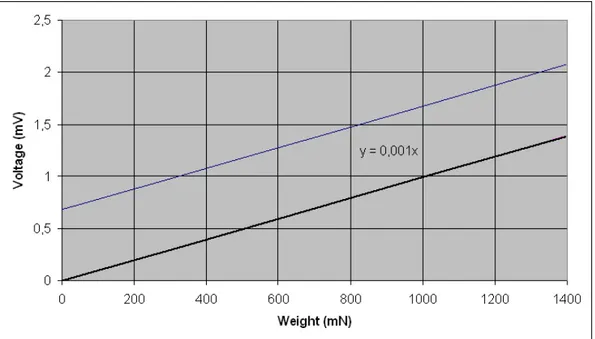
The conversion factor mV to mN is obtainable from the diagram below which has been plotted after the force sensor stand test.
Figure 4.7: Load cell calibration stand test.
ε%max = εmax Fthrust
= 5[mN ]
4.1. The thrust balance 53
4.1.5
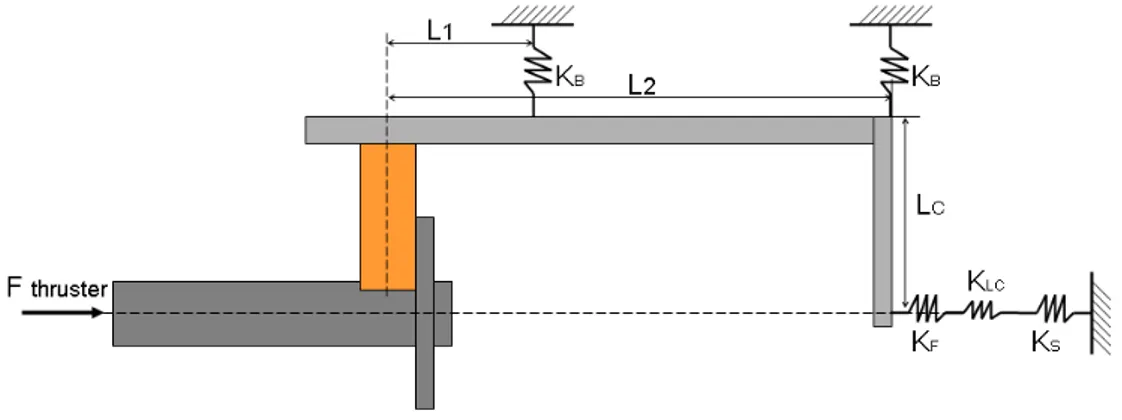
Stiffness analysis
Fig. 4.8 shows the thrust balance scheme with the stiffness of the compo-nents. In first approximation it is possible to assume the load cell working
like a high stiffness axial spring KLC. The frame and the sensor tip are not
perfectly rigid and for this reason their stiffness must be considered as KS
and KF.
Figure 4.8: Thrust balance scheme for stiffness calculation.
The thrust balance frame is supported by three rigid swing arms (two in the front side to avoid a momentum on the frame around the thruster symmetry axis and one in the back). The following procedure concerns the calculation of the stiffness for every thrust balance components. The overall system stiffness is given by the following equation:
KT OT = KLCeq+ 3 · KB (4.16)
In this case the four stiffnesses are in parallel and the stiffness load cell coefficient is: 1 KLCeq = 1 KF + 1 KLC + 1 KS (4.17)