Review Article
Potentiostats for Protein Biosensing: Design Considerations and
Analysis on Measurement Characteristics
Saad Abdullah
, Sarah Tonello
, Michela Borghetti
, Emilio Sardini
,
and Mauro Serpelloni
Università degli Studi di Brescia, Dipartimento di Ingegneria dell’Informazione, Via Branze 38, 25123 Brescia, Italy
Correspondence should be addressed to Mauro Serpelloni; [email protected] Received 29 November 2018; Accepted 14 February 2019; Published 17 March 2019 Academic Editor: Bruno C. Janegitz
Copyright © 2019 Saad Abdullah et al. This is an open access article distributed under the Creative Commons Attribution License, which permits unrestricted use, distribution, and reproduction in any medium, provided the original work is properly cited. The demand for the development of swift, simple, and ultrasensitive biosensors has been increasing after the introduction of innovative approaches such as bioelectronics, nanotechnology, and electrochemistry. The possibility to correlate changes in electrical parameters with the concentration of protein biomarkers in biological samples is appealing to improve sensitivity, reliability, and repeatability of the biochemical assays currently available for protein investigation. Potentiostats are the required instruments to ensure the proper cell conditioning and signal processing in accurate electrochemical biosensing applications. In
this light, this review is aimed at analyzing design considerations, electrical specifications, and measurement characteristics of
potentiostats, specifically customized for protein detection. This review demonstrates how a proper potentiostat for protein
quantification should be able to supply voltages in a range between few mV to few V, with high resolution in terms of readable
current (in the order of 100 pA). To ensure a reliable quantification of clinically relevant protein concentrations (>1 ng/mL), the
accuracy of the measurement (<1%) is significant and it can be ensured with proper digital-to-analog (10-16 bits) and
analog-to-digital (10-24 bits) converters. Furthermore, the miniaturisation of electrochemical systems represents a key step toward portable, real-time, and fast point-of-care applications. This review is meant to serve as a guide for the design of customized potentiostats capable of a more proper and enhanced conditioning of electrochemical biosensors for protein detection.
1. Introduction
An increasingly investigated aspect in the research field of pharmaceutics, biotechnology, and diagnostic is represented by the development of low-cost devices which could give a fast, reliable, noninvasive feedback on physiological and biological processes [1].
Most of the techniques available in biotechnology labo-ratories for biomolecule investigation are mostly expensive, time-consuming, and highly operator-dependent. More-over, they are often harmful for the samples and able to give only qualitative or semiquantitative feedbacks rather than sensitive and precise measurements. In this picture, the development of electrochemical sensing devices for the detection and investigation of biomolecules including metabolites, nucleic acids, and proteins plays an important role in medical diagnostics [2–4]. High selectivity, sensitivity,
standardization, and low limit of detection (LOD) represent the key points required in order to compete with the standard biochemical assays. These aspects are primarily influenced by the choice of materials and geometries for biosensor produc-tion and of biomolecules and nanomaterials adopted for the biofunctionalization (e.g., aptamers, antibodies, and coated nanoparticles) [5]. However, in addition to those, the elec-tronic circuit for biosensor conditioning, signal acquisition, and transmission contributes strongly in enhancing the per-formances of the assay [6]. Thus, the possibility to design a circuit able to specifically select the proper electrochemical methods and to enhance the small currents from redox reac-tions represents a powerful tool to improve the performances of standard biochemical assays [7].
The instrumentation for electrochemical biosensors can be divided in four functional blocks, including signal pro-cessing, readout circuit, potentiostat, and signal generator
[8, 9]. Among these, potentiostat represents the core unit of the acquisition system, which significantly influences the sensitivity of the overall measurement [10, 11]. It functions by regulating the potential difference between reference electrode (RE) and working electrode (WE). Additionally, a potentiostat also measures theflow of current between WE and an auxiliary electrode, usually referred to as counter electrode (CE) [12], due to a redox reaction in the biological fluid which induces the movement of charges [13, 14]. As discussed in detail in the literature [15], the use of three electrodes is required to have a precise control of the poten-tial across the working electrode since the reference elec-trode has a stable and well-known elecelec-trode potential and it is used as a point of reference in the electrochemical cell for the potential control and measurement. Despite this common general operating principle, when dealing with biosensing applications, the design of a sensitive and accu-rate potentiostat is necessarily related to the specific analyte, the electrochemical method, and the overall requirements needed for each specific biosensing application. Primarily, potentiostats are used to detect or measure specific analytes such as metabolites (glucose, cholesterol, and lactate), ions (K+, Na+, and Ca2+), and metals (zinc, lead) in biological fluids [16–18]. An accurate detection of these metabolites or ions facilitates in the diagnosis and control or treatment of various diseases, for instance, diabetes, acute heart dis-eases, hypoxia, coronary heart disease, myocardial infarction, and hypertension [19]. Furthermore, another significant target is represented by proteins, due to their fundamental role as a primary link between information processes and replication at the genetic level [20]. Understanding the pro-tein’s action may help in investigating the state of different diseases [21]. The ability to detect protein biomarkers when still present in very low concentrations (pg/mL) might repre-sent a powerful tool for early detection and prevention of the onset of various pathologies. In this light, researchers are increasingly exploring the advancement in the design of biosensors with a properly integrated customized condition-ing circuit for achievcondition-ing higher sensitivity, reliability, and standardization of protein quantification.
Figure 1 shows the increasing trend of using poten-tiostat for biosensing over the course of 18 years; the trend is obtained through Scopus using specific keywords “voltammetry” and “protein detection.”
The specific focus of this review is the analysis of design considerations, electrical specifications, and measurement characteristics of potentiostats specifically customized for protein detection. After a brief overview of the main poten-tiostat operational modes, a comprehensive and updated review of the most relevant and promising potentiostat designs for protein investigation will be given. In addition, the portability and figure of merit of the potentiostats specifically designed for each category application will be deeply discussed.
1.1. Potentiostat Operational Modes. The different techniques available for measuring the response or characterising bio-sensors possibly addressed to protein investigation can be classified in three main operational modes: voltammetric/
amperometric, impedimetric and potentiometric, with DC voltages, DC currents, and AC signals as respective responses.
1.2. Amperometric Protein Detection. The term “ampero-metric” comprehends all electrochemical techniques mea-suring the current as a function of an independent variable that is, typically, time or electrode potential [15]. Thus, subclasses of amperometry are usually considered chron-oamperometry (CA), including experiments carried out at fixed electrode potential, and voltammetry, including all the methods that measure a current by varying the potential applied to the electrode [22]. Figure 2 presents the general schematic representation of the amperometric technique. An input signal is applied at OP1 which is a control amplifier and receives a negative feedback from the reference electrode to maintain the output; the working electrode is connected to the transimpedance amplifier which serves as a current-voltage converter. The plot of the output current versus the applied potential is termed as voltammogram as shown in Figure 3. According to the waveform of the potential, the most frequently adopted voltammetric techniques are cyclic voltammetry (CV) (triangular waveform), linear sweep voltammetry (LSV) (ramp), and squarewave voltammetry (SWV) (multistep) [23–25]. Thus, a potentiostat in ampero-metric mode should be able to control the potential between WE and RE, according to a desired waveform, and detect electrons moved from the electrode to the analyte or from the analyte to the electrode as a current flowing between WE and CE [13, 23, 24]. Thus, current flowing between WE and CE due to analyte reduction/oxidation at metal elec-trodes will be influenced by the potential applied, by analyte properties, and by its concentration. Among the techniques introduced, CV and LSV are the most commonly used to characterize biosensor active areas and to evaluate the oxida-tion and reducoxida-tion processes of proteins by means of direct electrochemistry or enzyme-mediated approaches [25]. The potential-current curve (named voltammogram) obtained in CV and LSV correlates the protein concentration with the height of specific oxidation and/or reduction peaks against the applied voltage [22]. The main issues encountered
0 20 40 60 80 100 120 140 160 180 2000 2005 2010 2015 Documents Year
Figure 1: Number of documents published on the titled subject over the years.
with CV are represented by the high background current and by interfering peaks due to the impurity of the solution used for voltammetry. Also in some cases, there exists DC current noise in the circuits due to improper use of the decoupling capacitor (Figure 3) [26]. Other techniques as SWV and CA are often considered as alternatives to CV. Thanks to the minimal contributions from nonfaradaic currents, SWV is considered to enhance the sensitivity and suppress back-ground currents much more effectively than CV. Further-more, CA, more often used in enzyme-mediated assays, is considered to give a better signal-to-noise ratio in
comparison to other amperometric techniques [27]. In this light, it emerges that a performing potentiostat should be able to control the potential on the CE with a high accuracy in order to avoid the signal from interfering species and to amplify the current from redox reaction with a high gain, high sensitivity, and reliability, in order to maximize the signal-to-noise ratio and provide reliable calibration curves.
Those aspects have been addressed in terms of potentiostat design considerations in several works, with very different approaches. An interesting portable ampero-metric electrochemical potentiostat circuit was proposed by Loncaric et al. [28]. The overall setup of the electrochemical cell was designed (Figure 4) in order to ensure the portability of the device. The DAC receives its input from the microcon-troller unit and gives its output to the buffering unit, repre-sented by opamp 1 (Figure 5). The peak current measured by the proposed potentiostat differs by ±5% from the one measured by a conventional benchtop potentiostat. The accuracy of the system could be increased by using an external higher-bit ADC in addition to the current-to-voltage converter. Additionally, the potentiostat includes the operational amplifiers 2 and 3, whereas the circuit of opamp 4 serves as a current-to-voltage converter. Loncaric et al. designed the USB-powered potentiostat circuit which is governed by an Arduino microcontroller (Arduino Duemilanove), able to generate the ramp signal within the range of -2.5 V to +2.5 V and scan rate of 10 mV/s to 50 mV/s. To indicate the initial point of detection, cyclic volt-ammetry measurements were done at a scan rate of 500 mV/s with lysozyme concentrations from 0.5μg/mL to 5 μg/mL. The cyclic voltammetry curves reported the stripping voltage - 0.4 V and cathodic peak 7.4 nA. The results suggest that this potentiostat can detect even low concentrations (0.5μg/mL) of the lysozyme, indicating that it performs as well as a standard electrochemical setup.
Another similar example can be found in Muid et al. [29]. Authors designed a low-cost potentiostat by focusing on its conditioning circuit. The schematic of the electrochemical
WE RE CE Vout Current to voltage converter − + − + Signalgenerator I/V converter Control amplifier OP1
Figure 2: Schematic representation of amperometric protein detection where OP1 is a control amplifier.
Epa Epc Cathodic ipa ipc 0 Current ( 𝜇 A) −100 0 200 400 Potential (V vs. Ag/AgCl) 600 Anodic
Figure 3: Typical voltammogram where ipa and ipc represent,
respectively, anodic and cathodic peak current, Epa and Epc
represent, respectively, anodic and cathodic peak current, andEpc
system is similar to [28] but powered by RS-323. This study [29] did not investigate the detection of any particular pro-tein; rather, it is focused on the designing of the potentiostat system (Figure 6). Muid used the ATxmega32 microcontrol-ler, which contains an internal DAC for the generation of waveforms with a sampling rate of 1 Ms/s and an internal ADC with a resolution of 12 bits and sample rate up to 2 MS/s. The analog control circuit for the potentiostat used opamps characterized with small output current and low input impedance. The conditioning circuits amplify the applied voltages ranging from +10.42 mV to -10.42 mV. The output from the DAC is applied to the sample through the analog circuit. At the readout circuit, the measured cur-rent is converted into a digital signal through ADC and saved in RAM. The range of the measured potential is ±1.6 V at frequencies ranging from 1 Hz to 1 kHz. CV, SWV, and LSV were applied to check the performances of the developed potentiostat, obtaining the minimum error of 0.5%. The
USB
connector-power supply and data transfer
Microcontroller Test solution WE RE CE Potentiometers to vary applied voltage and scan rate
System is powered entirely by USB -no battery required
Vinitial Vpeak Rate
Figure 4: Portable design of a USB-powered electrochemical biosensor. Reprinted from [28].
+ + + − − + Digital-to-analog converter Op amp1 A R2 R3 C 1 B Op amp2 Op amp4 To PC via USB 68K 100k P4 C5 WE RE 10k R7 10k R12 27k R11 27k R10 27k R9 20k d1 Vcc R13 27k R8 CE VirF10 microcontroller Vcc Op amp 3 Op amp 5 Op amp 6
Sub circuit to distinguish actual Vcc 0.1𝜇F 68K Input from microcontroller D A C
Figure 5: Analog circuitry of the potentiostat. Reprinted from [28].
LCD keypad Computer OP-amp circuit 3-electrode electrochemical cell DAC ADC Power supply Microcontroller ATXMEGA 32
Figure 6: Block diagram of the proposed potentiostat. Recreated from [29].
overall design and performance of [29] made it eligible to be used for protein biosensing in an amperometric mode.
Similar to [28], Kellner et al. [30], and Kwakye and Baeumner [31], Molinari et al. [32] also investigate the efficiency of a portable immunobiosensor designed for detection of β-casein (food allergen). Since the maximum threshold concentration of allowed allergens in the food is 10 mg/L, detection of β-casein was optimised within the range of 0-10 mg/L. For the amperometric detection of bonded β-casein, an appropriate redox mediator and hydrogen peroxide are added at an electrode. The voltage of WE was fixed at -0.28 V, and the resulting measured current, inversely proportional to theβ-casein concentration (Figure 7(b)), was in the range between 0.72μA and 2 μA. Its sensitivity, together with portability and Bluetooth connec-tivity, makes this device appealing in comparison to other commercial methods.
Likewise, Dryden and Wheeler [33] also developed a portable, open-source potentiostat (DStat) specifically for high-performance voltammetric and amperometric mea-surements in research laboratories. In contrast to commercial potentiostats, its open nature, adaptation to experiments, and modifiable operations make it more attractive. The
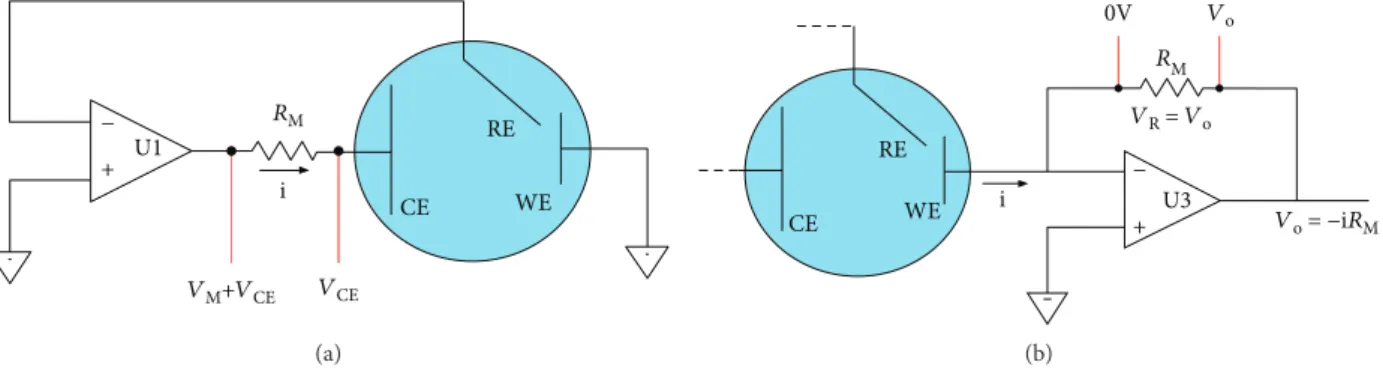
potentiostat is powered and controlled via a USB connec-tion allowing portability. Though the ATxmega256A3U microcontroller has an in-built 12-bit DAC, an external 16-bit DAC is employed to reduce the quantization error. DStat measures the current by means of a transimpedance amplifier circuit in series with the WE (Figure 8(b)) rather than using a shunt resistor RM (Figure 8(a)). The conver-sion of the WE electrode current into voltage is performed by a 24-bit ADC. The microcontroller updates the DAC, collects data from 24-bit ADC, and sends them to a com-puter for analysis and storage. To test the performance of the potentiostat, 10 mM potassium hexacyanoferrate(III) and 4-aminophenol solutions were used. As presented in Figure 9, DStat gave smooth responses without noise distor-tion for potassium hexacyanoferrate(III) measurements in contrast to other commercial potentiostats. Moreover, differ-ential pulse voltammetry measurements (Figure 9(b)) depicted the capability of DStat to measure low-output cur-rents. Being an open-source potentiostat, the electronic hard-ware and softhard-ware both are completely accessible, improving theflexibility and scope of usage.
Sun et al. [34] designed a multifunctional recon figur-able electrochemical cell that can be toggled between
(a) i ( 𝜇 A) 𝛽-Casein (ppm) 0.5 0.5 1.5 0 5 10 15 20 (b)
Figure 7: (a) Current vs. time curve. (b) Current measurement with respect to β-casein concentration. Reprinted from [32].
− + U1 RM RE CE WE i VM+VCE VCE (a) RE 0V Vo RM − + U3 VR = Vo Vo = −iRM WE i CE (b)
Figure 8: Cell I-to-V conversion for ADC. (a) Current measurement through shunt resistance. (b) Current measurement by using a
amperometric, potentiometric, and impedimetric modes. The general components of the potentiostat are the same, including 14-bit DAC and 16-bit ADC (Figure 10). Focusing on the amperometric mode, the evaluation was performed by using lactoferrin as the target molecule.
The application of -0.2 V to 0.3 V with the 25 mV/s scan rate can detect LTF in biological fluids. The measurement range of this potentiostat is ±1 nA to ±200μA, and the approximate resultant current of this test ranges from 40μA to 150 μA. 20 10 0 C ur ren t ( 𝜇 A) −10 −20 −200 −100 0 100 200 300 400 500 120 100 80 60 40 20 0 C ur ren t ( 𝜇 A) 500 400 300 200 Voltage (mV) Voltage (mV) 100 0 −100 DStat EmStat ChcapStat (a) 20 10 −10 0 C ur ren t (nA) 100 𝜇M 50 𝜇M 25 𝜇M 10 𝜇M 100 50 0 −50 Voltage (mV) −100 −150 20 30 10 −10 0 C ur ren t (nA) 100 𝜇M 50 𝜇M 25 𝜇M 10 𝜇M 100 50 0 −50 Voltage (mV) −100 −150 (b)
Figure 9: Voltammetric measurement comparison. (a) Cyclic voltammetry (left) and squarewave voltammetry (right) of potassium
hexacyanoferrate (III). (b) Differential pulse voltammetry of 4-aminophenol, DStat (left), and EmStat (right). Reprinted from [33].
VADC3 VCM VIN VADC4 ZKno w n VADC2 VWE2 VWE1 ISig + ILeak VADC1 + − + − + − + − + − + −
For the detection of biomarkers through the voltam-metric technique, Cruz et al. [19] used a novel approach to design a potentiostat by using a miniaturized chip LMP91000. The readout circuit measures the current at the output stage via a transimpedance amplifier and converts it into a proportional voltage. This acquisition of the poten-tiostat signal is transmitted to the built-in ADC161S626 (16-bit), embedded on the LMP chip (Figure 11). The potentiostat exhibits low detection limit and high sensitivity for cortisol detection, suggesting that this can be used for detection of other biomarkers at point of care (POC).
Ghoreishizadeh et al. [35], Ainla et al. [36], Giordano et al. [37], and Steinberg et al. [38] developed a wireless method of data acquisition and support miniaturisation of the biosensing platform by designing an amperometric potentiostat with a readout circuit to measure the differential current. Ghoreishizadeh et al. [35] used an off-chip micro-controller which generates different profile voltages for the excitation of the potentiostat by means of a 10-bit DAC (Figure 12). The output received at WE goes through a programmable gain amplifier to reach a 10-bit ADC. The maximum measurable output current of this potentiostat is 20μA, whereas the minimum detectable change is 0.47 pA.
Medina-Sánchez et al. [39] used on-chip magnetic beads as a preconcentration platform and linked it with the quantum dots for efficient and sensitive detection of
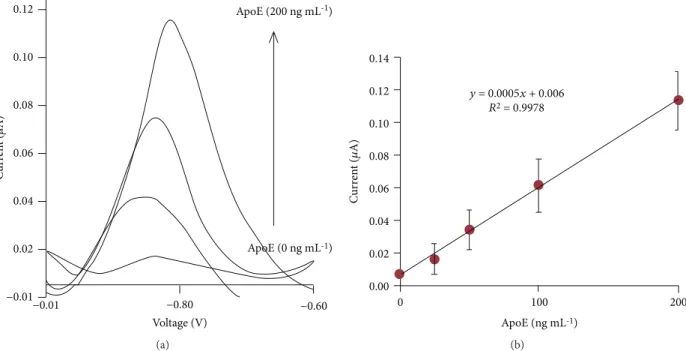
apolipoprotein E (ApoE). The technology used for electro-chemical detection of ApoE is SWV. The results showed a stripping peak at -0.85 V with frequency 25 Hz and 0.11μA current (Figure 13). The potentiostat detects the ApoE pro-tein linearly from 10 ng m/L to 200 ng m/L concentrations.
From a critical evaluation of the research papers pre-sented, it appears clearly that measurement performance of the potentiostat is mainly affected by the selection of opamps. In response to the applied voltage, the biosensing system produces a small amount of current, thus requiring an opamp with low-input bias currents. Afterwards, this resul-tant signal serves as the input to the ADC; hence, amplifica-tion of the signal must be ensured to make the current on order of microamperes producing a full-scale signal on the ADC. Enzyme-based amperometric biosensors are subjected to reduction in signal due to interference from chemicals in the sample.
1.3. Impedimetric Protein Detection. In impedimetric mode, a biosensor detects the change in resistance and/or capacitance that occurs during detection events [40, 41]. At equilib-rium, the electrolyte-electrode’s electrical impedance (AC) is measured by these biosensors. In addition, an impedi-metric mode is obtained by applying a sinusoidal stimulus current/voltage with a frequency that varies over time and thus by measuring the resultant voltage/current, whose 12C BUS SPI BUS Cortisol sample Buffer Fluid valve control Waste Assay chamber IDE/Cr/Si C ur ren t (A) Potential (V) CE WE WE PE 10 𝜇m 10 𝜇m Anti-M-CabCortisol
SAM head group
SAM functional group
amplitude and phase change provide information related to target molecules. Figure 14 shows the block diagram repre-sentation of impedimetric mode for protein detection. A sinusoidal input is generated at CE from a variable frequency generator with an exciting signal within the range of 10 mV; this signal passes through the biosensor chip containing the protein sample, and the resulting signal is acquired by a frequency analyzer/impedance measurement device [42]. This technology is commonly regarded as electrochemical impedance spectroscopy (EIS), most frequently used for monitoring cell cultures but also applicable to the detection of molecules [43], proteins, and enzymes [44]. In EIS, the impedance behaviour of the investigated solution can be described by the combination of the capacitance, the ohmic resistance, the constant-phase element, and the Warburg impedance. When the electrodes are in contact with an
C ur ren t ( 𝜇 A) 0.12 0.10 0.08 0.06 0.04 0.02 −0.01 −0.01 −0.80 Voltage (V) ApoE (200 ng mL-1) ApoE (0 ng mL-1) −0.60 (a) 0.14 y = 0.0005x + 0.006 R2 = 0.9978 0.12 0.10 0.08 C ur ren t ( 𝜇 A) 0.06 0.04 0.02 0.00 0 100 ApoE (ng mL-1) 200 (b)
Figure 13: (a) Apo-E magnetoimmunoassay performance. (b) Calibration curve of ApoE. Reprinted from [39].
WE RE CE Variable frequency generator Frequency analyzer and impedance measurement Feedback
Figure 14: Block diagram representation of impedimetric protein detection.
DiRIC Clock phases
Differential readout Clock generator Test PCB Clock SPI SPI MCU ADC DAC Vout VRE RE WEs CE Readout − + Potentiostat Control bits M u lt ipl exe rs Off-die sensor On-die sensor Bluetooth
electrolyte, the impedance can be modelled by the Randles circuit, which consists of the solution resistance in series with the parallel combination of the double-layer capacitance and the charge transfer resistance in series with the Warburg impedance [42]. In impedimetric mode, impedance data are obtained at the output, and the Nyquist plot is the most con-ventional way of representing these data. In a Nyquist plot (Figure 15), the imaginary partZ″ ω is plotted against the real part Z′ ω to provide all the vital information related to electrode-electrolyte interference [45].
In contrast to amperometric and potentiometric biosen-sors, a significant benefit of impedimetric biosensors is represented by the small stimulus voltage (generally 5 to 10 mV) which does not disturb or damage the biorecognition layers. Additionally, the label-free nature of impedimetric biosensors provides measurements without the intervention of label molecules, simplifying the functionalization process [46, 47]. Impedance-based assays rely on the principle that when a biomolecule of interest interacts with the sensing sur-face, electrical properties of the surface changes as a result of the sole presence of the biomolecule of interest [48]. For this purpose, impedance biosensors are considered advantageous for detection of proteins, reducing the variability introduced by the multiple binding events in label-based assays [46]. However, when a strong selectivity is required, for example when multiple biomarkers need to be discriminated in the same solution, impedance-based detection shows limitations [45], since it is not intrinsically able to discriminate the increase in impedance due to different protein species.
In this light, an impedimetric potentiostat aiming at improving sensitivity should ensure (1) the possibility to eas-ily customize input frequency, (2) very high sensitivity to impedance changes, and (3)finally a proper compensation system to avoid drifting or instrumentation interference with the small changes introduced by biomolecules.
An innovative multifunctional miniature sensing system was designed by Pruna et al. [49] that allows the user to
choose between impedimetric, amperometric, and voltam-metric measurements. Two microcontrollers, PIC32 and PIC24, are used for waveform generation, data acquisition, and computer interface. Among these, PIC24 has a 16-bit ADC for data acquisition in biosensing applications in contrast to the 10-bit ADC of PIC32, whereas PIC24 has a 10-bit DAC also. Pruna tested the device for detec-tion of TNF-α at several concentrations (266 pg/mL to 666 ng/mL) with application of excitation voltage ±2.5 V and frequency 1-10 kHz. Results are obtained between 1 and 10 Hz where maximum impedance variation can be detected (Figure 16).
Since the full impedance spectrum is a time-consuming technique, Huang et al. [50] employed a potential step-based time domain impedance measurement. All the opera-tional amplifiers in the potentiostat have a bandwidth greater than 1 MHz. The I/V converter amplifier (AD8606) is the
0 Hig h freq uenc y L ow f req uenc y 500 0 −200 −200 −600 Z ″( 𝜔 ) ( 𝛺 ) Z′(𝜔) (𝛺) −800 −1000 1000 1500 2000 2500 3000 Rs 45º Rs+Rp
Figure 15: Typical Nyquist plot. Reprinted from [45].
4 2 0 0 4 8 Re(Z) (M𝛺) −lm( Z ) (M 𝛺 ) 12 After CMA Antibody 266 pg/mL 13 ng/mL 666 ng/mL
Figure 16: Nyquist plot for TNF-α detection at different concentrations. Reprinted from [49].
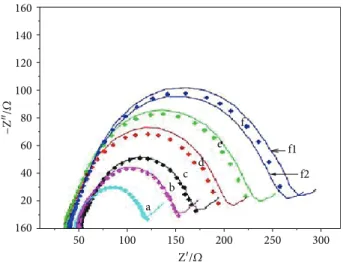
most demanding part of the potentiostat having gain in hundreds. Huang used the C8051F060 microcontroller, which has two in-built 16-bit ADCs, two 12-bit DACs, and a voltage reference. Experiments were carried out with E. coli, and impedance spectra were obtained by the potential step (STP) method and frequency response analyzer (FRA) method for comparison. For STP, the applied voltage is 10 mV in amplitude, 0.1 second in duration, with a 200 kS/s sampling rate, whereas FRA used the 5 mV AC potential. The impedance spectra acquired by both STP and FRA (Figures 17 and 18) demonstrate precise measurement due to the higher sampling rate. Comparison of the Nyquist diagrams suggests that the potential step-based impedance measurement technique is possible by using a low-cost portable instrument.
For EIS measurements, Ogurtsov et al. [51] designed a two-channel EIS system, consisting of a 16-bit DAC, signal generators, low-pass filters, instrumentation amplifiers, I/V converters, and the ATxmega128A1U microcontroller. For validation of the system, EIS measurements were conducted to measure the T-2 toxin concentration, over a frequency range of 10 Hz to 100 kHz, with an applied potential of 10 mV AC amplitude. The output voltage is amplified and demodulated in the I/Q demodulator to give imaginary and real impedance components. Performed calibration within the range 0-225 ppm showed that the developed biosensor could detect T2 toxin concentrations at the levels below 25 ppm. In impedimetric mode, the potentiostat proposed by Sun et al. [34] measured NeutrAvidin, a type of protein, by using the EIS method. Small sinusoidal voltages (0.2 V) were applied with a variable frequency of 1 Hz-10 kHz. The Nyquist plot (Figures 19 and 20) showed that the resultant impedance ranges from 50 MΩ to 10 MΩ, demonstrating that this potentiostat can be used as a label-free biosensor.
In addition to customized research potentiostats, several commercially designed potentiostats can also be found in the literature. Esfandyarpour et al. [52, 53] claimed to have designed an ultrasensitive biosensor that overcame the problem of current limitations by using the VersaSTAT3 potentiostat measuring biomolecular binding in real time. In addition, Bellagambi et al. [54] and Baraket et al. [55] used the VMP3 potentiostat to perform EIS measurement of mul-tiple biomarkers, investigating the selectivity and sensitivity of the device. The Nyquist plots demonstrate that impedance increases with a number of incubations due to adsorption and detection.
From the critical analysis of impedimetric potentiostat design, it arises that the main concerns are related to adequate bandwidth, drifting, and capability to identify phase changes between the applied voltage and the measured current. EIS circuitry requires a high enough bandwidth to detect the small currents at the output. However, higher fre-quencies are less affected by noise and drift inherent in the measurement electronics while several investigators reported impedance drift at frequencies of approximately 100 Hz and lower [45]. Moreover, any phase error introduced due to measurement circuit must be adjusted to ensure that the input signal is aligned with the output.
1.4. Potentiometric Protein Detection. In potentiostatic or potentiometric mode, the potentiostat measures the voltage difference between WE and RE in the absence of current flow between the electrodes, while controlling the potential of CE with respect to WE (Figure 21). The resulting potential differ-ence depends on the concentration of an analyte [13, 23]. Some potentiometric biosensors are known as redox-potential biosensors due to the involvement of redox reac-tions. In all cases, the potentiometric response is determined by ion conduction processes and ion exchange reactions at
STP-200K-0.1s STP-20K-1s STP-10K-2s STP-5K-4s STP-2K-10s FRA-CHI660 1 KHz 100 80 60 −Z″ /𝛺 Z′/𝛺 40 20 0 0 20 40 60 80 100 120 140 160 180 200 10 KHz 100 KHz 100 Hz 0.1 Hz 10 Hz 1 Hz
Figure 17: Impedance spectra obtained by the STP method with varied sampling rates and the FRA method (red line). Reprinted from [50]. f1 f e d c b a f2 Z′/𝛺 −Z ″/ 𝛺 160 140 120 100 80 60 40 20 160 50 100 150 200 250 300
Figure 18: Nyquist plots acquired by the STP method (solid diamond) and FRA method (solid line) (a), after epoxy silane
modification, (b) after antibody attachment, (c) and after E.
coli cells bonding with cell concentration of 1 × 10⁵ cfu/mL, (d) 1 × 10⁶ cfu/mL (e), and 1 × 10⁷ cfu/mL. (f) In the f data set, f1 and f2 denote that they are measured before and after STP measurement. Reprinted from [50].
the solution interface/membrane. Potentiometric biosensors can detect free ions and need frequent calibration.
From an analysis of the works addressing the design of potentiometric potentiostats in the recent literature, the main concerns are the input impedance and input bias current. The input impedance of such biosensors is very high, usually on the order of 100 MΩ, which demands high-resolution sampling of the electrode voltage usually in the range of 12 bits to 24 bits. A voltage follower circuit is generally used to (1) provide a high impedance interface, so the out-put signal can be isolated from the source signal effectively. In addition, the instrumentation amplifier is characterized by high noise elimination capability and the high common mode rejection ratio (CMRR) which is generally >80 dB [56]. Potentiometry requires the input bias of the measure-ment circuit to be very low to reduce the measuremeasure-ment error to less than 1%.
DStat potentiostat [33], in addition to its uses for amperometric applications, is also compatible with voltage-measurement application, such as potentiometry for both
pH and protein detection. In pertinent literature, only one of the lab-built systems had this capability; thus, it makes DStat for potentiometry attractive. Measurements of stan-dard pH calibrations were recorded and compared with the results acquired from an AR50 Benchtop pH meter to evaluate the potentiometric capabilities of DStat. The results of both the instruments were virtually similar as both exhibited the anticipated Nernstian response having a root mean square deviation from 2.3 mV and 1.9 mV for DStat and Benchtop, respectively. The higher sample rate of the DStat (30 kHz with respect to 1 Hz of AR50) ensures good temporal resolution.
Moreover, Huang et al. [57] also proposed a potentiomet-ric setup, similar to [58], but with a remote data transmission based on the GPRS communication system. The complete circuitry of the potentiostat consists of the conventional components: a DAC (12-bit), two ADC (12-bit), a micropro-cessor (AT89C51), a I/V converter, a low-passfilter, a voltage amplifier, and an RS-323 interface (Figure 22). The pro-grammable voltage ranges from 0 to 5 V with a resolution of 1 mV, while the range of measured current lies between 1μA and 1 mA. The microprocessor is responsible for the source/excitation signal, data acquisition, and con figura-tion management. ADC-1 measures the potential difference between working electrode and reference electrode. A voltage follower is connected to the ADC-1 to avoid loading effect. Based on the ADC-1 output, the microprocessor generates the corresponding control voltage to DAC. Hence, DAC produces a bias voltage to regulate the current injection into CE. In this feedback process, I/V measures the current of the biosensor between WE and CE through a resistor. To evalu-ate the function of the proposed potentiostat, the pH variation of a solution is measured and compared with a commercial potentiostat. The results acquired from the homemade potentiostat deviated by 1.82%, with respect to the ones from the commercial potentiostat, and this devia-tion could be considered negligible in several applicadevia-tions.
Similarly, Sun et al. [34] proposed a portable potentiostat (Figure 23), generalized for various proteins and other biomolecules, which can be integrated into wearable devices and smartphones. As mentioned earlier in Section 1.2, it is a reconfigurable device and can be converted into the VADC1 VADC3 VADC2 VWE2 VWE1 − + − + − + − + − VIN ZKno w n
Figure 19: Schematic of potentiostat in impedimetric mode. Reprinted from [34].
10 2 4 6 8 10 −I mag Z (k 𝛺 ) Real Z (k𝛺) 12 14 20 30 40 50 60 0 nM 10 nM 100 nM 1000 nM
potentiometric mode by repurposing the electrical compo-nents. The results of pH testing deviated only by 1.2% from the results of a standard test.
Similarly to the previously described works, a potentio-metric based on the design for biomolecule analysis, includ-ing proteins, is proposed by Ma et al. [59]. Battery-driven, low cost, portability, high performance, and low-power con-sumption are some of the significant features of the designed potentiostat. The potential difference or open-circuit poten-tial obtained from the electrodes went through amplification followed by filtration. Subsequently, the acquired analog signals were converted via a 12-bit ADC, so they can be transmitted to a PC by passing through MCU (MSP430f149) (Figure 24). The electrochemical analysis was performed to measure the urea concentration. The input potential ranges from -0.2 to 1 V, whereas the output voltage ranges from 0.06 to 9.11 V. The potential at the readout circuit increases as the urea concentration increases, proving the efficiency of the biosensor.
Potentiometric biosensors most often use indicator electrodes that are selectively sensitive to the target molecule, so the recorded potential depends on the activity of the target molecule. The time taken by the electrode to reach equilib-rium with the solution affects the accuracy of sensitivity of the measurement because of the presence of interfering ions.
Indeed, most of the electrodes use Ag/AgCl which results in free Cl− ions in the solution hence reducing the sensitivity of the biosensor. Several advancements have been performed to fabricate miniaturized reference electrodes for potentio-metric biosensors, but their use is limited due to inadequate stability and reduced lifetime in high ionic strength biological samples [60].
2. Discussion and Comparison of Potentiostats
Tables 1–3 summarize the main electrical features and design considerations of different potentiostats used for detection of proteins. For each potentiostat, the tables show bibliography references, specific protein detected, peak voltages and cur-rents, frequency, portability, programmability, and sensitiv-ity. It can be observed from the column of publication year that majority of the studies related to detection of a specific protein with the help of potentiostats have been conducted in the last five years. This shows that research focused on potentiostats for protein detection has become a point of interest over the recent years. Furthermore, the ever-growing demand for fast and reliable medical diagnosis has led to growing interest in electrochemical biosensors, in particular for the quantification of disease-related protein biomarkers for highly investigated pathologies (e.g., cancer, neurodegenerative diseases) in concentration ranges below ng/ml [61, 62].If we compare the discussed potentiostats in terms of operating voltages, the required voltages fall into two major ranges (±0.1 V and ±2.5 V). Thus, it is important to highlight that the variation of operating voltages is typically between 0.1 and 2 V for the protein detection, in order to avoid any risk of denaturation induced on the protein conformation. In this light, we can observe that the highest accuracy has been obtained in [19] and the highest possibility of customi-zation in [33] which also discusses several design consider-ations and optimum electronic component selection for higher accuracy. Most of the reported potentiostat units use 12/16-bit DAC to generate the accurate output waveform
WE RE CE RG RG = gain control resistance − + − + Signalgenerator Vout Feedback Control amplifier OP1 Instrumentation amplifier
Figure 21: Schematic representation of potentiometric protein detection, where OP1 is the control amplifier.
M icr o p ro cess o r
PDA cell phone
DAC ADC-1 ADC-2 Amplifier Amplifier & voltage follower Low-pass filter Ref working Counter Res.
Figure 22: Mechanism of the portable potentiostat. Recreated from [57].
with the DC resolution up to 75μV, whereas some potentio-stat units use the R2R ladder circuit to generate the analog waveform for voltammetry [63], whose R2R circuit has some limitations mainly due to the tolerance of the resistance. In this picture, regarding the design of the voltage control of the potentiostat, the most advisable aspect to take into con-sideration is its ability to be accurate and provide the exact voltage required and at the same time to be easily configur-able by the users. Similarly, most of the current values lie in nanoampere and microampere ranges. From the compari-son, it can be highlighted that the minimization of the noise in order to detect a small current (<100 pA) is the most desired features of potentiostat for protein quantification. Indeed, as demonstrated in [31, 32], the possibility to detect such small peaks of current allows reducing the minimum solution concentration, typically in the range of ng/ml, and thus improving the clinical relevance of potentiostat use. Another critical issue to take into account in designing a potentiostat is the frequency of the applied stimulus. Among the AC stimulus voltages, [50, 51, 55, 64] employed the larg-est range of frequency from 0.1 Hz to 100 kHz, in order to ensure a proper impedimetric configuration. In order to design a highly accurate impedimetric potentiostat, key design considerations are the linearity of the output voltage and the stability of the system in achieving the desired frequency [40]. This is fundamental to precisely control a selected frequency and to sweep over multiple frequencies for proper characterization of the protein.
Regarding the design, the reported studies have focused on the miniaturisation of the electrochemical systems to promote portability [12]. The miniaturisation and portability of these measurement systems are a forwarding step towards accomplishing real-time and fast POC applications to exe-cute rapid in situ analyses [13]. Indeed, measurements or
detection of analytes could be performed in several locations [17], for instance, in a nonhospital setting by unskilled staff or at home by patients, while analyses in laboratories are time-consuming and costly processes.
For POC diagnostic applications, the potentiostat should be easy to use, portable, and self-contained [17] having the capability to interact with biological samples directly and provide real-time information [19]. Cruz et al. [19] also highlighted that miniature analytical devices will be benefi-cial for the monitoring of physiological parameters and the detection of diseases at early stages at POC. Considering the design, [33] used ADC with maximum resolution of 24 bits and DAC with a maximum resolution of 16 bits to reduce quantization error. Only [28–34] practically designed portable potentiostats that have the potential to be used for POC testing. The programmable, portable, and telemetric biosensor proposed by Jung et al. [65] can be considered a great example of the POC biosensor, but it was designed for detection of a metabolite, ruthenium(III) chloride. However, similar design considerations can be translated for protein detection. Sensitivity and selectivity are important features regarding the functionality of the potentiostats. The dis-cussed potentiostats are highly sensitive, since their mini-mum current detection range is between 100 nA to 600 fA, except [34]. Electrochemical biosensors should be tested with different samples containing target and nontarget biomole-cules to investigate the sensitivity and selectivity at the time [65]. This will validate the performance of a potentiostat, fur-ther validating the practical application of POC potentiostats.
3. Conclusion
In this review, we have investigated the design considerations and reported the analysis on measurement characteristics of
VADC1 VWE1 VWE2 High Z VADC3 VADC2 ZKno w n VIN + − − + − + − + −
Figure 23: Schematic of the potentiostat in potentiometric mode. Reprinted from [34].
Display & storage
RS-232 ADC & MCU
Filter Front-end UREA MEMS sensor IA MSP430f149 OP2335 LT1789-1 Zigbee Signal process & transmission Figure 24: Block diagram of the biosensor. Reprinted from [59].
Table 1: Detailed comparison of the techniques. Chara cteristics Voltammetric/amperometric protein detection Impedimetric protein detection Potentiometric protein detection General working principle Voltammetry methods measure current as a function of applied potential wherein the polarization of the indicator or working electrode is enhanced A sinusoidal stimulus current/voltage with a varying frequency is applied over time for which the resultant voltage/current is measured, whose amplitude and phase change provide information related to target molecules Potentiometry measures the potential of a solution betwe en two electrodes, aff ecting the solution very little in the process. One electrode is called the reference electrode and has a constant potential, while the other one is an indicator electrode whose potential changes with the composition of the sample. Therefore, the di fference of the potential between the two electrodes gives an assessment of the composition of the sample. Changing/varying parameter The cell ’s current is measured while actively altering the cell ’s pot ential The change in resistance and/or capacitance occurs during detection events The di fference in electrode potentials is measured Governing equation/plot Nernst or Butler-Volmer equation Nyquist plot Nernst equation Ou tput They are described as a function of applied potential, measured current, and time Impedance data Measures analyte concentration using potential Sensitivity High Moderate to high Moderate Other contrasting features (i) Excellent sensitivity (ii) Simultaneous determination of several analyt es (iii) Rapid analysis times (i) Very small stimulus voltage (ii) Label free nature Ability to detect free ions Noi se Gives smooth responses withou t noise di stortion Impedance drift and noise have been reported at 100 Hz and lower frequencies. Possesses noise elimination capability
Table 2: Technical comparison of the discussed potentiostats. Auth or Year Protein detected Voltage Current Frequency Portability Progr ammability Sensitivity Voltammetric/amperometric protein detection Lonca ric et al. [28] 2012 Lysozyme -0.4 V 7.4 nA — Portable Programmable High Muid et al. [29] 2014 — ±1.6 mV 1 Hz to 1 kHz Portable Nonprogrammable Molinar i et al. [32] 2015 β -Casein -0.28 V 2 μA to 0.72 μA — Portable Nonprogrammable High Dryden and Wheeler [33] 2015 — -0.25 V-0.52 V 1 — 60 Hz 1 Portable Nonprogrammable -0.15 V-0.5 V 2 70 Hz 2 -0.3 V-0.25 V 3 500 Hz 3 Su n et al. [34] 2016 — -0.2 V to 0.3 V (lactoferrin) 40 μA to 150 μA — Portable Nonprogrammable 0.5 V (Glucose) 7 μAt o 17 μA Cr uz et al. [19] 2014 — ±0.6 V -13 μAt o1 3 μA — Portable Programmable Gho reishizadeh et al. [35] 2017 — 0.65 V 0.1 μAt o3 μA Portable Programmable gain setting Programmable μC driving DAC Medina-Sánchez et al. [39] 2014 Apolipo protein E -0.85 V 0.11 μA 25 Hz Portable Nonprogrammable High Imp edimetric protein detection Pruna et al. [49] 2018 TNF-α ±2.5 V — 1-10 Hz Portable Programmable High Huang et al. [50] 2011 — 10 mV — 0.1 Hz to 100 kHz Portable Nonprogrammable Ogurtsov et al. [51] 2017 — 10 mV — 10 Hz to 100 kHz Portable Programmable gain setting Su n et al. [34] 2016 NeutrAvidin 0.2 V — 1 Hz to 10 kHz Portable Nonprogrammable Moderate Esfandyarpour et al. [52] ∗ 2013 Biotin and streptavidin V rms of 100 mV — 1-10 kHz Nonportable Programmable for impedance techniques and not for voltamm etry High Esfandyarpour et al. [53] ∗ 2013 Streptavidin V rms of 100 mV — 15 kHz Nonportable Programmable for impedance techniques and not for voltamm etry Moderate Bell agambi et al. [54] ∗ 2017 TNF-α 0.228 V —— Nonportable Programmable current and voltage resolution High Ba raket et al. [55] ∗ 2017 Interleukin-1 and Interleukin-10 0.228 V — 0.1 Hz-100 kHz Nonportable Programmable current and voltage resolution High Po tentiometric protein detection Dryden and Wheeler [33] 2015 — 2.3 mV — 30 kHz Portable Nonprogrammable Huang et al. [57] 2004 — 0V -5V 1 μAt o1 m A — Portable Programmable Su n et al. [34] 2016 —— — — Portable Nonprogrammable Ma et al. [59] 2016 — -0.2 to 1 V —— Portable Nonprogrammable 1 Cyc lic volt amm etry, 2 squar ewa ve vo ltammet ry, 3 di fferent ial pul se voltamm etry; ∗com mercial potenti ostats.
Table 3: Detailed technical comparison of the discussed proteins. Auth or Supply voltage Scan rate
Potentiostat operating voltage ADC bits for I->V Electrode type Accuracy Type of noise CMOS chip Communication method Voltammetry type Current limitations Voltammetric/amperometric protein detec tion Lonc aric et al. [28] 5V 10 –500 mV/s. ±2.5 V 10 bits WE — go ld CE — platinum RE — Ag/AgCl Relative uncertainty is <0.6% Peak-t o-peak noise fluctu ation 5n A No USB-po wered and controlled Cyclic voltamm etry Current detection limit 15 nA Muid et al. [29] 5 V 10 mV/s ±1.6 V 12 bits Commercial Ag/AgCl electrode Relative error under 2.5% — No USB-po wered and controlled Cyclic, squarewave voltamm etry Minimum detectable current 10 μA Molin ari et al. [32] 3.7 V — ±2.5 10 bits Commercial Ag/AgCl electrode —— No Wireless & battery-operated Cyclic voltamm etry — Dry den and Wh eeler [33] 5 V 10 0 mV/s ±1.5 V 24 bits Commercial DropSens electrodes Smal l signal error due to higher ADC resolut ion Thermal noise, environmental noise No USB-po wered and controlled Cyclic, squarewave voltamm etry Minimum detectable current 600 fA Sun et al. [34] 2. 5– 5.5 V 25 mV/s ±0.4 V 16 bits Commercial DropSens electrodes with WE — go ld — i/p referred current noise, i/p referred vo ltage noise No Wireless (Bluetooth) Cyclic voltamm etry Detectable current range 800 pA –200 μA Cruz et al. [19] 5 V 50 mV/s ±0.6 V 16 bits Modi fied Au-microelectrode (WE) —— No USB-po wered and controlled Cyclic voltamm etry
Minimum current generated 1.24
μA/M Ghoreish izadeh et al. [35] 3.3 V —— 10 bits WE — go ld CE — platinum RE — Ag/AgCl Input-referred noise of 0. 47 pA Yes CMOS Wireless (Bluetooth) Cyclic voltamm etry Detectable current range ±2 0μ A Medina-Sánchez etal. [39] 3.3 V 10 0 mV/s ±1.1 V — CE & WE — graphite The highlighted part is grammat ically unclear/incorrect. Please rephr ase this part for the sake of clarity and correctness. — Ag/AgCl High — Yes CMOS — Cyclic, squarewave voltamm etry — Im pedimetric Pru na et al. [49 ] 5 V 10 0 mV/s ±2.5 V 10 bits WE — go ld CE — platinum RE — Ag/AgCl Good Noise due to intrinsic nature of biosensor, No Serial comm unication Cyclic voltamm etry — Huang et al. [50] 5 V-— ±2.5 V 16 bits CE — platinum RE — Ag/AgCl WE — ITO-coated glass slide — White noise, periodic noise No USB-po wered and controlled Cyclic voltamm etry —
Table 3: Continued. Auth or Supply voltage Scan rate
Potentiostat operating voltage ADC bits for I->V Electrode type Accuracy Type of noise CMOS chip Communication method Voltammetry type Current limitations Ogurtsov etal. [51] 5– 12 V 10 0 mV/s — 12 bits WE — go ld CE — platinum RE — Ag/AgCl Zero measurement errors — No Serial comm unication Cyclic voltamm etry — Sun et al. [34] 2. 5– 5.5 V 25 mV/s ±0.4 V 16 bits Commercial DropSens electrodes with WE — go ld — i/p referred current noise, i/p referred vo ltage noise No Wireless (Bluetooth) Cyclic voltamm etry Detectable current 800 pA –200 Baraket et al. [55] 5 V 10 0 mV/s ±2.5 V — WE — go ld CE — platinum RE — Ag/AgCl —— No USB-po wered and controlled Cyclic voltamm etry Detectable current 1n A –400 Pot entiometric Dry den and Wh eeler [33] 5 V 10 0 mV/s ±1.5 V 24 bits Commercial DropSens electrodes Smal l signal error due to higher ADC resolut ion Thermal noise, environmental noise No USB-po wered and controlled Cyclic, squarewave voltamm etry Minimum detectable current Huang et al. [57] 5 V —— 12 bits WE — Pt+SLBTLO CE — Pt+Alu RE — Ag/AgCl Devi ation is 1.82% from the commercial pot entiostat — No Wirelessly contr olled Cyclic voltamm etry Detectable current 1μA –1m Sun et al. [34] 2. 5– 5.5 V 25 mV/s ±0.4 V 16 bits Commercial DropSens electrodes with WE — go ld — i/p referred current noise, i/p referred vo ltage noise No Wireless (Bluetooth) Cyclic voltamm etry Detectable current 800 pA –200 Ma et al. [59] 3.7 V 50 mV/s -0.2 V –1.0 V1 12 bits WE — go ld CE — gold RE — Ag/AgCl High Out-of-band noise No Wireless (Zigbee) Cyclic voltamm etry —
potentiostats specifically used for protein biosensing. Despite that biochemical and immune-assays are still considered the reliable gold standard for protein quantification, they show limitations in terms of time, expertise required, cost, and detection volumes. Therefore, there is an urgent need to develop real-time, portable, highly sensitive, selective, minia-turized, multichannel, and easy-to-use diagnostic tools for early detection of diseases. This review classified the poten-tiostats into three major categories (potentiometric, impedi-metric, and voltammetric) based on the operations and reported their measurement characteristics. Tables 2 and 3 demonstrate how a proper potentiostat for protein character-ization should be selected based on the supply voltage typically in the range of mV to few V; also, there is a higher demand of readability of current, typically within the range of some 100 pA, which requires a higher ADC resolution ranging from 10 bits to 24 bits and a sensitivity of detection with variable scan rates ranging from 10 mV/s to 1.2 V/s. Overall, this review summarizes the design considerations for potentiostat and how the research is moving forward in the direction of designing portable, programmable, highly sensitive, miniaturized, and real-time potentiostats, opening the possibility of POC testing without going to the laboratory.
Conflicts of Interest
The authors declare that they have no conflicts of interest.
References
[1] P. Mehrotra, “Biosensors and their applications - a review,”
Journal of Oral Biology and Craniofacial Research, vol. 6,
no. 2, pp. 153–159, 2016.
[2] S. Choi, M. Goryll, L. Y. M. Sin, P. K. Wong, and J. Chae, “Microfluidic-based biosensors toward point-of-care detection
of nucleic acids and proteins,” Microfluidics and Nanofluidics,
vol. 10, no. 2, pp. 231–247, 2011.
[3] D. De Venuto, M. D. Torre, C. Boero, S. Carrara, and G. De
Micheli, “A novel multi-working electrode potentiostat for
electrochemical detection of metabolites,” in 2010 IEEE
Sensors, pp. 1572–1577, Kona, HI, USA, 2010.
[4] S. Vigneshvar, C. C. Sudhakumari, B. Senthilkumaran, and
H. Prakash, “Recent advances in biosensor technology for
potential applications–an overview,” Frontiers in
Bioengineer-ing and Biotechnology, vol. 4, p. 11, 2016.
[5] A. Prasad, K. Mahato, P. K. Maurya, and P. Chandra, “Biomaterials for biosensing applications,” Journal of Analyti-cal & BioanalytiAnalyti-cal Techniques, vol. 7, no. 2, article e124, 2016. [6] B. Cai, S. Wang, L. Huang, Y. Ning, Z. Zhang, and G.-J. Zhang, “Ultrasensitive label-free detection of PNA–DNA
hybridiza-tion by reduced graphene oxidefield-effect transistor
biosen-sor,” ACS Nano, vol. 8, no. 3, pp. 2632–2638, 2014.
[7] M. M. Barsan, M. E. Ghica, and C. M. A. Brett,
“Electrochem-ical sensors and biosensors based on redox polymer/carbon
nanotube modified electrodes: a review,” Analytica Chimica
Acta, vol. 881, pp. 1–23, 2015.
[8] H. Li, X. Liu, L. Li, X. Mu, R. Genov, and A. Mason,“CMOS
electrochemical instrumentation for biosensor microsystems: a review,” Sensors, vol. 17, no. 12, p. 74, 2017.
[9] A. Bewick and M. Fleischmann, “The design and
perfor-mance of potentiostats,” Electrochimica Acta, vol. 8, no. 3,
pp. 89–106, 1963.
[10] Y.-H. Sheu and C.-Y. Huang, “A portable potentiostat for
electrochemical sensors,” in 3rd Kuala Lumpur
Interna-tional Conference on Biomedical Engineering 2006, vol. 15 of
IFMBE Proceedings, pp. 538–542, Kuala Lumpur, Malaysia,
2006, Springer.
[11] E. S. Friedman, M. A. Rosenbaum, A. W. Lee, D. A. Lipson,
B. R. Land, and L. T. Angenent,“A cost-effective and
field-ready potentiostat that poises subsurface electrodes to monitor
bacterial respiration,” Biosensors and Bioelectronics, vol. 32,
no. 1, pp. 309–313, 2012.
[12] L. Oluwole, T. O. Adegoke, and O. O. Ajide,“Development of
afield-portable digital potentiostat,” International Journal of
Scientific and Engineering Research, vol. 5, pp. 654–661, 2014.
[13] J. Colomer-Farrarons, P. L. Miribel-Català, A. I.
Rodríguez-Villarreal, and J. Samitier, “Portable bio-devices: design of
electrochemical instruments from miniaturized to implantable
devices,” in New Perspectives in Biosensors Technology and
Applications, pp. 373–400, InTech, 2011.
[14] C.-Y. Huang, “Design of a portable potentiostat with
dual-microprocessors for electrochemical biosensors,” Universal
Journal of Electrical and Electronic Engineering, vol. 3, no. 6,
pp. 159–164, 2015.
[15] D. Harvey,“Analytical Chemistry 2.0—an open-access digital
textbook,” Analytical and Bioanalytical Chemistry, vol. 399,
no. 1, pp. 149–152, 2011.
[16] Y. Wang, H. Xu, J. Zhang, and G. Li,“Electrochemical sensors
for clinic analysis,” Sensors, vol. 8, no. 4, pp. 2043–2081, 2008.
[17] A. Nemiroski, D. C. Christodouleas, J. W. Hennek et al., “Universal mobile electrochemical detector designed for use
in resource-limited applications,” Proceedings of the National
Academy of Sciences, vol. 111, no. 33, pp. 11984–11989, 2014.
[18] C. D. García, K. Y. Chumbimuni-Torres, and E. Carrilho, Eds., Capillary electrophoresis and microchip capillary electrophore-sis: principles, applications, and limitations, John Wiley & Sons, Inc., Hoboken, NJ, USA, 2013.
[19] A. F. D. Cruz, N. Norena, A. Kaushik, and S. Bhansali, “A low-cost miniaturized potentiostat for point-of-care
diagnosis,” Biosensors and Bioelectronics, vol. 62, pp. 249–
254, 2014.
[20] N. Chaffey, “Alberts, B., Johnson, A., Lewis, J., Raff, M., Roberts, K. and Walter, P. Molecular biology of the cell. 4th
edn,” Annals of Botany, vol. 91, no. 3, pp. 401–401, 2003.
[21] M. W. Gonzalez and M. G. Kann,“Chapter 4: protein
interac-tions and disease,” PLoS Computational Biology, vol. 8, no. 12,
article e1002819, 2012.
[22] J. Wang, Analytical electrochemistry, Wiley-VCH, 2006. [23] P. Bembnowicz, G.-Z. Yang, S. Anastasova, A.-M.
Spehar-Deleze, and P. Vadgama, “Wearable electronic sensor for
potentiometric and amperometric measurements,” in 2013
IEEE International Conference on Body Sensor Networks, pp. 1–5, Cambridge, MA, USA, 2013.
[24] J. Punter, J. Colomer-Farrarons, and P. L. Miribel,
“Bioelec-tronics for amperometric biosensors,” in State of the Art in
Biosensors-General Aspects, pp. 241–274, InTech, 2013.
[25] M. Li, Y.-T. Li, D.-W. Li, and Y.-T. Long,“Recent
develop-ments and applications of screen-printed electrodes in
environmental assays—a review,” Analytica Chimica Acta,
” Journal of Chemical Education,
vol. 95, no. 2, pp. 197–206, 2017.
[27] A. J. Bard and L. R. Faulkner, Electrochemical Methods : Fundamentals and Applications, Wiley, 2001.
[28] C. Loncaric, Y. Tang, C. Ho, M. A. Parameswaran, and H. Z.
Yu, “A USB-based electrochemical biosensor prototype for
point-of-care diagnosis,” Sensors and Actuators B: Chemical,
vol. 161, no. 1, pp. 908–913, 2012.
[29] A. Muid, M. Djamal, and R. Wirawan, “Development of a
low cost potentiostat using ATXMEGA32,” AIP Conference
Proceedings, vol. 1589, pp. 124–128, 2012.
[30] K. Kellner, T. Posnicek, J. Ettenauer, K. Zuser, and M. Brandl, “A new, low-cost potentiostat for environmental
measure-ments with an easy-to-use PC interface,” Procedia Engineering,
vol. 120, pp. 956–960, 2015.
[31] S. Kwakye and A. Baeumner, “An embedded system for
portable electrochemical detection,” Sensors and Actuators B:
Chemical, vol. 123, no. 1, pp. 336–343, 2007.
[32] J. Molinari, C. Moina, and G. Ybarra, “Electrochemical
immunosensor for the determination of β-casein,” Journal
of Electrochemical Science and Engineering, vol. 5, no. 1, pp. 9–16, 2015.
[33] M. D. M. Dryden and A. R. Wheeler, “DStat: a versatile,
open-source potentiostat for electroanalysis and integration,”
PLoS One, vol. 10, no. 10, article e0140349, 2015.
[34] A. Sun, A. G. Venkatesh, and D. A. Hall,“A multi-technique
reconfigurable electrochemical biosensor: enabling personal
health monitoring in mobile devices,” IEEE Transactions on
Biomedical Circuits and Systems, vol. 10, no. 5, pp. 945– 954, 2016.
[35] S. S. Ghoreishizadeh, I. Taurino, G. De Micheli, S. Carrara, and
P. Georgiou,“A differential electrochemical readout ASIC with
heterogeneous integration of bio-nano sensors for
ampero-metric sensing,” IEEE Transactions on Biomedical Circuits
and Systems, vol. 11, no. 5, pp. 1148–1159, 2017.
[36] A. Ainla, M. P. S. Mousavi, M. N. Tsaloglou et al.,
“Open-source potentiostat for wireless electrochemical detection with
smartphones,” Analytical Chemistry, vol. 90, no. 10, pp. 6240–
6246, 2018.
[37] G. F. Giordano, M. B. R. Vicentini, R. C. Murer et al.,
“Point-of-use electroanalytical platform based on homemade
poten-tiostat and smartphone for multivariate data processing,”
Electrochimica Acta, vol. 219, pp. 170–177, 2016.
[38] M. D. Steinberg, P. Kassal, I. Kereković, and I. M. Steinberg, “A
wireless potentiostat for mobile chemical sensing and
biosens-ing,” Talanta, vol. 143, pp. 178–183, 2015.
[39] M. Medina-Sánchez, S. Miserere, E. Morales-Narváez, and
A. Merkoçi,“On-chip magneto-immunoassay for Alzheimer’s
biomarker electrochemical detection by using quantum dots
as labels,” Biosensors and Bioelectronics, vol. 54, pp. 279–
284, 2014.
[40] E. B. Bahadır and M. K. Sezgintürk, “A review on impedimetric
biosensors,” Artificial Cells, Nanomedicine, and Biotechnology,
vol. 44, no. 1, pp. 248–262, 2016.
[41] J.-G. Guan, Y.-Q. Miao, and Q.-J. Zhang, “Impedimetric
biosensors,” Journal of Bioscience and Bioengineering, vol. 97,
no. 4, pp. 219–226, 2004.
[42] F. Lisdat and D. Schäfer, “The use of electrochemical
impedance spectroscopy for biosensing,” Analytical and
[43] B.-Y. Chang and S.-M. Park, “Electrochemical impedance
spectroscopy,” Annual Review of Analytical Chemistry, vol. 3,
no. 1, pp. 207–229, 2010.
[44] S. Petrovic,“Cyclic voltammetry of hexachloroiridate(IV): an
alternative to the electrochemical study of the ferricyanide
ion,” The Chemical Educator, vol. 5, no. 5, pp. 231–235, 2000.
[45] S.-M. Park and J.-S. Yoo, “Electrochemical impedance
spec-troscopy for better electrochemical measurements,” Analytical
Chemistry, vol. 75, no. 21, pp. 455A–461A, 2003.
[46] J. S. Daniels and N. Pourmand,“Label-free impedance
biosen-sors: opportunities and challenges,” Electroanalysis, vol. 19,
no. 12, pp. 1239–1257, 2007.
[47] M. Citartan, S. C. B. Gopinath, J. Tominaga, and T. H. Tang, “Label-free methods of reporting biomolecular interactions by optical biosensors,” Analyst, vol. 138, no. 13, pp. 3576– 3592, 2013.
[48] S. Sang, Y. Wang, Q. Feng, Y. Wei, J. Ji, and W. Zhang, “Progress of new label-free techniques for biosensors: a review,” Critical Reviews in Biotechnology, vol. 36, no. 3,
pp. 465–481, 2016.
[49] R. Pruna, F. Palacio, A. Baraket et al.,“A low-cost and
minia-turized potentiostat for sensing of biomolecular species such as
TNF-α by electrochemical impedance spectroscopy,”
Biosen-sors and Bioelectronics, vol. 100, pp. 533–540, 2018.
[50] X. Huang, H. Chen, H. Deng, L. Wang, S. Liao, and A. Tang, “A fast and simple electrochemical impedance spectroscopy measurement technique and its application in portable,
low-cost instrument for impedimetric biosensing,” Journal of
Electroanalytical Chemistry, vol. 657, no. 1-2, pp. 158–
163, 2011.
[51] V. I. Ogurtsov, K. Twomey, and J. Pulka,“A portable sensing
system for impedance based detection of biotoxin substances,” in Proceedings of the 10th International Joint Conference on Biomedical Engineering Systems and Technologies (BIOSTEC
2017), pp. 54–62, Porto, Portugal, 2017.
[52] R. Esfandyarpour, H. Esfandyarpour, M. Javanmard, J. S.
Harris, and R. W. Davis,“Microneedle biosensor: a method
for direct label-free real time protein detection,” Sensors and
Actuators B: Chemical, vol. 177, pp. 848–855, 2013.
[53] R. Esfandyarpour, M. Javanmard, Z. Koochak, H. Esfandyarpour,
J. S. Harris, and R. W. Davis,“Thin film nanoelectronic probe
for protein detection,” MRS Proceedings, vol. 1572, 2013.
[54] F. G. Bellagambi, A. Baraket, A. Longo et al.,“Electrochemical
biosensor platform for TNF-α cytokines detection in both
artificial and human saliva: heart failure,” Sensors and
Actua-tors B: Chemical, vol. 251, pp. 1026–1033, 2017.
[55] A. Baraket, M. Lee, N. Zine, M. Sigaud, J. Bausells, and
A. Errachid, “A fully integrated electrochemical biosensor
platform fabrication process for cytokines detection,”
Biosen-sors and Bioelectronics, vol. 93, pp. 170–175, 2017.
[56] A. Das, P. Bhadri, F. R. Beyette, A. Jang, P. Bishop, and
W. Timmons, “A potentiometric sensor system with
inte-grated circuitry for in situ environmental monitoring,” in
2006 Sixth IEEE Conference on Nanotechnology, pp. 917–920,
Cincinnati, OH, USA, 2006.
[57] C. Y. Huang, H. Y. Lin, Y. C. Wang, W. Y. Liao, and T. C.
Chou,“A portable and wireless data transmission
potentio-stat,” in The 2004 IEEE Asia-Pacific Conference on Circuits
[58] C. Berggren, B. Bjarnason, and G. Johansson,“An immunolog-ical interleukine-6 capacitive biosensor using perturbation
with a potentiostatic step,” Biosensors and Bioelectronics,
vol. 13, no. 10, pp. 1061–1068, 1998.
[59] W. J. Ma, C. H. Luo, J. L. Lin et al.,“A portable low-power
acquisition system with a urease bioelectrochemical sensor
for potentiometric detection of urea concentrations,” Sensors,
vol. 16, no. 4, 2016.
[60] B. J. Privett, J. H. Shin, and M. H. Schoenfisch,
“Electrochem-ical sensors,” Analytical Chemistry, vol. 80, no. 12, pp. 4499–
4517, 2008.
[61] F. J. Gruhl, B. E. Rapp, and K. Länge, Biosensors for Diagnostic Applications, Springer, Berlin, Heidelberg, 2011.
[62] S. Tonello, G. Abate, M. Borghetti et al., “Wireless
point-of-care platform with screen-printed sensors for biomarkers
detection,” IEEE Transactions on Instrumentation and
Mea-surement, vol. 66, no. 9, pp. 2448–2455, 2017.
[63] B. Aremo, M. Oyebamiji Adeoye, I. B. Obioh, and O. A.
Adeboye, “A simplified microcontroller based potentiostat
for low-resource applications,” Open Journal of Metal, vol. 5,
no. 4, pp. 37–46, 2015.
[64] C.-Y. Huang, Y.-C. Wang, H.-C. Chen, and K.-C. Ho,“Design
of a portable potentiostat for electrochemical sensors,” in
Proceedings of the 2004 Intelligent Sensors, Sensor Networks
and Information Processing Conference, 2004, pp. 331–336,
Melbourne, VIC, Australia, 2004.
[65] J. Jung, J. Lee, S. Shin, and Y. Kim, “Development of a
telemetric, miniaturized electrochemical amperometric
International Journal of
Aerospace
Engineering
Hindawi www.hindawi.com Volume 2018Robotics
Journal of Hindawi www.hindawi.com Volume 2018 Hindawi www.hindawi.com Volume 2018Active and Passive Electronic Components VLSI Design Hindawi www.hindawi.com Volume 2018 Hindawi www.hindawi.com Volume 2018
Shock and Vibration
Hindawi
www.hindawi.com Volume 2018
Civil Engineering
Advances inAcoustics and VibrationAdvances in Hindawi
www.hindawi.com Volume 2018
Hindawi
www.hindawi.com Volume 2018
Electrical and Computer Engineering Journal of Advances in OptoElectronics Hindawi www.hindawi.com Volume 2018
Hindawi Publishing Corporation
http://www.hindawi.com Volume 2013 Hindawi www.hindawi.com
The Scientific
World Journal
Volume 2018 Control Science and Engineering Journal of Hindawi www.hindawi.com Volume 2018 Hindawi www.hindawi.com Journal ofEngineering
Volume 2018Sensors
Journal of Hindawi www.hindawi.com Volume 2018 Hindawi www.hindawi.com Volume 2018 Modelling & Simulation in Engineering Hindawi www.hindawi.com Volume 2018 Hindawi www.hindawi.com Volume 2018 Chemical EngineeringInternational Journal of Antennas and
Propagation International Journal of Hindawi www.hindawi.com Volume 2018 Hindawi www.hindawi.com Volume 2018 Navigation and Observation International Journal of Hindawi www.hindawi.com Volume 2018


![Figure 6: Block diagram of the proposed potentiostat. Recreated from [29].](https://thumb-eu.123doks.com/thumbv2/123dokorg/5548304.65691/4.899.470.814.815.1069/figure-block-diagram-proposed-potentiostat-recreated.webp)
![Figure 10: Schematic of potentiostat in amperometric mode. Reprinted from [34].](https://thumb-eu.123doks.com/thumbv2/123dokorg/5548304.65691/6.899.243.665.760.983/figure-schematic-of-potentiostat-amperometric-mode-reprinted-from.webp)
![Figure 11: Miniaturized potentiostat-based system for cortisol detection. Reprinted from [19].](https://thumb-eu.123doks.com/thumbv2/123dokorg/5548304.65691/7.899.92.809.111.614/figure-miniaturized-potentiostat-based-cortisol-detection-reprinted.webp)
![Figure 16: Nyquist plot for TNF-α detection at different concentrations. Reprinted from [49].](https://thumb-eu.123doks.com/thumbv2/123dokorg/5548304.65691/9.899.472.812.476.748/figure-nyquist-plot-tnf-detection-different-concentrations-reprinted.webp)
![Figure 19: Schematic of potentiostat in impedimetric mode. Reprinted from [34].](https://thumb-eu.123doks.com/thumbv2/123dokorg/5548304.65691/11.899.239.663.111.343/figure-schematic-of-potentiostat-impedimetric-mode-reprinted-from.webp)
