Multiple Sclerosis Journal 2015, Vol. 21(6) 726 –734 DOI: 10.1177/ 1352458514551456 © The Author(s), 2014. Reprints and permissions: http://www.sagepub.co.uk/ journalsPermissions.nav MULTIPLE SCLEROSIS MSJ JOURNAL Introduction
The interaction between sphingosine-1-phosphate (S1P) and the cognate receptor S1P1 is believed to mediate the egress of lymphocytes from secondary lym-phoid tissues (SLT) by overcoming the retention signals operated by the chemokine receptor CCR7,1 which is
expressed by naive T cells, central memory T lympho-cytes (TCM), and B cells, but not by terminally
differen-tiated effector memory T cells (TEM).2,3 Therefore,
fingolimod, a high-affinity agonist for four of the five known receptors,4,5 by downmodulating S1P1, retains
naive, TCM, and B lymphocytes in SLT, while TEM are
spared from this effect.1,6 T
CM lack direct inflammatory
function and represent a clonally expanded, antigen-primed population that migrates to SLT and recirculates on a regular basis between SLT and blood; upon stimu-lation, TCM can generate new waves of effector cells. In
contrast, TEM represent a readily available pool of
anti-gen-primed cells that can enter and reside in non-lym-phoid tissues, such as the central nervous system (CNS), to mediate inflammatory reactions or cytotoxicity.2,3 As
more than 90% of T lymphocytes that accumulate in the cerebrospinal fluid (CSF) of patients with multiple scle-rosis (MS) are TCM, their specific retention in SLT may
be one of the mechanisms underlying the therapeutic effect of fingolimod in MS.7
Newly produced T and B lymphocytes and
T-cell receptor repertoire diversity are reduced
in peripheral blood of fingolimod-treated
multiple sclerosis patients
M Chiarini, A Sottini, D Bertoli, F Serana, L Caimi, S Rasia, R Capra and L Imberti
Abstract
Background: Fingolimod inhibits lymphocyte egress from lymphoid tissues, thus altering the
composi-tion of the peripheral lymphocyte pool of multiple sclerosis patients.
Objective: The objective of this paper is to evaluate whether fingolimod determines a decrease of newly
produced T- and B-lymphocytes in the blood and a reduction in the T-cell receptor repertoire diversity that may affect immune surveillance.
Methods: Blood samples were obtained from multiple sclerosis patients before fingolimod therapy
initia-tion and then after six and 12 months. Newly produced T and B lymphocytes were measured by quanti-fying T-cell receptor excision circles and K-deleting recombination excision circles by real-time PCR, while recent thymic emigrants, naive CD8+ lymphocytes, immature and naive B cells were determined by
immune phenotyping. T-cell receptor repertoire was analyzed by complementarity determining region 3 spectratyping.
Results: Newly produced T and B lymphocytes were significantly reduced in peripheral blood of
fingo-limod-treated patients. The decrease was particularly evident in the T-cell compartment. T-cell repertoire restrictions, already present before therapy, significantly increased after 12 months of treatment.
Conclusions: These results do not have direct clinical implications but they may be useful for further
understanding the mode of action of this immunotherapy for multiple sclerosis patients.
Keywords: Multiple sclerosis, fingolimod, TRECs, KRECs, T-cell receptor repertoire, immunological
monitoring, T-lymphocyte subsets, B-lymphocyte subsets
Date received: 2 May 2014; revised: 5 August 2014; accepted: 17 August 2014
Correspondence to: Luisa Imberti CREA, Diagnostics Department, Spedali Civili of Brescia, p.le Spedali Civili 1, 25123, Brescia, Italy. [email protected] M Chiarini A Sottini D Bertoli F Serana L Caimi L Imberti CREA, Diagnostics Department S Rasia R Capra
Multiple Sclerosis Center, Spedali Civili of Brescia, Italy
Because peripheral lymphocytes represent only approximately 2% of lymphocyte total body stores,8
and because the functions of sequestered lymphocytes appear to be preserved, it has been proposed that the key features of the immune system are likely to be maintained during fingolimod therapy.6,9 However,
because S1P and S1P1 also appear to control T-cell egress from thymus in the mouse model,10 fingolimod
may modify the thymic output of recent thymic emi-grants (RTE), which are the youngest subset of periph-eral T cells. This is a key question, because these cells mainly contribute to the recovery from lymphopenia11
and play a central role in generating and maintaining the diversity of T-cell receptor (TCR) repertoires,12
which is mandatory for efficient immune responses to infections and vaccines. Whether fingolimod influ-ences B-cell emigration from the bone marrow is also presently unclear. Indeed, while earlier data reported that B lymphocyte egress from the production site was only weakly influenced by S1P signalling,10 later
results indicated that immature B-lymphocyte output from bone marrow was reduced.13
Therefore, in view that the number of newly gener-ated lymphocytes is decreased14 and the TCR
reper-toire is restricted in MS patients,15 compared to those
of healthy controls (HCs), in this study we analyzed whether fingolimod treatment has a further impact on these alterations, which may impair the immune response against infections and vaccines.
Methods
Protocol approvals and patient consent
The study was approved by the institutional ethical review board (number 24401). Written informed con-sent was obtained from all individuals participating in the study.
Patients
For this cohort study, 18 patients (11 females; age 36.9 ± 11.6 years) with relapsing–remitting MS, who started fingolimod treatment in the clinical practice (0.5 mg once daily), were consecutively enrolled from April to October 2012 at the MS center of the city hospital. Six of them switched to fingolimod from interferon beta and 11 from natalizumab, after a minimum of a three-month washout period; one patient was naive from therapy and was treated with fingolimod following the Italian Medicines Agency (AIFA) indications. Samples were obtained just before fingolimod therapy initiation, and then six and 12 months thereafter. Changes of clinical parameters during therapy are reported in Table 1. Two out of 18 patients discontinued fingolimod and returned to natalizumab after four and 10 months of treatment and were therefore excluded from the statistical anal-yses. In eight out of the 11 patients receiving fingoli-mod after natalizumab, samples had been previously obtained before natalizumab initiation, and after six, 12, and 24 to 52 additional months of therapy. Results from samples obtained before therapy were compared with those of age- and sex-matched HCs.
Quantification of lymphocyte subpopulations
Newly produced T and B cells were measured by quantifying the number of T-cell receptor excision circles (TRECs) and K-deleting recombination exci-sion circles (KRECs) in peripheral blood mononu-clear cells (PBMCs) using a duplex quantitative real-time polymerase chain reaction (PCR) performed on the 7500 Fast Real-Time PCR (Applied Biosystems), as previously reported.16 Results were
expressed either as copies/106 PBMC or copies/ml.16
RTE and naive CD8+T cells, as well as immature and
naive B cells, were identified using a FACSCanto II cytometer and results were analyzed with FACSDiva Table 1. Clinical features of the patients treated with fingolimod.
Clinical features T6 T12
EDSS (median (range)) 3.5 (1 to 6.5) 4.5 (1 to 6.5)
EDSS change from baselinea (median (range)) 0 (−2.5 to −0.5) 0 (−2.5 to 1.5)
ARR (mean (SD)) – 0.56 (0.81)
Relapse-free patients (% (95% CI)) 52.9 (31.0 to 73.8) 56.2 (33.2 to 76.9) Increase in MRI lesion load (median (range)) 0 (0 to 1) 0 (0 to 3) Patients with increased MRI lesion load (% (95% CI)) 12.5 (3.5 to 36.0) 23.1 (8.2 to 50.3)
Seriousb infections 0 0
a EDSS at baseline (median (range)): 3.75 (1 to 6.5). bHerpes virus-family-related infection or lower respiratory tract. EDSS:
Ex-panded Disability Status Scale; ARR: annualized relapse rate; T6 and T12: six and 12 months of therapy; MRI: magnetic resonance imaging; CI: confidence interval.
software (BD Biosciences), as previously described.17
Data were reported as percentage and as absolute count per µl of blood.
TCR repertoire analysis
The analysis of TCR beta variable (TCRBV) families by spectratyping was performed as previously described,18 starting from 500 ng of total RNA
extracted from at least 2 × 10⁶ cells. The first strand of
the TCRB chain-specific cDNA was utilized for multi-plex PCRs, allowing the detection of 23 functional TCRBV gene families.19 The length distribution of
fluorescent-labelled PCR products was analyzed on an ABI 3130 analyzer (Applied Biosystems). Distribution of fragment lengths, number of detectable peaks per TCRBV element, and area under the curve were calcu-lated by Peak Scanner software version 1.0 (Applied Biosystems). Data were analyzed and reported in three different ways. First, the complexity of individual TCRBV complementarity determining region 3 (CDR3) size distributions was determined by counting the number of distinct peaks within each TCRBV fam-ily, which varied from one to 13 in HCs and from 0 to 10 in MS patients; the sum of the peak number of all 23 TCRBV families determined the overall TCR com-plexity score within each individual. Then, the CDR3 size distributions of each TCRBV family were classi-fied into one of the following five categories: normal (≥7 peaks, Gaussian distribution), shifted (≥7 peaks, deviation from Gaussian distribution), restricted (<7 peaks prominent deviation from Gaussian distribu-tion), mono/oligoclonal (one or two dominant peaks),20
undetectable (absence of detectable peaks); for each participant, the proportions of TCRBV families with a CDR3 distribution belonging to each one of these cat-egories were calculated. Finally, TCRBV distribution perturbations were calculated with the generalized Hamming distance method,21 by “subtracting” from
the CDR3 length distribution of each TCRBV of a patient the average Gaussian-like CDR3 length distri-bution obtained by analyzing a “reference group” composed of eight HCs. When a TCRBV family was not represented (no detectable peaks), the condition of maximal perturbation was reached, and its value was arbitrarily set to 100%.
Statistical analysis
Analyses of variance for repeated measures based on linear mixed models, followed by Bonferroni cor-rected post-hoc tests, were performed to compare the immune parameters between HCs and patients before and during treatment. The models were fitted with time and treatment as covariates (without interaction,
because HCs were not followed over time), and with a random intercept between subjects. A similar proce-dure with time as the only covariate was employed to perform the longitudinal analysis of immune parame-ters in patients switching from natalizumab to fingoli-mod. For all analyses, TREC and KREC values, as well as the absolute cell counts, were log-transformed, whereas the proportion of CDR3 distributions belong-ing to the five distribution categories underwent an angular transformation (i.e. arcsine of their root-square). The total complexity scores and average per-turbation percentages were analyzed by nonparametric methods (Mann-Whitney and Wilcoxon test, with Bonferroni corrected p values). Perturbations were also analyzed at the individual TCRBV-family level, and were considered significantly abnormal when their values were beyond the mean + 3 SD of the per-turbations calculated in HCs.21
Results
Levels of newly produced T and B lymphocytes
The mean level of TRECs/ml in blood samples of MS patients obtained before fingolimod therapy initia-tion, which appeared only slightly but not signifi-cantly reduced compared to HCs, signifisignifi-cantly and progressively decreased after six and 12 months of therapy (Figure 1(a), left). In most patients, TREC/ml levels were below the lowest values observed in HCs and were undetectable in two patients at six months and in five patients at 12 months of therapy. Similar results were obtained when TREC quantities were not corrected for the number of lymphocytes (which were significantly reduced at six months of therapy (mean: 697/µl (confidence interval (CI) 482–912); p < 0.001) and T12 (mean: 688/µl (CI 474–903); p < 0.001) in comparison to baseline (mean: 2385/µl (CI 2170– 2600); p < 0.001) and monocytes (which were con-stant during the therapy), and therefore were expressed per 106 PBMCs (Figure 1(a), right). Analogously, a
fingolimod-related reduction was observed if TREC level was related to the number of circulating CD3+
lymphocytes (Supplementary Figure 1). The number of KRECs, if calculated per ml of blood and per 106
PBMC, significantly decreased during the follow-up, but the reduction was less severe than that of TRECs and remained comparable at six and 12 months of therapy (Figure 1(b)). On the contrary, KRECs increased if their level was related to CD19+ cell
num-ber (Supplementary Figure 1).
The fingolimod-induced decrease of absolute number of TRECs and KRECs was confirmed by flow cytom-etry. In fact, the number and percentage of RTE,
identified as CD4+ cells expressing the CCR7, CD45RA
and CD31 markers (Figure 1(c)), and of CD8+CCR7+
CD45RA+ naive lymphocytes (Figure 1(d)) were
sig-nificantly reduced after six and 12 months of therapy. However, when the percentage of RTE was calculated not over the total CD4+ population, but within the naive
CD4+ subset, there were no differences in samples
obtained before and during fingolimod therapy (Supplementary Figure 2). The number of immature CD19+CD21− and naive CD19+CD21+IgD+CD27− B
cells, which are the subsets containing the highest
number of KRECs,22 decreased significantly in treated
patients from baseline to six and 12 months of therapy (Figure 1(e) and (f), left); on the contrary, the percent-age of immature B cells progressively increased (Figure 1(e), right), while that of B naive cells remained unmodified (Figure 1(f), right).
No differences were found comparing patients who shifted to fingolimod from natalizumab with those who came from interferon beta (IFNβ) therapies, with the only exception of a lower number of naive B cells Figure 1. Quantification of newly produced T and B lymphocytes.
TRECs (a) and KRECs (b) in fingolimod-treated patients were evaluated by real-time PCR before therapy initiation (F0) and after six (F6) and 12 (F12) months and then compared to that of HCs. Values were expressed as number of TRECs and KRECs per ml of blood and per 106 PBMCs. Absolute number and percentage (over the total CD4+ lymphocytes) of RTE (c), naive CD8+ cells (d), immature (e)
and naive B cells (f) were obtained by cytofluorimetric analysis in ex-vivo samples at the indicated time points. TRECs: T-cell receptor excision circles; KRECs: K-deleting recombination excision circles; HCs: healthy controls; RTE: recent thymic emigrants; PBMC: peripheral blood mononuclear cells; PCR: polymerase chain reaction; F0, F6, F12: 0, 6, 12 months of fingolimod treatment. ** p < 0.01; ***p < 0.001.
before fingolimod initiation in patients who had pre-viously received natalizumab (data not shown). Because of the availability of samples obtained before and during natalizumab therapy (at six, 12 and 24-to-52 months), at the washout, and then at six and 12 months of fingolimod therapy in eight patients, we had the possibility to analyze the changes of newly pro-duced T and B lymphocytes in condition of both high (after six months of natalizumab: 3635/µl (3115–4155) and after 12 months: 3496/µl (CI 2976–4016) vs.
before natalizumab: 2046/µl (CI 1526–2566); p < 0.001) and low number of peripheral lymphocyte counts (see values before). The levels of TRECs, KRECs, as well as of T and B subpopulations, increased after six months of natalizumab therapy (Figure 2) and remained stable thereafter; but then, after six months of fingolimod administration, TRECs, RTE and naive CD8+ cells significantly decreased if
compared to the washout time point, as well as from six to 12 months (Figure 2). KRECs, immature and naive B cells decreased only in the first six months Figure 2. Newly produced T and B lymphocytes before and after the switch from natalizumab to fingolimod.
The values of TRECs, KRECs, RTE, naive CD8+ cells, immature and naive B cells in eight individual patients (#1 to #8) who received
natalizumab and then switched to fingolimod are displayed. Samples were obtained before each therapy initiation and after six and 12 months, and at variable intervals between 24 and 52 months of therapy with natalizumab.
TRECs: T-cell receptor excision circles; KRECs: K-deleting recombination excision circles; RTE: recent thymic emigrants; N0, N6, N12: 0, six, 12 months of natalizumab treatment; WO/F0: sample obtained after the washout from natalizumab, but before fingolimod treatment; F6, F12: six, 12 months of fingolimod treatment.
after fingolimod initiation, and then remained stably low. Of note, in patients #7 and #8, higher values reflect the reversal to natalizumab treatment earlier than six and 12 months, respectively.
TCR repertoire diversity
The overall complexity score, which is an indicator of TCR repertoire heterogeneity, was lower in patients with MS before fingolimod therapy initiation com-pared to HCs. This parameter further decreased in patients who received fingolimod for 12 months, indi-cating that the drug might augment some TCR reper-toire restrictions already present in the pre-treatment samples (Figure 3(a)). Accordingly, the mean propor-tion of TCRBV elements with restricted and mono/
oligoclonal profiles or with undetectable TCRBV families was significantly higher (59% (CI 53–66)) in samples of fingolimod-treated patients than in pre-treatment samples (36% (CI 30–42)) and in samples of HCs (6% (CI 2–11); Figure 3(b)). The analysis of the average percentage of TCRBV perturbations cal-culated in patients, treated or not treated with fingoli-mod, confirmed the finding of a higher proportion of TCRBV elements with a distorted CDR3 size distri-bution during the therapy (Figure 3(c)).
Altogether, these data demonstrated that TCR reper-toire was significantly altered in fingolimod-treated patients. On the contrary, the total complexity score and the average TCRBV perturbations were unmodi-fied in the natalizumab-treated patients (Supplementary Figure 3).
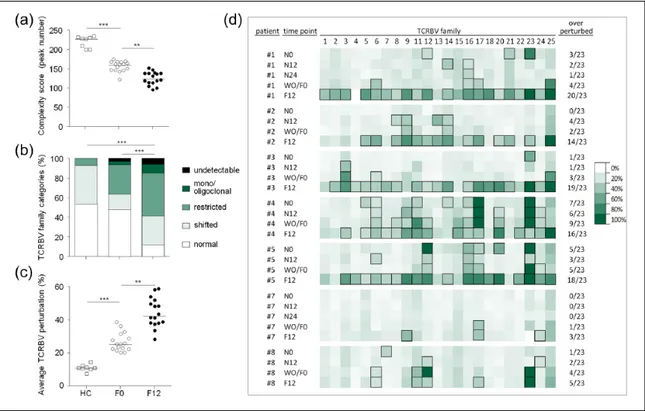
Figure 3. Analysis of TCRBV repertoire diversity.
(a) Total complexity scores across the 23 TCRBV families analyzed in HCs and in MS patients before (F0) and after 12 months of fingolimod therapy (F12). Each dot represents one individual. (b) Percentage of normally distributed, shifted/skewed, restricted, mono/ oligoclonally expanded and undetectable (absence of detectable peaks) TCRBV elements. Displayed bar lengths were calculated as the group means of the within-patient proportions of TCRBV elements belonging to each one of the five proposed categories. The reported significance was obtained comparing the within-patient proportions of pooled (mono/oligoclonal + restricted + undetectable) vs. (shifted + normal) categories between HCs, F0 and F12 by analysis of variance. (c) Percentages of TCRBV perturbations in HCs, F0 and F12. Each dot represents the global average perturbation of the TRCBV repertoire in one patient. (d) Heatmap representing the CDR3 distribution perturbation at the single-TCRBV, single-patient level, in seven of the eight patients who switched from natalizumab to fingolimod. Boxed squares represent the TCRBV families whose perturbations are higher than the mean+3SD of the value seen in the corresponding TCRBV family in HCs. The proportion of these over-perturbed TCRBV elements is indicated in column “*”. Patients #7 and #8 switched back to natalizumab treatment before reaching time point F12.
TCRBV: T-cell receptor variable beta; HCs: healthy controls; MS: multiple sclerosis patients; CDR3: complementarity determining region 3; N0: before natalizumab; N12: 12 months after natalizumab initiation; WO/F0: after natalizumab washout, but before assuming fingolimod; F6, F12 = six, 12 months of fingolimod treatment. ** p < 0.01; *** p < 0.001.
In the eight patients who shifted from natalizumab to fingolimod and from whom longitudinal samples were available during these therapies, TCRBV pertur-bations were also evaluated at the single-patient level. We found that the number of perturbed TCRBV fami-lies increased from pre-natalizumab to 12 months of fingolimod treatment, but, surprisingly, in all but one of them also increased during the washout (Figure 3(d)), when fingolimod had not been initiated and the levels of newly produced lymphocytes had not decreased yet. In the two patients who discontinued fingolimod and returned to natalizumab, this increase in TCR repertoire perturbation was clearly dampened by the second therapy switch. Some over-perturbed TCRBV families, which were present before therapy initiation, disappeared after 12 months of natali-zumab, but returned after 12 months of fingolimod (TCRBV12, 21 and 23 of patients #1, for instance; Figure 3(d)), while other TCRBV alterations persisted during the all observation period (TCRBV6, 17 and 23 in patients #4; and TCRBV12, and 16 in patients #5; Figure 3(d)). Other perturbed TCRBV families appeared only after natalizumab therapy (TCRBV16 in patients #1; TCRBV3 in patients #3; TCRBV9 and 14 in patient #2; and TCRBV9, 20 and 24 in patient #4; Figure 3(d)), or become evident at the washout time point and remained during fingolimod treatment. No correlation was found between the extent of fin-golimod-induced lymphopenia and the degree of rep-ertoire perturbation (data not shown). For a representative example of the CDR3 spectratype changes reflecting alterations in the TCRBV reper-toire during time, see also Supplementary Figure 4.
Discussion
In physiological conditions, the size of the peripheral T-cell pool is maintained relatively constant through-out life. In fact, despite their continuous turnover and thymic export,23,24 the number of T cells is kept large
enough to adequately protect against pathogens, but small enough to avoid taxing the host resources. Using a mice model, Houston et al.25 demonstrated
that when the peripheral lymphoid compartment is full, newly produced T lymphocytes are not accepted into the periphery and persist less well than mature naive T cells. On the contrary, under lymphopenic conditions, when these T cells would be particularly important for replenishing the TCR diversity, RTE are able to fill the void effectively. This mechanism, apparently, is altered in MS patients during fingoli-mod treatment because we found that in the condition of severe fingolimod-induced lymphopenia the levels of TRECs, RTE, and naive CD8 were dramatically
reduced. While this is in line with data obtained in mice, in which fingolimod appears to inhibit mature thymocyte emigration from the thymus to the periph-ery,26 the similar percentage of RTE, calculated within
the naive CD4 subset, observed before and during therapy, suggests that thymic output is not per se heavily affected by the therapy. This could be a key point to understand why the incidence of infections is only slightly increased during the treatment with fingolimod.27,28
If the increased number of TREC+ cells has been
pro-posed as one of the reasons for the enlargement of the TCR repertoire observed in natalizumab-treated patients,20,29 their reduction in the peripheral blood
may be responsible for the profound TCR repertoire restrictions that we have observed in fingolimod-treated patients. The low levels of circulating newly produced T cells and the reduced peripheral T-cell diversity could raise the concern that fingolimod may impair both the development of immune responses to novel antigens and the steady-state immune response to chronic or latent viral infections. It is well known that the ability of T-cells to respond to foreign anti-gens relies on the recognition of antigenic epitopes by diverse TCR, and the presence of heterogeneous T cells is crucial in mounting immune responses against pathogens. In fact, skewing of the repertoire leads to missing immune responses, as seen in human immu-nodeficiency virus (HIV) infection,30 aging,11,12 and
various immune deficiencies.31,32 This may help
explain the small increase in the number and, in rare cases, severity of some infections, in particular herpes virus related,27,28,33 even considering that the variation
in total lymphocyte counts was barely correlated to infection rates in the patients of fingolimod phase III trials.34 This is an intriguing point because
natali-zumab-treated patients who, on the contrary, have been shown to have an increased thymic output17 and
a broader TCR repertoire,20 are at high risk of severe
John Cunningham (JC) virus infections. However, it has been reported that an MS patient treated with natalizumab who had a very low number of TRECs and RTE in the presence of a restricted repertoire developed a progressive multifocal leukoencephalop-athy.18 Therefore, these two drugs appear to have an
impact on the immune surveillance that is not only related to the integrity of the T-cell compartment. A limitation of the present study is that we cannot for-mally establish whether the reduced TCR repertoire was related to the altered composition of the periph-eral blood T-cell subsets or occurs independently of this. However, in allo-stem cell-transplanted patients
peripheral repertoire was skewed when T cells expressed a memory phenotype, but the diversity pro-gressively increased with the appearance of naive T cells.35
Another point emerging from our data is that the inter-ruption of natalizumab therapy and three to six months of washout may also lead to an increased restriction of the TCR repertoire, even if, at the same time, the num-ber of TRECs, RTE or naive T cells are unmodified. Furthermore, the detailed analysis of TCR repertoire also demonstrated that the drug-induced appearance/ disappearance of clonal/oligoclonal expansions was a very dynamic phenomenon accruing quickly after the therapy switch.
Although less completely than for thymic or SLT egress,1 the S1P system appears also to contribute to
B-cell egress from the bone marrow. We found that the number of KRECs, if calculated per ml of blood or per 106 PBMCs, as well as the number of immature and
naive B cells, were decreased in peripheral blood of fingolimod-treated patients. However, differently from Nakamura et al.,36 who demonstrated that the
fre-quency of B-cell populations within CD19+ B
lympho-cytes was not significantly altered by fingolimod therapy, we found that the number of KRECs related to circulating CD19+ lymphocytes and the percentage
of immature B cells were increased.
Although the number of analyzed patients is too small to draw any conclusions with regards to potential infectious complications that may occur in treated patients and the results do not have direct clinical implications, our findings may be useful for further understanding the mode of action of immunotherapies for MS. Indeed, because of the longitudinal design of the study, the availability of some samples from patients who were followed for five years, the updated techniques used, and the paired sampling analysis of the data, the study has enough strength to shed light on the fine immunological changes induced by two drugs that, by interfering with the migration of leuko-cytes, have revolutionized MS treatment.
Conflicts of interest
Drs Chiarini, Sottini, Bertoli, Caimi and Rasia have nothing to declare. Dr Serana has received support to cover travel expenses and participation to congresses from Biogen-Idec, Merck-Serono and Teva. Dr Capra has received speaking honoraria from Biogen-Idec, Bayer, Teva, Genzyme, Novartis and Sanofi Aventis, and was a Steering Committee Member for Novartis e Biogen-Idec. Dr Imberti has received support to cover travel expenses for participation to congresses from
Biogen-Idec and Teva, and grants from Biogen-Idec and Merck-Serono.
Funding
This work was partially funded by Novartis, which did not have any role in writing the manuscript or decision to publish, but revised the final version before submis-sion. Dr Chiarini received a Tosoni fellowship.
References
1. Cyster JG and Schwab SR. Sphingosine-1-phosphate and lymphocyte egress from lymphoid organs. Annu
Rev Immunol 2012; 30: 69–94.
2. Sallusto F, Geginat J and Lanzavecchia A. Central memory and effector memory T cell subsets: Function, generation, and maintenance. Annu Rev
Immunol 2004; 22: 745–763.
3. Lanzavecchia A and Sallusto F. Understanding the generation and function of memory T cell subsets.
Curr Opin Immunol 2005; 17: 326–332.
4. Brinkmann V, Davis MD, Heise CE, et al. The immune modulator FTY720 targets sphingosine 1-phosphate receptors. J Biol Chem 2002; 277: 21453–21457.
5. Mandala S, Hajdu R, Bergstrom J, et al. Alteration of lymphocyte trafficking by sphingosine-1-phosphate receptor agonists. Science 2002; 296: 346–349. 6. Brinkmann V, Billich A, Baumruker T, et al.
Fingolimod (FTY720): discovery and development of an oral drug to treat multiple sclerosis. Nat Rev Drug
Discov 2010; 9: 883–897.
7. Kivisakk P, Mahad DJ, Callahan MK, et al. Expression of CCR7 in multiple sclerosis: Implications for CNS immunity. Ann Neurol 2004; 55: 627–638.
8. Storek J, Lalovic BB, Rupert K, et al. Kinetics of B, CD4 T, and CD8 T cells infused into humans: Estimates of intravascular:extravascular ratios and total body counts. Clin Immunol 2002; 102: 249–257.
9. Mehling M, Brinkmann V, Antel J, et al. FTY720 therapy exerts differential effects on T cell subsets in multiple sclerosis. Neurology 2008; 71: 1261–1267. 10. Matloubian M, Lo CG, Cinamon G, et al.
Lymphocyte egress from thymus and peripheral lymphoid organs is dependent on S1P receptor 1.
Nature 2004; 427: 355–360.
11. Yager EJ, Ahmed M, Lanzer K, et al. Age-associated decline in T cell repertoire diversity leads to holes in the repertoire and impaired immunity to influenza virus. J Exp Med 2008; 205: 711–723.
12. Johnson PL, Goronzy JJ and Antia R. A population biological approach to understanding the maintenance and loss of the T cell repertoire during aging.
Immunology 2014; 142: 167–175.
13. Pereira JP, Xu Y and Cyster JG. A role for S1P and S1P1 in immature-B cell egress from mouse bone marrow. PLoS One 2010; 5: e9277.
14. Duszczyszyn DA, Williams JL, Mason H, et al. Thymic involution and proliferative T-cell responses in multiple sclerosis. J Neuroimmunol 2010; 221: 73–80.
15. Gran B, Gestri D, Sottini A, et al. Detection of skewed T-cell receptor V-beta gene usage in the peripheral blood of patients with multiple sclerosis. J
Neuroimmunol 1998; 85: 22–32.
16. Serana F, Airò P, Chiarini M, et al. Thymic and bone marrow output in patients with common variable immunodeficiency. J Clin Immunol 2011; 31: 540–549.
17. Zanotti C, Chiarini M, Serana F, et al. Peripheral accumulation of newly produced T and B
lymphocytes in natalizumab-treated multiple sclerosis patients. Clin Immunol 2012; 145: 19–26.
18. Sottini A, Capra R, Zanotti C, et al. Pre-existing T- and B-cell defects in one progressive multifocal leukoencephalopathy patient. PLoS One 2012; 7: e34493.
19. Akatsuka Y, Martin EG, Madonik A, et al. Rapid screening of T-cell receptor (TCR) variable gene usage by multiplex PCR: Application for assessment of clonal composition. Tissue Antigens 1999; 53: 122–134.
20. Warnke C, Mausberg AK, Stettner M, et al. Natalizumab affects the T-cell receptor repertoire in patients with multiple sclerosis. Neurology 2013; 81: 1400–1408.
21. Gorochov G, Neumann AU, Kereveur A, et al. Perturbation of CD4+ and CD8+ T-cell repertoires during progression to AIDS and regulation of the CD4+ repertoire during antiviral therapy. Nat Med 1998; 4: 215–221.
22. van Zelm MC, Szczepanski T, van der Burg M, et al. Replication history of B lymphocytes reveals homeostatic proliferation and extensive antigen-induced B cell expansion. J Exp Med 2007; 204: 645–655.
23. Scollay RG, Butcher EC and Weissman IL. Thymus cell migration. Quantitative aspects of cellular traffic from the thymus to the periphery in mice. Eur J
Immunol 1980; 10: 210–218.
24. Tough DF and Sprent J. Turnover of naive- and memory-phenotype T cells. J Exp Med 1994; 179: 1127–1135.
25. Houston EG Jr, Higdon LE and Fink PJ. Recent thymic emigrants are preferentially incorporated only into the depleted T-cell pool. Proc Natl Acad Sci U S
A 2011; 108: 5366–5371.
26. Yagi H, Kamba R, Chiba K, et al.
Immunosuppressant FTY720 inhibits thymocyte emigration. Eur J Immunol 2000; 30: 1435–1444. 27. Kappos L, Radue EW, O’Connor P, et al. A
placebo-controlled trial of oral fingolimod in relapsing multiple sclerosis. New Eng J Med 2010; 362: 387–401.
28. Calabresi PA, Radue EW, Goodin D, et al. Safety and efficacy of fingolimod in patients with relapsing– remitting multiple sclerosis (FREEDOMS II): A double-blind, randomised, placebo-controlled, phase 3 trial. Lancet Neurol 2014; 13: 545–556.
29. Hohlfeld R and Stüve O. A bird’s-eye view of T cells during natalizumab therapy. Neurology 2013; 81: 1372–1373.
30. Connors M, Kovacs JA, Krevat S, et al. HIV infection induces changes in CD4+ T-cell phenotype and depletions within the CD4+ T-cell repertoire that are not immediately restored by antiviral or immune-based therapies. Nat Med 1997; 3: 533–540. 31. De Saint-Basile G, Le Deist F, De Villartay JP,
et al. Restricted heterogeneity of T lymphocytes in combined immunodeficiency with hypereosinophilia (Omenn’s syndrome). J Clin Invest 1991; 87: 1352–1359.
32. Brugnoni D, Notarangelo LD, Sottini A, et al. Development of autologous, oligoclonal, poorly functioning T lymphocytes in a patient with autosomal recessive severe combined immunodeficiency caused by defects of the Jak3 tyrosine kinase. Blood 1998; 91: 949–955.
33. Cohen JA, Barkhof F, Comi G, et al. Oral fingolimod or intramuscular interferon for relapsing multiple sclerosis. N Engl J Med 2010; 362: 402–415. 34. Francis G, Kappos L, O’Connor P, et al. Temporal
profile of lymphocyte counts and relationship with infections with fingolimod therapy. Mult Scler 2014; 20: 471–480.
35. Eyrich M, Croner T, Leiler C, et al. Distinct contributions of CD4(+) and CD8(+) naive and memory T-cell subsets to overall T-cell-receptor repertoire complexity following transplantation of T-cell-depleted CD34-selected hematopoietic progenitor cells from unrelated donors. Blood 2002; 100: 1915–1918.
36. Nakamura M, Matsuoka T, Chihara N, et al. Differential effects of fingolimod on B-cell
populations in multiple sclerosis. Mult Scler 2014; 20: 1371–1380.
Visit SAGE journals online http://msj.sagepub.com