RELATIONSHIP BETWEEN BOARD
STRUCTURE VARIABLES AND
PERFORMANCE OF LISTED
MANUFACTURING FIRMS IN NIGERIA
Yusuf Ismaila Mustapha
University of Ilorin, Nigeria
Abdulrasaq Ishola Nafiu
Federal Polytechnic Offa,Nigeria
Received: April 23, 2016 Accepted: April 28, 2017 Online Published: September 25, 2017
Abstract
Corporate board structure has been at the center of policy debate concerning their relevance to organisation’s performance in recent times. Since the value creation of corporate governance can be measured through firm performance, this study investigates the relationship between board size, board composition, CEO-duality and performance of listed manufacturing firms in Nigeria. Content analysis was used to collect secondary information from the thirty listed firms that met the requirement for selection as sample between 2006 and 2010 from Nigerian stock exchange Fact Books. Panel data regression techniques were employed as analytical instrument to test the study hypotheses. Findings of the study revealed that board sizes is positively related to ROA but negatively related to ROE performance variables. The study recommends that firms should appoint more of outside directors (NEDs) than inside executive directors to enable it to maximize the benefits of board independence as well maintain a two-tier board structure.
Keywords: board structure, board size, board composition, ceo-duality, listed manufacturing firms, performance.
1. Introduction
The board of directors is the highest governing authority within the management structure in any publicly traded company. The role of the board in overseeing how management serves the long-term interests of shareholders and other stakeholders is at the core of corporate governance. However, skeptics often question whether or not corporate boards contribute to the effective performance of organisations because their day-to-day effect is difficult to observe, except, when things go wrong in organisations, then corporate boards becomes the center of
attention. Certainly, this was true situation of the scandals in Enron in 2001, WorldCom in 2002 both in the US, and Parmalat of Italy in 2003. The directors of Enron and WorldCom, in particular, were held liable for the fraud that occurred. As a consequence of these scandals and the ongoing concerns about corporate governance, corporate boards have been at the center of the policy debate concerning their relevance to organisation’s performance. In recent years, the discussion has focused on the structure of the board of directors, the most outstanding corporate governance mechanism of the internal control systems (Jensen, 1993).
A number of studies such as Gompers, Ishii and Metrick (2003) and Kyereboah–Coleman (2007) have shown that good corporate board structure put in place by the board increases valuation and boost firm’s performance. In Nigeria, corporate governance has been gaining roots and several initiatives, structures and institutions designed to address corporate governance issues have been established. These include the Companies and Allied Matters Act 1990 (CAMA, 1990), and the Nigeria Security and Exchange Commission, which established the corporate governance codes in 2003 and 2011 that provides the modalities for corporate board structure in Nigerian firms among others.
Most developing countries such as Nigeria, are now increasingly embracing the concept of good corporate governance as a means to sustainable growth and development. However, in the context of Sub-Saharan Africa, the issue has received very limited empirical research attention. The provisions of the Nigerian Security and Exchange Commission Codes (NSEC Codes, 2003 and 2011) are aimed at promoting accountability and transparency with a deliberate attempt to streamline corporate practices which are thought to increase firm performance and cater for stakeholders’ interests. For instance, the code stipulates a minimum of five directors with appropriate mix of corporate board executive and non-executive directors (NEDs) and the separation of the position of Chief Executive Officer (CEO) from that of the board Chairman (NSEC Code of Corporate Governance, 2003, 2011). The expectation is that adherence to these guidelines by boards will improve firm’s performance. However, whether firms following these recommendations regarding board structure will indeed perform better is a question to be examined empirically in the Nigerian context. This is the central focus of this study.
Secondly, studies conducted on the relationship between board structures variables and firm performances are mostly on developed economies and have produced conflicting results. It is against these backgrounds that the present study empirically examines the relationship between board structure variables of board size, board composition, CEO-duality and performance of listed manufacturing firms in Nigerian Stock Exchange (NSE). On the basis of this, the study specifically seeks to answer the following questions: Is there any relationship between board size, board composition and firm performance? and does separation of the post of CEO and board Chairman promote firm’s performance?
The main objective of this study is to examine the relationship between board structure variables and firm performance of Nigerian listed manufacturing firms. The specific objectives of this study are to: i. determine the relationship between board size, board composition and firm performance; ii. investigate whether or not separation of the post of CEO and board Chairman promote firm’s performance.
In line with the above objectives, the study postulated that:
H01: There is no statistical relationship between board size and firm performance.
H02: There is no statistical relationship between the percentages of NEDs (Board
composition) and firm performance.
The current study on the relationship between corporate board structure variables and performance of listed manufacturing firms in Nigeria is significant for several reasons. First, Nigeria arguably offers an interesting research context where the corporate board structure variables-performance relationships can be empirically examined in view of the conflicting empirical reports on the relationship between corporate board structure variables and firm performance in the extant literature (Sanda et al 2005; Olayinka 2010; Haniffa & Hudaib, 2006). Unlike most African countries, Nigeria has deep equity culture comparable with those of other emerging economies. For instance, Nigeria is one of the largest emerging stock market in Africa, with highest market capitalization in West African countries in 2010 (WDI, 2010). Similarly, market capitalization of listed companies in Nigeria amounted to about $56.3m in 2012 (The World Bank, 2013).
Arguably, these performances offer exciting research context, where the corporate board structure variables-firm performances nexus can be empirically investigated. The second significance of this study is that despite offering exciting research context, there is a dearth of rigorous empirical research on Nigerian firms, which attempts to ascertain whether better-governed Nigerian listed firms tend to be associated with higher financial returns than their poorly-governed counterparts (Okeahalam & Akinbode 2003, Okeahalam 2004). Therefore, the paucity of rigorous empirical corporate governance studies on Nigeria offers opportunities to make contributions to the extant literature in this area.
2. Literature review
2.1. Conceptual clarifications
The concept of “corporate governance” has attracted various definitions in the literature. Cadbury Committee (1992) defines corporate governance as the system by which companies are directed and controlled. Deakin and Hughes (1997) define corporate governance as the relationship between the internal governance mechanisms of corporations and society’s conception of the scope of corporate accountability. This position was buttressed by (Sarbah & Xiao, 2015) when they opined that corporate governance is the structures and processes for the direction and control of businesses and the relationships among the management, board of directors, controlling shareholders, minority shareholders and other stakeholders (Sarbah & Xiao, 2015). Corporate governance is also seen as the whole set of measures taken within the social entity (i.e., enterprise) to favour the economic agents to take part in the productive process, in order to generate some organization surplus, and to set up a fair distribution between the partners, taking into consideration what they have brought to the organization (Sanda et al, 2005).
In the light of the foregoing, we may state that corporate governance has no universally accepted definition. It is therefore suggested that the existing numerous definitions can be classified into two groups: narrow and broad. At the narrow level, corporate governance refers to the internal governance structures; such as the executive management, the board of directors and the general assembly of shareholders, by which companies are directed and controlled. At the most expansive form, it can be contended that corporate governance goes beyond immediate internal governance mechanisms to include external structures and stakeholders, such as the legal system, the efficient factor markets, local communities, the regulatory system, as well as the political, cultural and economic institutions within which companies operate (Ntim, 2009). In summary, the aim of corporate governance according Cadbury (1992) is to facilitate efficient use of resources by reducing fraud and mismanagement with a view to maiximising and aligning the often conflicting interests of all the stakeholders in the organization.
2.2. Theoretical Framework
The two theories that were considered relevant to this study are briefly discussed below. These theories are agency theory and stewardship theory.
2.2.1. Agency Theory
Agency theory describes a fundamental agency problem in modern firms where there is a separation of ownership and control. In agency theory, the agent may be succumbed to self-interest and opportunistic behavior falling short of congruence between the aspirations of the principal and the agent’s pursuits (Abdullah & Valentine, 2009). The theory is generally concerned with how to align the conflicting interests of principals and agents (Jensen & Meckling, 1976; Fama, 1980). Specifically, it suggests that the principal can limit divergences from his/her interests by establishing appropriate incentives or control mechanisms (corporate board structure) to monitor managers in order to limit the incidence of opportunistic action by the agent (Jensen & Meckling, 1976). The control mechanism is to allow for more effective ways of supervising and monitoring of the CEO and it is on the basis of this, that agency theorists believed that it is essential to separate the chairman of the board and the CEO positions (Peng et al, 2007). The assumption of the theory is that the separation of the CEO and the chairman keeps managerial opportunism under control because the chairman of the board is independent of the CEO. The chairman of the board can use incentives to align the interests of the CEO with those of the shareholders (Donaldson & Davis, 1991, Chen, 2014;). These theorists also expresses that CEO duality is negatively related to firm performance (Peng et al, 2007).
2.2.2. Stewardship Theory
Stewardship theory posits that executive managers are intrinsically trustworthy individuals (Kiel and Nicholson, 2003). As such, managers should be fully empowered to run firms because they are good stewards of the resources entrusted to them (Letza, Sun & Kirkbride, 2004). The stewardship theory suggests that due to their information and knowledge advantages, giving greater managerial power and trust to managers of firms is likely to lead to better performance. Stewardship theorists proclaimed that managers’ knowledge lead to better decision, reduced agency costs and improved firm’s performance (Donaldson & Davis, 1994; Fama, 1980; Fama & Jensen, 1983). As a result, proponents of stewardship theory contend that better firm performance are likely to be associated with internal corporate governance practices that grant managers greater powers, such as combining the positions of company chairman and Chief Executive Officer (i.e. duality) according to Donaldson & Davis (1991) and (1994). CEO-duality refers to a board leadership structure in which one person undertakes the combined roles of chief executive officer (CEO- management) and chairman (control) of the board.
Stewardship theory proposes that role duality can have a positive impact on firm financial performance. Firstly, Weir and Laing (2002) contend that as an insider, the CEO tends to have greater knowledge, understanding and experience of the strategic challenges and opportunities, which the company faces, than a non-executive chairman. Secondly, it has been argued that role duality grants a charismatic CEO the opportunity to have a sharper focus on firm objectives (Haniffa & Hudaib, 2006). This implies that a visionary CEO will have the chance to shape the long-term fortunes of a firm with minimum board interference (Haniffa & Cooke, 2002). This may lead to improved performance due to the rapid management decision making that arises from the provision of clear and unambiguous corporate leadership (Haniffa & Hudaib, 2006). Thirdly, Vafeas and Theodorou (1998) suggest that role duality avoids extra compensation to the chairman, which can results in a reduction in managerial remuneration. Finally, Bozec
(2005) argues that unified firm leadership associated with role duality improves managerial accountability as it makes it easier to charge the blame for poor performance.
The above two theories were adopted for this study in line with the postulations that agency theory aligns the conflicting interests of the principals with that of the agents, while, stewardship theory believes that managers possess resourceful information and knowledge and are trusty worthy to run corporate organization effectively and this may have relationship with firm performance. In the view of the conflicting propositions in the theories, this study adopted agency theory for board structure and board composition, while stewardship theory was adopted for CEO duality. The adoption of the two theories is due to the fact that they are more germane and appropriate to the variables of interest in this study.
2.3. Empirical Framework
2.3.1. Empirical evidences on board size and firm performance
Empirically, the evidence regarding the association between board size and firm performance is conflicting (Yermack 1996; Adams & Mehran 2005; Guest 2008). Yermack (1996) investigated the relationship between board size and firm performances of 452 large US industrial corporations between 1984 and 1991. He reported an inverse relationship between corporate board size and firm performance (Tobin’s Q). His analysis however, focused purely on large US firms. In contrast, Sanda et al. (2003) in a sample of 93 firms, studied the effect of corporate governance mechanism on firm performance of listed firms in Nigeria between 1996 and 1999 and found a positive correlation between board size and profitability, proxied by return on equity (ROE). Their sample however consisted of financial and non-financial firms. Analysing financial and non-financial firms together may distort the outcome of the results in view of the fact that financial institutions operate under a special regulatory environment which may mask the efficiency differences across firms, and may potentially render governance mechanism less important (Vafeas & Theorodou, 1998; Singh & Davidson, 2003). The work of Kajola (2008) also examined the relationship between corporate governance and firm performance in a sample of twenty listed firms in Nigeria between 2000 and 2006. He reported that board size have no significant relationship with profit margin.
The SEC code of corporate governance provides that all public companies must have a minimum of five directors (SEC code 2003). The SEC provisions did not set maximum board size neither did it specify the exact number of directors that should form a board. However, it sets out general principles that the board should be of sufficient size relative to the scale and complexity of the company’s operation. This suggests that SEC code admit that a company’s board size may probably affect its performance. Given the mixed evidences and the provision of SEC code on board size, the null hypothesis that was tested in this case is that: There is no statistically relationship between board size and firm’s performance.
2.3.2. Empirical Evidences on the Board Composition and Firm Performance
Prior empirical evidences regarding the relationship between the percentage of NEDs (board composition) and firm performance is also mixed. A strand of the empirical studies reported that boards dominated by NEDs deliver higher performance. In a study of Governance Structure, Director Independence and Corporate Performance of a sample of 311 UK listed firms from 1994 to 1996, Wier and Laing (2002) reported a positive relationship between the percentage of NEDs and firm performance (Tobin’s Q). While, researchers such as Yermack (1996), Agrawal and Knoeber (1996), and Bozec (2005) reported that the percentage of NEDs is negatively related to firm performance. For instance, Sanda et al. (2008) studied the effect of board independence on firm performance in a sample of 89 firms on the Nigerian Stock
Exchange between 1996 and 2004 and reported that firms with a low percentage of outside directors (NEDs) performed better than those with more NEDs. Again, their analysis suffered from the same defect as those of their earlier work which analyses both financial and non-financial firms together.
The provisions of the SEC codes require every listed company to appoint at least one independent NEDs (SEC code 2003). It provides that such a NED should have no contractual relationship with the company and should be free from company’s business relationship which could materially interfere with his/her capacity to act in an independent manner. This shows that NEDs should be independent of the management to ensure that minority interests are adequately protected and shareholders’ wealth increased. Given the mixed evidence, the null hypothesis that was tested in this case is that: There is no statistically relationship between the percentage of NEDs (board composition) and firm performance.
2.3.3. Empirical Evidences on the CEO-duality and Firm Performance
Evidences regarding the relationship between CEO-duality and firm performance are mixed (Rechner & Dalton 1991; Brickley, Coles & Jarrell, 1997; Weir & Laing, 2002). Rechner and Dalton (1991) investigated the relationship between CEO-duality and firm performance of 141 large American corporations (Fortune 500 firms) from 1978 to 1983. They reported that companies with separate board chairman and CEO positions consistently outperformed those with CEO-duality. Their results have been criticized on the grounds that they failed to control for firm specific characteristics such as firm size (Donaldson & Davis, 1991) and that they focused purely on large American firms. In contrast, Sanda et. al (2003) found a negative relationship between CEO-duality and Tobin Q in Nigeria listed firms. Also, Olayinka (2010) reported a strong negative relationship between CEO-duality and firm performance in Nigeria listed firms. However, the results of the study of Olayinka (2010) were not reliable because the analysis was single-year based and the technique of estimate was not potent in handing panel data variables.
The SEC provisions on CEO-duality states explicitly that the positions of the chairman and the CEO should not be held by the same individual (NSEC code, 2003 & 2011). This is to avoid over concentration of power in one individual which may rob the board of the required check and balances in the discharge of its duties. This suggests that SEC codes recognised CEO-duality as an undesirable development, while role separation is seen as good corporate governance practice. However, the prior literature evidences are mixed. Given these conflicting evidences therefore, the null hypothesis that was tested in this case is that: There is no statistical relationship between CEO-duality and firm performance.
From the review of the literature on the relationship between Board Structure Variables and performance there appears to be visible gaps. First, most of the researches conducted in this area are focused on developed economies and the researches outcomes are conflicting. Second, several countries, Nigeria inclusive, have issued guidelines and recommendations for best governance practices especially on board structure (Cadbury, 1992 NSEC Code, 2003 and 2011). The expectation is that adherence to these guidelines by boards will improve firm performance. However, whether firms following the best practice recommendations regarding board structure will indeed perform better is a question to be examined empirically especially in the Nigerian context. These situations present identified gaps and provide opportunity to conduct a study in this area with a focus on Nigerian listed manufacturing firms.
3. Methodology
3.1. Population, Sample Size and Sampling Technique
The population of this study comprises of 57 listed manufacturing firms operating in different sectors of Nigerian Stock of Exchange. The choice of listed firms in this sector was based on the fact that the records of these classes of firms are expected to be organized, readily available and meets the corporate governance standard (Daniel, 2005). More so, listed firms were adopted as the study population because other studies such as Sanda, et al (2003) and Patrick (2012) used listed firms in their respective studies. The sample firms to be selected must have been listed on the floor of Nigerian Stock Exchange market not later than 2006. The year of listing is a fundamental requirement for firms that were selected as samples in this study. The choice of the selected firms and sector is informed by the availability of data and firms’ annual reports for a period of ten years under review. This is due to the fact that it is only the firms that were listed as at year 2006 that can provide the required data. Thirty manufacturing firms that met this requirement were purposively selected as samples out of a population of 57 manufacturing firms listed on the floor of Nigerian Stock Exchange. Hence, purposeful sampling technique was adopted in this study.
3.2. Data and Source
This study basically used secondary data collected from the annual reports of 30 listed manufacturing firms on the floor of Nigerian Stock Exchange (NSE). Data for the study covers eight-year period from 2006 to 2013. The board structure variables and firm performance data were obtained from NSE Fact book (2011/12 and 2014) and company websites.
3.3. Model Specification
The methodological approach adopted in examining the relationship between the board structure variables and firm performance is panel data multiple regression analysis because of its advantages over the conventional time series approach according to Hsiao (2003) and Klevmarken (1989). Thus, panel data regression technique was used to analyse the data. Fixed effects and random effects regression models were run in addition to the Pooled OLS regression model. Panel data regression model was adopted because our data set are both cross-sectional and time series in nature. There are multiple entities, each of which has repeated measurements at different time periods and these may have group effects, time effects, or both, which are analyzed by fixed effect and random effect models (Oscar, 2007).
Consequently, the study employs a modified version of the econometric model of Miyajima, Omi and Saito (2003) which is given as:
Yit = β0 + β1git +β2 cit + eit...(1)
Where Yit represents firm performance variables (dependent variables); Return on Assets
(ROA), and Return on equity (ROE) for firm i in time t. Git is a vector of corporate governance
variables (independent variables); Board size (bds), Board Composition (bdc) and a dummy variable of 1 (CEO) to capture if the board chairman is the same as the Chief Executive Officer (CEO) and 0 otherwise. Cit is a vector of control variables: size of the Firm (fz), leverage (lev),
representing the debt structure of these firms, firms’ probability is (pro) and firms’ age (age) is a proxy for firm complexity in the sector while eit , is the error term. The essence of the control
variables is to give recognition to the fact that the performance of listed firms may be influenced by several factors. The fixed effects and random effects options of panel regression were also run in addition to the pooled regression.
From the above discussions, equation 1 is specified as follows:
yit = b0 + b1git + b2cit + eit...(2)
yit = (roa, roe), representing the dependent variables.
Git = (bds, bdc, ceo) representing the independent variables.
Cit = (fz, pro, lev, age) representing the control variables.
eit = the error term.
Thus the expanded form of equation 2 and 3 are specified as:
roait = bo+b1bdsit+b2bdcit+b3ceoit+b4proit+b5fzit+b6levit+b7ageit+eit...(3)
roeit = bo+b1bdsit+b2bdcit+b3ceoit+b4proit+b5fzit+b6levit+b7ageit+eit...(4)
The individual fixed effect equations which capture the individual characteristics that are specific with each firm but do not change over time is given as:
roait = bi+b1bdsit+b2bdcit+b3ceoit+b4proit+b5fzit+b6levit+b7ageit+eit...(5)
roeit = bi+b1bdsit+b2bdcit+b3ceoit+b4proit+b5fzit+b6levit+b7ageit+eit...(6)
where bi is the fixed effect parameter that can be estimated directly.
The apriori expectation of the signs of the parameter estimates are: i. For return on asset (roa), b1, b2, b3 <0, b4 – b7> 0.
ii. For return on equity (roe), b1, b2, b3 <0, b4 – b7 >0.
3.4. Estimation Techniques
Several estimation techniques were used to estimate firm financial performance in the models. These included the Pooled Ordinary Least Square (OLS), the Fixed and Random Effects. The Hausman specification test was performed to decide a preferred option between the fixed and random effect as deemed necessary. Thereafter, the Breusch-Pagan Langrange Multiplier (LM) test was carried out to decide a preferred estimate between Pooled OLS and Random effect estimates in the case of the ROE. The result of the test was insignificant indicating that, the Random effect is a preferred estimate for the study.
4. Data Analysis and Discussion
Various options of the panel regression were run; fixed effects, random effects and the pooled OLS regressions. The results of the panel regressions were presented in the subsequent sections starting with the descriptive statistics.
4.1. Variable Definitions and Measurement
Table 1 – Variable Definitions and Measurement Variable Definition Measurement
ROA Return on Assets Earnings before interest and tax payments divided by total
assets.
ROE Return on Equity Earnings before interest and taxes by share-holders’ funds.
BDS Board size Total number of members serving on a board BDC Board composition Ratio of outside directors to total number of directors (NEDs).
CEO Ceo-duality A dummy variable, taking a value of 1 for firms with CEO as chair, and 0 otherwise.
Fz Firm size Natural Log of total asset.
Pro Profitability Ratio of Earnings Before interest and Taxes to total assets Lev Leverage Ratio of total debt to total assets.
Age Firm Complexity Number of years the firm has been in operation. Source: Authors’ compilation
4.2. Descriptive Statistics
This section presents the descriptive statistics of the mean, the median, the maximum, minimum and the standard deviation of the variables under investigation.
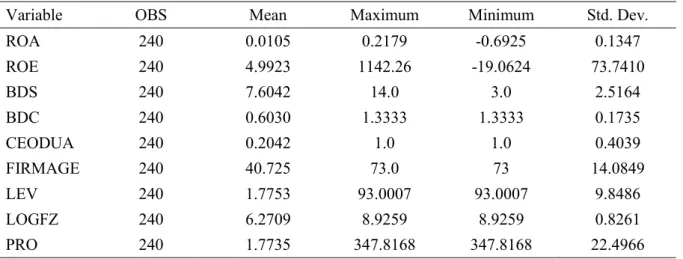
Table 2 – Descriptive Statistics
Source: Stata Panel Data Regression Output.
The descriptive statistics of dependent, independent and control variables of the relationship between board structure variables and firm performance is presented in table 2. From the table, the mean board size is about eight (8) suggesting that manufacturing firms listed on the Nigerian Stock Exchange (NSE) have relatively moderate board sizes. There is a maximum board size of fourteen (14) and standard deviation of 2.52, implying that manufacturing firms in Nigeria have relatively similar board sizes. On the board composition, Nigerian manufacturing firms are relatively less independent. This is indicated by the relatively high proportion of NEDs (60.3%) on the corporate boards being appointed from outside the firms. Out of all the firms studied, about 79.6% of them adopted the 2-tier board structure implying that only about 20.4% of the firms have their CEOs and Board chairman positions
Variable OBS Mean Maximum Minimum Std. Dev.
ROA 240 0.0105 0.2179 -0.6925 0.1347 ROE 240 4.9923 1142.26 -19.0624 73.7410 BDS 240 7.6042 14.0 3.0 2.5164 BDC 240 0.6030 1.3333 1.3333 0.1735 CEODUA 240 0.2042 1.0 1.0 0.4039 FIRMAGE 240 40.725 73.0 73 14.0849 LEV 240 1.7753 93.0007 93.0007 9.8486 LOGFZ 240 6.2709 8.9259 8.9259 0.8261 PRO 240 1.7735 347.8168 347.8168 22.4966
combined in one person. This suggests that avenue for agency problems emanating from conflict of interest and agency costs are minimized to the barest level. This is likely to enhance firm performance. On the average, the descriptive statistics shows that most of the manufacturing firms appear not to be doing well with regards to ROA as a performance variable with a mean ratio of 0.01. The implication of this is that most of the manufacturing firms do not break–even on this front indicating that they might not be effectively and efficiently utilizing their assets. The profitability ratio at a mean ratio for the firms is 1.77. This figure might be as a result of the good performance of the firms as indicated by the ROE performance measure. The firms generally depended more on debt equity financing as indicated by the highly leverage figure of 177.53. The firms have similar sizes of 7.6 on the average.
On the whole, the ROE seems to perform better than the ROA measure of performance in the descriptive analysis. The ROE had a mean of 499.23% compared to ROA performance mean of 0.01% over the period of study. On the whole the ROE performance measure come out better in the descriptive statistics, while the ROA performance measure come out poorly as will be further shown in the regression output of the overall significance of the regression analysis. 4.2. Presentation of Results
This section presents the regression results of the relationship between return on assets (ROA) and the board structure variables as well as that of the interaction between return on equity (ROE) and the board structure variables. First, we present the discussion on the relationship between the board structure variables and return on asset (ROA).
Table 3 – Regression Results of ROA
Variables Pooled OLS Fixed Effect Random Effect
Constant -0.0816 (0.0731)* -0.5632 (0.2078)* -0.1618 (0.1018) BDS 0.0102 (0.0044) -0.0060 (0.0069) 0.0057 (0.0048) BDC -0.0807 (0.0589) -0.0270 (0.0616) -0.0249 (0.0570) CEO-dua -0.0020 (0.0220) -0.0162 (0.1251) -0.0040 (0.0343) LEV 0.0004 (0.0009) -0.0002 (0.0009) -0.0001 (0.0008) FZ 0.0186 (0.0114) 0.0386 (0.0331) 0.0295 (0.0163)*** AGE -0.0013 (0.0006)** 0.0097 (0.0059)*** -0.0010 (0.0010) PRO 0.0001 (0.0004) 0.00005 (0.0004) 0.0000 (0.0004) R2 0.0636 0,0068 0.0555 F 2.25* 19.4 insignificant
Prob Chi2 7.73 insignificant
Significant at (1%)*, (5%) **, (10%)***, Standard error in parenthesis. Source: Stata Panel Data Regression Output.
Table 3, shows the regression results of the relationship between Return on Asset (ROA) and the board structure variables. The results generally show that the ROA perform poorly as indicated by the overall insignificance of the F- Statistics for both the FE and RE regression results for the variables of interest and ROA. Consequently, our discussion focused attention on the Pooled OLS regression result as presented in table 2.
The Pooled OLS regression results indicated that contrary to studies by Jensen (1993), Lipton and Lorsch (1992) and Sanda et. al. (2003), the board size is positively related to ROA implying that the larger the size of the board, the better the ROA. This result confirms the findings of the studies that supported the view that larger boards are better for corporate performance because members have a range of expertise to help make better decisions, and this may make it harder for a powerful CEO to dominate the board.
The board composition has a negative relationship with ROA implying that when there are less external board members, performance of the firm tends to be worse. This finding is also consistent with the finding of the study by Agrawal and Knoeber (1996) which suggested that boards expanded for political reasons often result in too many outsiders on the boards, which does not help performance. A group of researchers such as Yermack (1996), Agrawal and Knoeber (1996) and Bozec (2005) also reported that the percentage of NEDs is negatively correlated with performance. In a sample of 25 Canadian firms from 1976 to 2005, Bozec (2005) found that the relationship between the percentage of NEDs and performance is negative. The study’s finding also contradicts the results of other empirical studies such as Brickley and James (1987) and Brickley et al. (1994) on outside director’s value in supporting the beneficial monitoring and advisory functions to firm’s shareholders.
With respect to CEO-duality, the results suggest that CEO-duality is negatively related to ROA and that when a CEO doubles as the board chairman, ROA decreases. This result is consistent with studies which have found out that the one-tier board structure type leads to leadership facing conflict of interest and agency problems, (Berg & Smith 1978, Brickley & Coles 1997). In the context of a developing country, the study of Sanda et al. (2003) found no relationship between firm performance and separating the functions of the CEO and Chairman and thus gave preference to one-tier board structure. In contrast however, the result of this study buttresses the fact that there is need to have a clear separation between the positions of board chairman and CEO as indicated by the negative relationship between CEO and ROA performance variables in table 3 above. As expected, the study found that firm size has a positive relationship with ROA, though not significant. This means that the size of a firm, measured by its asset base, could lead to better performance if put to efficient use. The implication therefore is that most of the firms are utilizing their size to enhance performance.
The positive coefficient in the Pooled OLS regression for total debt (LEV) could be interpreted to mean an increase in debt is associated with increase in performance. This probably implies that firms that have huge proportions of debt perform better. This confirmed the findings by Hadlock and James (2002), and Petersen and Rajan (1994), which posited that profitable firms use more debt to finance their operations. This position is further supported by the positive relationship between profitability and leverage with ROA in the Pooled OLS regression as indicated in table 3.
Table 4 is the regression results of the relationship between ROE and the board structure variables. As could be seen in table 5, the overall regression results for the FE, RE and Pooled OLS are all significant at 1%. Consequently, there was the need to perform the Hausman Specification Test and Breusch Pagan Langrange Multiplier Test to determine a preferred estimate between the three regression estimates. The hausman test indicated that RE is a preferred estimate to FE model. Therefore, there was the need to perform the Breusch Pagan
test to decide a preferred estimate between the RE and Pooled OLS estimates. The results of the Breusch Pagan test showed that RE is a preferred estimate. The discussion below is therefore based on the RE regression estimate.
Table 4 – Regression Results of ROE
VARIABLES Pooled OLS FE RE
Constant -15.9947 (3.0465)* -41.23859 (8.6850) -20.1692 (4.0147)* BDS -0.1051 (0.1840) (0.2868)* 0.0979 (0.2018) -0.0828 BDC 0.2134 (2.4556) -4.7638 (2.5743)* -1.5964 (2.4334) CEO-dua 0.9949 (0.9162) 1.6122 (0.5.2286) 1.3235 (1.3152) LEV 0.0486 (0.0381) 0.0664 (0.0358)* 0.0560 (0.0364) FZ 1.9027* (0.4760) 8.5231 (1.3854) 2.7010 (0.6427)* AGE 0.0896 (0.0259)* (0.2449)* -0.2783 (0.0381)* 0.0897 PRO 3.2624* (0.0160) 3.2695 (0.0149)* 3.2675 (0.0152)* R2 0.9946 0.9847 0.9945 Prob Chi2 4675* F 6072* 6960.8*
Hausman Test 6.08 insignificant
RE preffered to FE
Breusch Pagan Test 15.33* RE
Preffered to OLS Significant at (1%)*, (5%) **, (10%)***, Standard error in parenthesis.
Source: Stata Panel Data Regression Output.
Based on RE regression estimate, the board size is negatively related to ROE. This result is consistent with findings of the studies by Jensen (1993), and Lipton (1992) who argued that larger boards are less effective and are easier for the CEO to control. When a board gets too big, it becomes difficult to co-ordinate. Further argument is that smaller boards also reduce the possibility of free riding by individual directors, and increase their effectiveness in decision making processes. Some other empirical studies also supported this position. For example, Yermack (1996) documents that, for large U.S. industrial corporations, the market places higher values on firms with smaller boards. Again, Sanda et al. (2003) found that, firm performance is positively related to small, as opposed to large board size.
On board composition, ROE is negatively related to board composition. This result supports the findings of earlier studies (Sanda et al, 2003; John & Senbet, 1998) which showed a negative relationship between board composition and ROE. The implication of a negative relationship between board composition and ROE is that fewer outside directors are on the board and hence the board might be less independent. This is capable of jeopardizing the performance of the firm. The argument is that boards of directors are more independent as the
proportion of outside director’s increase and this position is more favoured and cherished by shareholders.
Regarding CEO-duality, the results point to a positive relationship between the ROE performance measure and the two-tier board structure in which case separate persons occupies the position of board chairman and CEO. This result is not consistent with the findings of other empirical studies such as Fama and Jensen (1983) who argued that the concentration of decision management and decision control in one individual reduces boards’ effectiveness in monitoring top management and tends to increase agency costs because it depicts a clear case of possibility of conflict of interest and hence could lead to agency problems.
Profitability (PRO) and the debt structure (LEV) are both positively related to ROE. This finding suggest that the studied firms relied on debt and tend to perform better in view of the fact that profitability and leverage variables are both positive and significantly related to ROE in the random effect (RE) regression estimates. Thus, manufacturing firms under this study should lean towards having more debts to finance their operations. Firm size is positively related to ROE and this shows that the studied manufacturing firms will benefit if they increase their sizes to enjoy economies scale.
Comparatively, the findings of the current study is consistent with the findings of the works of Eisenberg et al. (1998) and Bozec, (2005) which were conducted in USA and United Kingdom respectively and found a negative relationship between performance-related top-management turnover and board size. However, it contradicts the findings of the works of Beiner et al. (2006) and Henry (2008) that independently reported similar statistically significant and positive relationship between board size and the Q-ratio for Swiss and Australian listed firms respectively.
Furthermore, Chahine and Tohmé (2009) and Kiel and Nicholson (2003) conducted their studies in USA, Middle East and North African countries respectively and discovered that underpricing is significantly higher among firms that have CEO duality and that firms with separate board chairpersons consistently outperformed those with CEO duality. However, the works of Kiel and Nicholson (2003) found that CEO duality impacts positively on the financial performance of Australian listed firms.
Gupta and Fields (2009) conducted their study in USA and found that there is positive relationship between NED and firms’ financial performance, while the studies of Bozec (2005) and Haniffa and Hudaib (2006) which were conducted in Canada and Malaysia reported a statistically insignificant negative relationship between the percentage of NEDs and firms’ performance.
5. Conclusion and recommendations
5.1.Conclusion
This study draws the following conclusion from its findings: That the board sizes of the studied quoted manufacturing firms are positively related to ROA and negatively related to ROE performance variables. Also, the board structure composition variables of quoted manufacturing firms are negatively related to both performance measurements of ROA and ROE and that CEO duality of quoted manufacturing firms is negatively related to ROA and positively related to ROE.
5.2.Recommendations
Based on the findings of this study, the following recommendations are made for efficient performance of quoted manufacturing firms and other similar organisations:
i. maintenance of smaller board sizes that hovers around eight members (8) is critical to the success and survival of corporate firms in Nigerian while firms should also increase their size through increase in total assets and put these to efficient use in order to enjoy economies of scale.
ii. firms should make appointment of outside directors (NEDs) to dominate the appointment of inside executive directors so as to enable the firms to maximally reap the benefits of board independence.
iii. the position of Board Chairman and that of the Chief Executive Officer should be separated in order to protect the interests of the shareholders and guard against managerial opportunism
5.3. Suggestions for future research
There is need to extend the scope of the study to cover listed firms in Africa Stock Exchange Market. Therefore, further study can examine corporate governance and performance of listed firms from African Stock Exchange Markets. A study of this nature may improve current understanding of the internal board structure variables-financial performance association across different African markets. Secondly, studying other sectors of Nigeria economy would also advance and expand our knowledge of the subject matter. Consequently, we suggest that future studies should pay attention to organizations in other sectors of Nigeria economy. Thirdly, a way to improve on the current study is for that future studies to increase the sample size (i.e. number of firms) and extend the scope (i.e. number of years).
References
1. Abdullah, H. & Valentine, B. (2009). Fundamental and ethics theories of corporate governance Middle Eastern Finance and Economics, 4, 1450-2889.
2. Adams, R. B., & Mehran, H. (2005). Corporate governance, board structure and its determinants in the banking industry, Working Paper, Federal Reserve Bank of New York. Retrieved from http://papers.srn.com/so13/papers.cfm 16 (4), 454-464.
3. Agrawal, A., & Knoeber, C. R. (1996). Firm performance and mechanism to control agency problems between managers and shareholders, Journal of Financial and Quantitativ Analysis, 31, 377-397.
4. Beiner, S., Drobetz, W., Markus, M. & Zimmermann, H. (2006). An integrated framework of corporate governance and firm valuation, European Financial Management, 12, (2), 249-283. 5. Berg, S.V., & Smith, S.R. (1978). CEO and board chairman: A quantitative study of dual
versus unitary board leadership, 22 (6), 34-39.
6. Bozec, R. (2005). Boards of directors, market discipline and firm performance, Journal of Business Finance and Accounting, 32, (9 &10), 1921- 1960.
7. Brickley, J. A., Coles, J. L., & Jarrell, G. (1997). Leadership structure: Separating the CEO and chairman of the board, Journal of Corporate Finance, 3 (3), 189-220.
8. Brickley, J.A. & James, C.M. (1987). The takeover market, corporate board composition, and ownership structure: The case of banking, Journal of Law and Economics, Vol. 30, 161-181. 9. Brickley, J. A., Coles, J. L., & Terry, R. L. (1994). Outside directors and the adoption of
poison pills, Journal of Financial Economics, 35, 371-390.
10. Cadbury, (1992). Report of the Committee on the Financial Aspects of Corporate Governance. London: Gee Publishing.
11. Chahine, S. & Tohmé, N.S. (2009) Is CEO duality always negative? An exploration of CEO duality and ownership structure in the Arab IPO context Corporate Governance. An International Review, 17, 123–141.
12. Chen, H. (2014) CEO duality and firm performance: an empirical study of EU listed firms, 13. being a paper presented at the 3rd IBA Bachelor Thesis Conference, Netherlands.
14. Companies and Allied Maters Act 1990(CAMA, 1990).
15. Daniel, S. (2005). Efficiency of banks in regions at different stages of European integration process, Finance 0502020, ECOWPA.
16. Deakin, S & Hughes A. (1997). Comparative corporate governance: An interdisciplinary agenda. In S. Deakin and A. Hughes (Eds.), Enterprise and Community: New Directions in Corporate Governance, 95- 120. Oxford: Blackwell Publishers.
17. Donaldson, L., & Davis, F. (1991). Stewardship theory or agency theory: CEO governance and shareholder returns, Australian Journal of management, 16 (1), 18.
18. Donaldson, L. & Davis, J.H. (1994) Boards and company performance: Research challenges the conventional wisdom. Corporate Governance: An International Review, 2, 151-160.
19. Eisenberg, T., Sundregen, S. & Wells, M. (1998). Larger board size and decreasing firm value in small firms. Journal of Financial Economics, 48, 35-54.
20. Fama, E. F. (1980). Agency problem and the theory of the firm. Journal of Political Economy, 88, 288-300.
21. Fama, E. F., & Jensen, M. C. (1983). Agency problems and residual claims. Journal of Law and Economics, 26, 327-349.
22. Gompers, P., Ishii, L., & Metick, A. (2003). Corporate governance and equity prices. Quarterly Journal of Economics, 118, 107-155.
23. Guest, P. M. (2008). The determinants of board size and composition: Evidence from UK. Journal of Corporate Finance, 14, 51-72.
24. Gupta, M. & Fields, L. P. (2009). Board independence and corporate governance: Evidence 25. from director resignations. Journal of Business Finance and Accounting, Vol. 36, No 1 &
2, 161-184.
26. Haniffa, R. & Cooke, T.E. (2002) Culture, corporate governance and disclosure in Malaysian Corporations. Abacus, 38(3), 317-349.
27. Haniffa, R., & Hudaib, M. (2006). Corporate governance structure and performance of 28. Malaysian listed firms. Journal of Business, Finance and Accounting, 33 (7 & 8), 29. 1034- 1062.
30. Hadlock, C., James, C. (2002). Do banks provide financial slack? Journal of Finance, 57:1383-420.
31. Henry, D. (2008). Corporate governance structure and the valuation of Australian firms: Is 32. there value in ticking the boxes. Journal of Business Finance and Accounting, 35, No. 7
& 8, 912-942.
33. Hsiao, C. (2003). Analysis of panel data, (2ed ed.). Cambridge: England, Cambridge
University Press.
34. Jensen, M. C., & Meckling, W. H. (1976). Theory of the firm: Managerial behaviour, agency
35. costs, and ownership structure. Journal of Financial Economics, 3, 305-350.
36. Jensen, M. C. (1993). The modern industrial revolution: Exit and the failure of internal control systems. Journal of Finance, 48, (3), 831-880.
37. John, K & Senbet, L. W. (1998). Theory of the firm: managerial behaviour, agency costs and ownership structure. Journal of Banking and Finance, 45 (72), 43-47.
38. Kajola, S. O. (2008). Corporate governance and firm performance: The case of Nigerian listed Firms. European Journal of Economics, Finance and Administrative Science, 14(1), 34-41.
39. Kiel, G. C. & Nicholson, G. J. (2003). Board Composition and Corporate Performance: How the Austrian Experience Informs Contrasting Theories of Corporate Governance. Corporate Governance: An International Review, Vol. 11,(3), 189-205.
40. Klevmarken, N. A. (1989). Panel studies: What can we Learn from them? European Journal Economic Review, 33,523-529.
41. Kyereboah-Coleman, A., & Biekpe, N. (2007). Corporate governance and the performance of Microfinance Institutions (MFIs) in Ghana, Working Paper, UGBS, Legion.
42. Letza, S., Sun, X. & Kirkbride, J. (2004). Shareholding versus stakeholding: A critical review of corporate governance: An International Review, 12(2), 242-262.
43. Lipton, M. & Lorsch, J.W. (1992). A modest proposal for improved corporate governance. Business Lawyers, 48, 59-77.
44. Miyajima, H., Omi, Y., & Saito, N. (2003) Corporate governance and performance in twentieth century Japan. Business and Economic History, 1, 1-36.
45. Nigerian Securities and Exchange Commission (NSEC) Code of Corporate Governance, (2003 and 2011) Publication.
46. Nigerian Stock Exchange (2011/2012) Fact Book, The Nigeria Stock Exchange: Lagos. 47. Ntim, G. C.(2009). Internal corporate governance structures and firm performance:
Evidence from South African listed firms; A PhD
dissertation
al, University of Glasgow, Glasgow.48. Okeahalam, C. C., & Akinboade, O. A. (2003). A review of corporate governance in Africa: Issues and challenges, Paper Prepared for the Global Corporate Governance Forum, 23-26). Washington DC, USA.
49. Okeahalam, C.C. (2004). Corporate governance and disclosure in Africa: Issues and challenges. Journal of Financial Regulation and Compliance, 12 (4), .359 – 370.
50. Olayinka, M. U. (2010). The impact of board structure on corporate financial performance in Nigeria. International Journal of Business and management, 5 (10), 157.
51. Oscar, T.R.(2007). Panel data analysis, fixed and random effects using Stata. Retrivieved from http:// ss.princeton.edu/training/
52. Patrick, O.O. (2012). Product diversification and performance of manufacturing firms in Nigeria. European Journal of Business and Management, 4(7), 226-233.
53. Peng, M.W., Zhang, S. & Li, X. (2007). CEO duality and firm performance during China’s institutional transitions. Management and Organization Review, 3 (2), 205-255.
54. Petersen, M. A., & Rajan G. R. (1994), The benefits of lending relationships: Evidence from small business data. Journal of Finance, 48 (5), 34-37.
55. Rechner, P. L. & Dalton, D. R. (1991). CEO duality and organizational performance: A longitudinal analysis. Strategic Management Journal, 12(2), 155-160.
56. Sanda, A.U., Mukaila, A. S., & Garba, T. (2003). Corporate governance mechanisms and firm financial performance in Nigeria. Final Report Presented to the Biannual Research Workshop of the AERC (24-29). Nairobi, Kenya.
57. Sanda, A., Mikailu, A.S. & Garba, T. (2005). Corporate governance mechanism and firm financial performance in Nigeria. AERC Research paper 149, Nairobi: African Economic Research Consortium.
58. Sanda, A.U, A.S Mukaila & T. Garba (2008). Board independence and firm performance: Evidence from Nigeria. A Paper Submitted to the Centre for the Study of African Economy (CSAE) For Presentation at the CSAE Conference 2008 Titled Economic Development in Africa (16-18) St Catherine’s College, University of Oxford.
59. Singh, M. & W.N. Davidson III, (2003). Agency costs, ownership structure and corporate governance mechanisms. Journal of Banking and Finance. 27, 793- 816.
60. Sarbah, A. & Xiao, W. (2015). Good corporate governance structures: A must for family businesses.Open Journal of Business and Management, 3, 40-57.
61. Vafeas, N. & Theodorou, E. (1998). The relationship between board structure and firm performance in the UK. British Accounting Review, 30, 383-407.
62. Weir, C., & Laing, D. (2002). Governance structure, director independence and corporate performance in UK, European Business Review, 13(2), 86-95.
63. Yermack, D. (1996). Higher market valuation of companies with a small board of directors. Journal of Financial Economics, 40 (2), 185-221.