1 23
Bulletin of Engineering Geology and
the Environment
The official journal of the IAEG
ISSN 1435-9529
Bull Eng Geol Environ
DOI 10.1007/s10064-020-01925-5
Physical stratigraphy and geotechnical
properties controlling the local seismic
response in explosive volcanic settings: the
Stracciacappa maar (central Italy)
M. Moscatelli, G. Vignaroli,
A. Pagliaroli, R. Razzano, A. Avalle,
I. Gaudiosi, S. Giallini, M. Mancini,
M. Simionato, P. Sirianni, et al.
1 23
Commons Attribution license which allows
users to read, copy, distribute and make
derivative works, as long as the author of
the original work is cited. You may
self-archive this article on your own website, an
institutional repository or funder’s repository
and make it publicly available immediately.
ORIGINAL PAPER
Physical stratigraphy and geotechnical properties controlling
the local seismic response in explosive volcanic settings:
the Stracciacappa maar (central Italy)
M. Moscatelli1&G. Vignaroli1,2 &A. Pagliaroli3&R. Razzano1,4&A. Avalle1,5&I. Gaudiosi1&S. Giallini1,3&M. Mancini1&
M. Simionato1&P. Sirianni1&G. Sottili6&J. Bellanova7&G. Calamita7&A. Perrone7&S. Piscitelli7&G. Lanzo4
Received: 14 July 2019 / Accepted: 13 July 2020 # The Author(s) 2020
Abstract
Nowadays, policies addressed to prevention and mitigation of seismic risk need a consolidated methodology finalised to the assessment of local seismic response in explosive volcanic settings. The quantitative reconstruction of the subsoil model provides a key instrument to understand how the geometry and the internal architecture of outcropping and buried geological units have influence on the propagation of seismic waves. On this regard, we present a multidisciplinary approach in the test area of the Stracciacappa maar (Sabatini Volcanic District, central Italy), with the aim to reconstruct its physical stratigraphy and to discuss how subsoil heterogeneities control the 1D and 2D local seismic response in such a volcanic setting. We first introduce a new multidisciplinary dataset, including geological (fieldwork and log from a 45-m-thick continuous coring borehole), geophysical (electrical resistivity tomographies, single station noise measurements, and 2D passive seismic arrays), and geotechnical (simple shear tests performed on undisturbed samples) approaches. Then, we reconstruct the subsoil model for the Stracciacappa maar in terms of vertical setting and distribution of its mechanical lithotypes, which we investigate for 1D and 2D finite element site response analyses through the application of two different seismic scenarios: a volcanic event and a tectonic event. The numerical modelling documents a significant ground motion amplification (in the 1–1.5 Hz range) revealed for both seismic scenarios, with a maximum within the centre of the maar. The ground motion amplification is related to both 1D and 2D phenomena including lithological heterogeneity within the upper part of the maar section and interaction of direct S-waves with Rayleigh waves generated at edges of the most superficial lithotypes. Finally, we use these insights to associate the expected distribution of ground motion amplification with the physical stratigraphy of an explosive volcanic setting, with insights for seismic microzonation studies and local seismic response assessment in populated environments.
Keywords Local seismic response . Volcanic maar . 2D numerical simulations . Ground motion amplification . Sabatini Volcanic District . Italy
Electronic supplementary material The online version of this article (https://doi.org/10.1007/s10064-020-01925-5) contains supplementary material, which is available to authorized users.
* G. Vignaroli
1
Consiglio Nazionale delle Ricerche, Istituto di Geologia Ambientale e Geoingegneria (IGAG), Area della Ricerca di Roma 1,
Montelibretti, Italy
2
Dipartimento di Scienze Biologiche, Geologiche e Ambientali, Alma Mater Studiorum, Università degli Studi di Bologna, Bologna, Italy
3 Università degli Studi“G. d’Annunzio” Chieti – Pescara,
Pescara, Italy
4
Dipartimento di Ingegneria Strutturale e Geotecnica, Sapienza, Università di Roma, Rome, Italy
5 Dipartimento di Ingegneria, Università degli Studi Roma Tre,
Rome, Italy
6
Dipartimento di Scienze della Terra, Sapienza, Università di Roma, Rome, Italy
7
Consiglio Nazionale delle Ricerche, Istituto di Metodologie per
l’Analisi Ambientale (IMAA), Tito, Potenza, Italy
Introduction
The assessment of local seismic response is a key issue for policies finalised to prevention and mitigation of seismic risk (e.g. Sitharam and Anbazhagan2008; SM Working Group
2008; Mihalić et al. 2011; Santos et al. 2011; Working Group Fivizzano2019). The damage distribution in urbanised settings strongly depends on local geology and physical-mechanical properties of both surficial and buried lithotypes. Indeed, subsoil heterogeneities induce modifications, in terms of amplitude and frequency, during the propagation of seismic waves through the uppermost geological layers (e.g. Anderson2007). Site effects can be traced to several subsoil conditions, such as (i) highly heterogeneous subsoil settings (e.g. Bonnefoy-Claudet et al.2009; Pagliaroli et al.2014a; Gaudiosi et al. 2016); (ii) buried morphological elements (e.g. paleovalleys and paleotopography; Bard and Bouchon
1985; Le Roux et al.2012; Mancini et al.2014; Moscatelli et al.2014); (iii) topographic features (e.g. Pagliaroli et al.
2011; Massa et al.2014; Giallini et al.2020); (iv) widespread faulting/fracturing network in rock masses (e.g. Pagliaroli et al.2015; Vignaroli et al.2019); and (v) stratigraphic profiles (e.g. soft soil deposits resting on stiffer materials; Semblat et al.2005; Lanzo et al.2011; Eskişar et al.2014).
In contrast to numerous works on the subsoil model assessment in sedimentary environments, the factors con-trolling site effects in volcanic settings are still a relatively underexplored topic (Licata et al. 2019; Alleanza et al.
2020). Subsoil geometries in volcanic settings could differ from one-dimensional physical models, due to the hetero-geneous distribution of deposits in both vertical and lat-eral directions. In explosive volcanic settings, the alterna-tion of voluminous soft and stiff pyroclastic and epiclastic materials and effusive sequences defines an articulate physical stratigraphy that interacts with a disarticulated pre-volcanic substrate, often hosting scattered or clustered monogenetic eruptive centres (e.g. Bibby et al. 1995; Rowland and Sibson 2004; Lorenz and Kurszlaukis
2007; De Benedetti et al. 2008; Martín-Serrano et al.
2009; Árnason et al. 2010; White and Ross 2011; Isaia et al.2015). Through this extreme variability of thickness and depositional facies, seismic spectral amplification and peak ground acceleration can significantly change over a volcanic apparatus (Mora et al. 2001; Almendros et al.
2004; Chávez-Garciá et al. 2007; Nunziata 2007; Tramelli et al. 2010; Panzera et al. 2011; Santos et al.
2011; Chávez-García and Kang 2014; D’Amico et al.
2016; Galluzzo et al.2016). Understanding factors defin-ing subsoil settdefin-ing in volcanic environments is extremely relevant for highly urbanised areas (e.g. Santorini Island in Greece, the Azores Archipelago in Atlantic Ocean, the Auckland volcanic field in New Zealand, the Hawaii Islands in Pacific Ocean, the metropolitan areas around
Mt. Etna, Vesuvio-Campi Flegrei, and Colli Albani in Italy) that require detailed planning strategies to minimise risks from earthquakes.
In this study, we face the problem of local seismic response in volcanic setting by using an integrated geological-geophysical-geotechnical approach in the test area of Stracciacappa maar (Sabatini Volcanic District, central Italy, Fig.1a). The Stracciacappa maar represents a worthy oppor-tunity for investigating the internal architecture of such dis-tinctive volcanic structure and the processes leading to local seismic response in similar volcanic areas, inasmuch as (i) its phreatomagmatic genesis led to a polygenic stratigraphic set-ting (strombolian and effusive volcanic deposits and intervening palaeosol; De Rita et al. 1983; De Rita and Zanetti1986; Sottili et al.2012); (ii) its maar configuration was consequent to a phreatomagmatic activity that evolved in both time and space (Valentine et al.2015); (iii) its well pre-served crater, without anthropogenic cover, offers the oppor-tunity to detail the nature and lithotechnical properties of sed-iments filling the upper part of the maar structure. Our aim is twofold: (i) to reconstruct the physical stratigraphy (i.e. the sequence of volcanic lithotypes characterised in terms of physical, mechanical, and geophysical properties) of the Stracciacappa maar and (ii) to assess through numerical anal-yses the local seismic response for different earthquake sce-narios. The results would provide a reference background for seismic microzonation studies in volcanic settings where urbanised areas develop.
Geological setting
The Tyrrhenian side of central Italy is characterised by the occurrence of distributed volcanic deposits, between Campania and Tuscany regions (Fig.1a). These deposits are products of an intense Pleistocene-Holocene volcanism, which manifested through both explosive and effusive mech-anisms (e.g. Peccerillo 2005; Avanzinelli et al. 2009). Phreatomagmatic activity is well documented for both fossil (Vulsini Mountains: Acocella et al.2012; Sabatini Volcanic District: De Rita et al.1983; Sottili et al.2012; Marra et al.
2014) and quiescent/active (Colli Albani: Funiciello et al.
2003; De Benedetti et al.2008; Campi Flegrei: Isaia et al.
2015) volcanic edifices in central-southern Italy, which are characterised by the widespread occurrence of calderas, erup-tive fissures, and maars, as well as fossil/acerup-tive vents. The Sabatini Volcanic District (SVD; Fig.1a) extends over an area of∼ 1800 km2, including part of the Rome metropolitan area. The SVD volcanic activity encompassed a variety of eruption s t y l e s , i n t e n s i t i e s , a n d m a g n i t u d e s , w i t h a f i n a l phreatomagmatic phase (as young as ca. 90 ka) originating strombolian and effusive centres (Cundari 1979; De Rita et al.1983; De Rita and Zanetti1986; Conticelli et al.1997;
Sottili et al.2012). Explosive interaction between volcano-feeding magma and underground waters located in Meso-Cenozoic carbonate reservoir is claimed as responsible for the paroxysm phenomena leading to formation of several maars (Funiciello et al.1979; De Rita and Sposato1986). Hydromagmatic centres mostly consist of tuff rings and sub-ordinate tuff cones with maar-type craters, which formed within a NW-SE trending,∼ 150-km2-wide area in the central SVD (Sottili et al.2010).
The Stracciacappa maar is located in the central-eastern portion of the SVD (Fig. 1a). The products of the Stracciacappa eruptive centre extend regularly around the cra-ter at a maximum distance of 1.5 km, covering a surface area of about 6 km2, whereas the total volume of the erupted ma-terial was estimated to be approximately 0.61 km3. The vol-canic sequence of the Stracciacappa maar includes an alterna-tion of well-sorted horizons of dark grey scoria lapilli with lenses of imbricated pyroclastites. Up to metre-sized ballistic lava boulders are scattered throughout the deposits (De Rita and Zanetti1986; Sottili et al.2012). The land surface at the time of the Stracciacappa activity was that of a plateau capped by a < 10-m-thick lava. A continuous coring borehole was collected within the Stracciacappa crater, reaching the 32.6-m depth fro32.6-m well-head (Giardini2007). The author interprets the grey pyroclastic material reached at 29-m depth as the volcanic bedrock of the overlying lacustrine deposits. Palynological studies show that the lacustrine sediment record spans the last∼ 60 ka of the vegetation history in the SVD (Giardini 2007), thus broadly constraining the age of Stracciacappa crater formation. Recently,39Ar/40Ar geochro-nological analyses on leucite and sanidine from scoria attest at 97 ± 4 ka the last phreatomagmatic eruptive event in the Stracciacappa area (Sottili et al.2010).
Methods and results
Geological data
The Stracciacappa maar is characterised by 1-km-diameter tuff cone crater with circular shape, whose lake bed lying 30–40 m below its rim (Fig.1b). The radial thickness of the tephra ring decreases abruptly from a maximum thickness of∼ 25 m along the crater rim to < 1 m at about 1.5 km at the outer edge.
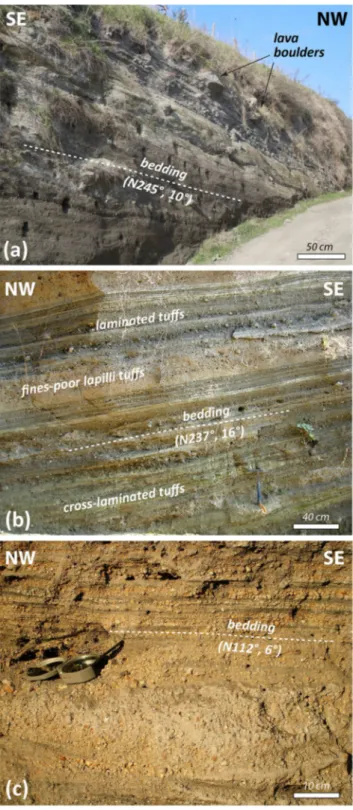
In map view, three main lithological deposits are concentri-cally distributed, moving from the ring to the central part of the crater (Fig.1b). The ring is mainly composed by the pyroclastic succession belonging to the last phreatomagmatic activity. This pyroclastic succession generally bends outward the rim with low angle dip (10–20°) (Fig.1c). It consists of at least 25-m-thick alternation of decimetre- to centimetre-thick layers of fine-medium ash and coarse ash to small lapilli (Fig.2a). Deposits typically contain abundant cross beds to cross lamination with
lenticular zones of imbricated lithic clasts (Fig.2b). The upper-most 5 m of the succession contains metre-sized lava ballistic boulders associated to impact sags (Sottili et al.2012).
The outer portion of the crater depression is mainly com-posed of epiclastic debris deposits, of colluvial, alluvial, and deltaic origin. These deposits consist of alternation of cm-thick reworked fine-grained and coarse-grained volcaniclastic material (Fig.2c). The coarse-grained levels are enriched of both volcanic and sedimentary lithics. Generally, these epiclastic deposits define decametre-thick lenticular bodies in section view, dipping at low angle (< 10°) toward the centre of the crater (Fig.1c).
The lake infill is made by Late Pleistocene-Holocene lacus-trine muds, which are interfingered with the epiclastic talus. The thickness of these lacustrine deposits has been constrained by the SS1 continuous coring borehole (Fig.
1d). The lacustrine deposits consist of an alternation between decimetre-thick layers of dark and grey clayey silts in the upper 15 m. Downward, the lacustrine fill passes to grey silty sands with abundant volcaniclastic material.
Geophysical data
Electrical resistivity tomography
Two Electrical Resistivity Tomographies (ERT1 and ERT2 in Fig.1b) were performed crossing the whole maar ring with NNW-SSE and E-W directions, respectively. ERT1 is 1420 m long, whereas ERT2 is 1660 m long. Both ERT were carried out by means of a Syscal Pro resistivity metre (Iris Instruments), coupled with a multi-electrode acquisition sys-tem (48 electrodes) and using the roll-along technique (Loke
2018). A constant spacing of‘a’ = 20 m between the adjacent electrodes was used, reaching a maximum penetration depth of about 100–150 m. To improve data quality and resolution, apparent resistivity data were acquired by means of different array configurations (Wenner and Wenner–Schlumberger), and coupling measurements with different combinations of dipole length (i.e. 1a, 2a, 3a) and‘n’ numbers of depth levels (overlapping data levels). To obtain two-dimensional resistiv-ity images of the subsurface, apparent resistivresistiv-ity data were inverted using RES2DINV software (Loke and Barker1996; Revil et al. 2008; Galli et al. 2014; Giocoli et al. 2014). Electrical images show a root mean-squared (RMS) error of 6% for ERT1 and 6.3% for ERT2, after three iterations.
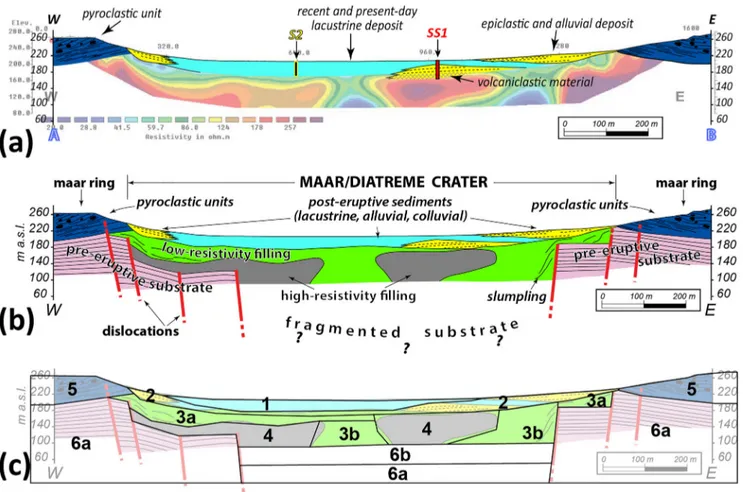
The resulting two-dimensional resistivity profile from the ERT1 (Fig.3a) reveals a pronounced variability of resistivity, from lowest values of about 20Ωm up to values higher than 300Ωm. A high-resistivity domain (> 200 Ωm; h1 in Fig.3a) is located below the maar rim (at the NNW edge of the ERT1), showing a lenticular geometry gently dipping outward. An additional high-resistivity domain (> 200Ωm; h2 in Fig.3a) is located some decametres eastward, in correspondence of the
rim crater floor transition. The boundary between these two high-resistivity domains is defined by a moderate-resistivity discontinuous anomaly (~ 60–150 Ωm; m1 in Fig. 3a) that shows a roughly tabular geometry dipping to the NNW. Moving SSE, the h2 domain is sub-vertically bounded by a low- to very low-resistivity domain (~ 20–50 Ωm; l2 in Fig.
3a) whose thickness is about 40 m. The central portion of the crater is characterised by two distinct resistivity domains: (i) a sub-horizontal low-resistivity layer (~ 20–50 Ωm; l1 in Fig.
3a) at the uppermost 20–30 m and (ii) two
moderate-to-high-resistivity domains (> 100Ωm; m2 in Fig.3a), which display discontinuous and fragmented shapes. To the bottom, these m2 domains gradually pass to undulated anomalies having resistivity less than 80Ωm. Finally, the south-eastern edge of the ERT1 is characterised by the occurrence of a sub-horizontal (or gently dipping to SSE) layer of low-to-medium resistivity (< 60Ωm; l3 in Fig.3a), which seems to rest above a lenticular domain of high resistivity (> 200Ωm; h3 in Fig.3a).
The resulting two-dimensional resistivity profile from the ERT2 (Fig.3b) reveals a sub-horizontal low-resistivity layer (~ 20–50 Ωm; l1 in Fig.3b) at the surface, in the central por-tion of the crater. Laterally, the l1 layer passes to low-to-medium-resistivity domains having lenticular shape (< 80Ωm; l3 in Fig.3b). High-resistivity domains (> 200Ωm; h1 in Fig.3b) are located below the maar ring at the edges of the ERT profile. Additional two high-resistivity domains, hav-ing sharp and sub-vertical lateral boundaries, extend below the external portions of the l1 low-resistivity layer (> 200Ωm; h2 in Fig.3b). Moderate-to-high-resistivity domains (> 100Ωm; m1 and m2 in Fig.3b) occur in the central portion of the crater, below the low-resistivity layer, as forming discontinuous and fragmented resistivity anomalies. At the bottom of these moderate-to-high-resistivity discontinuous anomalies, the ERT2 profile shows the upper portion of two domains characterised by low-resistivity values (~ 20–50 Ωm; l2 in Fig.3b). The l2 low-resistivity domains seem to be projected upward, determining a lateral boundary between domains having higher resistivity values (h1, m1, and m2 in Fig.3b). In general, the transition throughout the different resistivity domains is rather sharp in both vertical (by means of sub-horizontal contacts) and lateral (by means of sub-vertical con-tacts) directions.
Ambient noise
Twenty-nine single station noise recordings of about 30-min duration were collected along both ERT profiles (Fig. 1b).
Fig. 1 a Simplified geological map of the central sector of the SabatiniVolcanic District, whose maars and polygenic eruptive centres are reported. Maar structures are common in other volcanic domains along the Tyrrhenian margin of Italy (e.g. at the Colli Albani and at the Phlegrean Fields, see the inset). b Geological map of the Stracciacappa maar, where localisation of geophysical prospections and SS1 borehole is reported. c Geological cross-sections as reconstructed from field survey and SS1 borehole. d Schematic SS1 borehole stratigraphy with indication of collected undisturbed samples
Fig. 2 Field exposures and characteristics of lithotypes from the Stracciacappa maar. a Bedding of the pyroclastic succession exposed along (and form) the rim. b Detail of the stratigraphic alternation between different tuff deposits. c Detail of the epiclastic deposit distributed in the outer portion of the crater depression
Measurements were performed by using both (i) a SARA-SL06 datalogger in connection with a Lennartz LE-3D/5 s weak mo-tion velocity transducer and (ii) a Tromino instrument. At each measurement point, horizontal to vertical noise spectral ratio (HVNSR) curves (Nakamura1989) were computed in order to evaluate the ratio between the horizontal and the vertical compo-nents of measured ambient vibration. These curves provide the identification of resonance frequencies of the soil deposit.
In the following, we describe ambient noise results by selecting group of measurement stations located on (i) the rimming pyroclastic units, (ii) the epiclastic debris deposits, and (iii) the lacustrine floor (Fig.1b). Representative HVNSR curves are reported in Fig.3, whereas the complete dataset is reported in Fig.A1(Data Repository).
HVNSR curves from measurement stations located on the rim crater (named T14, T15, T16, T25, T26, L7) show a near flat trend around an average value of 1–1.5. Very smoothed peaks of am-plitude (up a factor of 2) attain at low frequency values (1–2 Hz). HVNSR curves from measurement stations located on the epiclastic debris deposits (named T1, T5, T13, T19, T20, T21, T22, L1, L4, L5) show a peak of amplitude at frequencies spanning from 1.0 Hz and 3.0 Hz. In particular, HVNSR curves from outermost measurement stations (T13, T20, T21, T22) are characterised by a peak of amplitude lower than 3 at frequency of 2.0–3.0 Hz (i.e. broadband amplification), whereas some HVNSR curves from innermost measurement stations (T1, T5, T19, L5) are characterised by a peak of amplitude higher than 3 at frequency of 1.0–2.0 Hz. This trend is not supported by HVNSR curves from measurement sta-tions L1 and L4 that, on the contrary, show either peak at frequency higher than 10 Hz (L1) or do not show appreciable peak (L4).
HVNSR curves from measurement stations located on the lacustrine floor (named T2, T6, T7, T8, T9, T10, T11, T12, T17, T18, T27, T28, L3) show a clear peak reaching the max-imum amplitude (about 8) at L3 station at a frequency of about 1.5 Hz. In particular, the peak amplitude shows an increasing trend when moving from the outermost measurement stations (e.g. T6, T12, T28) toward the innermost one (e.g. T8 and L3). Following this trend, the resonance frequency decreases from 2.0 to 1.5 Hz.
2D arrays
Three 2D arrays recorded 30 min of ambient noise using ver-tical geophones, with a cutoff frequency of 4.5 Hz and
arranged according to cross geometries. These arrays were located on the rim crater (array-04), on the epiclastic debris deposits (array-02), and on the lacustrine floor (array-01) (Fig.
1b). For each array, we retrieved surface-wave dispersion curves by using both ESAC (Bettig et al. 2001) and F-k (Lacoss et al.1969) techniques (Fig.3b).
The best fit for the array-01 indicates, from the surface: 9 m with material shear wave velocity (VS) of about 90 m/s, 35 m
with VS≈ 262 m/s, and a layer with VS≥ 900 m/s.
The best fit for the array-02 indicates, from the surface: 28 m with increasing VSup to 190 m/s, 68 m with VS≈
700 m/s, and a layer with VS≥ 1800 m/s.
The best fit for the array-04 indicates, from the surface: 9 m with VSof about 400 m/s, 23 m with VS≈ 520 m/s, and a layer
with VS≈ 800 m/s.
Geotechnical data
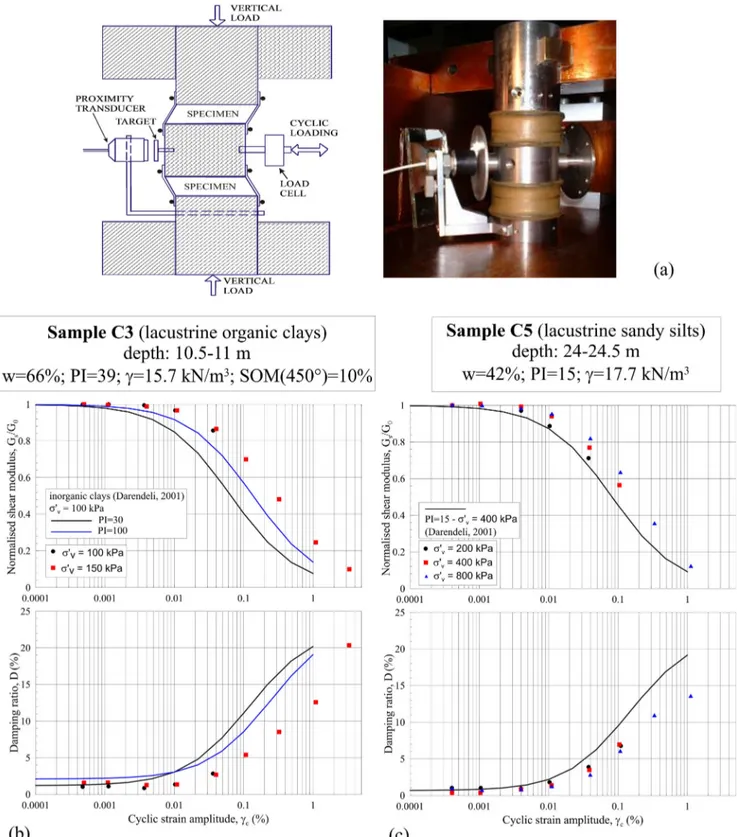
Geotechnical laboratory tests were carried out on undis-turbed soil samples recovered from the SS1 borehole (see location in Fig. 1b, stratigraphy and sample positions in Fig.1d). In particular, soil behaviour under cyclic loading conditions was characterised by means of simple shear tests carried out with double specimen simple shear de-vice (DSDSS), which is thoroughly described in D’Elia et al. (2003). This device (Fig.4a) investigates cyclic soil properties in a wide range of strain amplitude (from ap-proximately 0.0003% to more than 1.0%). DSDSS tests were performed on lacustrine organic clays (sample C3 recovered at 10.5-m depth) and underlying lacustrine sandy silts (sample C5, 24 m). The variation of normal-ised shear modulus and damping ratio with cyclic shear strain amplitude (γc) was determined for each sample at
different values of confining pressures, starting from the pressure corresponding to the estimated in-situ vertical effective geostatic stress. It is interesting to note that the effect of confining stress is negligible, resulting in a slight shift toward right of G/G0-γc curves and downwards of
D-γc curves (Fig. 4b, c). These normalised stiffness and
damping curves were used to model nonlinearity of soils in the site response numerical analyses (see below). According to existing literature (e.g. Pagliaroli et al.
2014b; Kishida et al. 2009), a peculiar behaviour for or-ganic clays with respect to inoror-ganic clays of similar plas-ticity was found: organic soils are characterised by a stronger linearity and lower damping properties. As mat-ter of fact, normalised modulus and damping curves of organic clays (plasticity index, PI = 39) are shifted higher and lower respectively (Fig. 4b, c) with respect to the curves of similar plasticity inorganic clays (curves for PI = 30 by Darendeli 2001), satisfactorily fitting the curves pertaining to inorganic very-high plasticity soils (PI = 100 or higher).
Fig. 3 Two-dimensional resistivity profiles from a ERT1 and b ERT2.Representative horizontal to vertical noise spectral ratio (HVNSR) curves from ambient noise measurements performed along both ERT are report-ed. The complete HVNSR dataset is reported in Appendix Fig. A1. Vs profiles obtained from three 2D passive seismic arrays performed along the ERT2 are shown
The subsoil model
The geological model
The depth geological model of the Stracciacappa maar is de-duced through the integration of the field geology (cross-sec-tion A-B in Fig.1c) and the geophysical datasets (ERT2 in Fig.3b). Major findings are the following:
& The pyroclastic units form the low-relief ring of the crater (Fig. 5a). These pyroclastic deposits, which consist of stratified tuffs with intercalated lavas boulders, correspond to the high-resistivity domains (h1) located at the NW edge of the ERT1 and at both the E and W edges of the ERT2 (Fig.3). This volcanic succession forms a tabular body dipping outward from the crater, as constrained by the dip of the bedding (Fig.2a) and the geometry of the h1 domain in the NW edge of the ERT1 (Fig.3a). Both ERT profiles show that these high-resistivity domains are bounded at depth by domains showing lower resistivity values, thus suggesting that the pyroclastic units corre-spond to a vadose zone. We attribute a maximum thick-ness of about 70 m to this volcanic sequence based on thickness of h1 domain in the NW edge of the ERT1 (Fig.3a).
& A layer of lacustrine deposits, corresponding to the upper-most 15-m-thick sequence of dark and grey clayey silts drilled at SS1 (Fig. 1d), fills the uppermost part of the maar crater (Fig. 5a). This layer corresponds to sub-horizontal low-resistivity domains in both ERT profiles (l1 in Fig.3). The attitude of these low-resistivity domains helps to constrain the lateral geometry and thickness of the lacustrine deposits. In particular, pinch-out and/or interfingering geometries can be envisaged for the transi-tion from these lacustrine deposits to the epiclastic deposits.
& The epiclastic deposits form lenticular bodies rimming (in map view) the lacustrine deposits (Fig.5a). The epiclastic deposits correspond also to the grey sands and volcaniclastic material drilled at SS1 (Fig.1d). At depth, the thickness and the geometry of these deposits resemble the attitude of the low-to-medium resistivity domains constrained by both ERT profiles (l3 in Fig.3).
& A chaotic material fills the central part of the crater, just below the lacustrine deposits (Fig.5a). This intra-crater material can be attributed to slightly bedded syn-eruptive filling made of slumping and collapsed blocks within a finer hosting material. Both ERT profiles show that this filling corresponds to the recurrence of medium- and high-resistivity discontinuous anomalies (m1 and m2 in Fig.3). Although the nature of this filling is still unknown, it is noteworthy an important variability in thickness and the pinch-and-swell geometries for these resistivity
anomalies, which pass from lenticular bodies of high re-sistivity (> 200Ωm) to mantling layers of low resistivity (< 60Ωm).
& A succession of alternating lavas and tuffs, which pre-date the maar structure and extend from the base of capping pyroclastic deposits to about 450-m depth (De Rita et al.
1983; Sottili et al.2012), can be considered as forming the pre-eruptive substrate. This substrate corresponds to the high-resistivity domains (h2 in Fig.3) that are disposed in a staircase-like shape, dipping toward the crater centre. & An undefined material fills the lowermost part of the cra-ter, at depth below 100 m a.s.l. (Fig. 5a). We have no direct knowledge on the nature of this material, and we can only assume to be part of the fragmented, pre-eruptive, substrate (including country rock blocks and rafts) within the unbedded lower diatreme. Both ERT profiles have not enough resolution to detect the geometry and thickness of this fragmented substrate, and an alternation of high- and low-resistivity domain can be only envisaged. We only infer that this material may pass, to depth, to less fractured substrate.
The lithotechnical model
The reconstructed geological setting of the Stracciacappa maar (Fig.5b) define the base for assessing the lithotechnical model. We reinterpret the lithofacies into mechanical lithotypes by using a simplified cross-section (Fig.5c). The scheme of lithotypes is reported in Table1, which also con-tains the values of mechanical parameters used for numerical analyses aimed at seismic site response evaluation. We define: & A lithotype #1, corresponding to the sub-horizontal layer of lacustrine deposits filling the upper part of the maar crater (Fig. 5cand Table 1). We attribute low values of Vs (such as 100–150 m/s) to this lithotype, as inferred by the array-01 (Fig.3b).
& A lithotype #2, corresponding to the upward convex layer of epiclastic deposits within the upper part of the maar crater (Fig.5cand Table1). We attribute values of Vs in the order of 250–300 m/s to this lithotype, as inferred by the array-02 (Fig.3b).
& A lithotype #3a and a lithotype #3b, both corresponding to the fine-grained material filling the central part of the cra-ter (Fig.5cand Table1). These lithotypes also correspond to the irregular anomalies showing low-to-medium resis-tivity. A precise attribution of Vs values for these lithotypes is not possible on the base of our dataset. Anyway, considering a model of increasing Vs with depth, we assume Vs higher for lithotypes #3a and #3b than Vs attributed to lithotype #2. Therefore, we attribute
values of Vs in the order of 400 m/s to lithotype #3a and values of Vs in the order of to 700 m/s to lithotype #3b. The highest Vs values have been attributed according to the array-02 (Fig.3b).
& A lithotype #4, corresponding to the irregular slumping and collapsed blocks within the central part of the crater (Fig. 5c and Table 1). We attribute values of Vs in the order of 1000 m/s to this
Fig. 4 a Representative picture and schematic layout of the DSDSS (double specimen simple shear device) apparatus; normalised shear modulus and damping ratio curves of b lacustrine organic clays and c
sandy silts from DSDSS tests. PI = plasticity index, w = natural water
content,γ = unit weight, SOM = soil organic matter content by loss on
lithotype, as inferred by the lowermost 60 m of the array-01 (Fig. 3b).
& A lithotype #5, corresponding to the pyroclastic deposits forming the rim of the crater (Fig.5cand Table1). We attribute values of Vs in the order of 700 m/s to this lithotype, as inferred by the array-04 (Fig.3b).
& A lithotype #6a, corresponding to the pre-eruptive sub-strate arranged in staircase-like shape (Fig. 5c and
Table 1). We attribute values of Vs in the order of 1800 m/s to this lithotype, as constrained by the lower-most metres of the array-02 (Fig.3b).
& A lithotype #6b, corresponding to the fragmented, pre-eruptive, substrate filling the lowermost part of the crater (Fig.5cand Table1). This lithotype is completely uncon-strained in terms of both thickness and Vs. Following our geological model, we consider this lithotype like the
Fig. 5 a Comparison between geological data and ERT1 profile; b schematic geological model; c subsoil model used for 2D numerical analysis unravelled along the A-B cross-section
Table 1 Subsoil model of the Stracciacappa maar for site response analysis
# Lithotypes γ (kN/m3) Vs (m/s) D0(%) G/G0-γcand D-γccurves
1 Lacustrine silty clays/organic clays 16 150 1.3 DSDSS C3 (150 kPa)
2 Epiclastic debris and alluvial silty sands 18 250 1.0 DSDSS C5 (200 kPa)
3a Chaotic pyroclastic (-sedimentary?) deposit 18 400 0.5 Linear behaviour
3b Chaotic sedimentary-lacustrine silty clays (?) 18 700 0.5 Linear behaviour
4 Semi-chaotic pyroclastic deposit with dominant
lithoid component
19 1000 0.5 Linear behaviour
5 Tuffs with lavas boulders 19 700 0.5 Linear behaviour
6a Alternation of lavas and tuffs 21 1800
lithotype #4 in terms of geotechnical characteristics. To this lithotype, we attribute values of Vs in the order of 1000 m/s that may increase at depth with possible unfractured substrata (lithotype #6a at the bottom of the lithotechnical cross-section of Fig.5c).
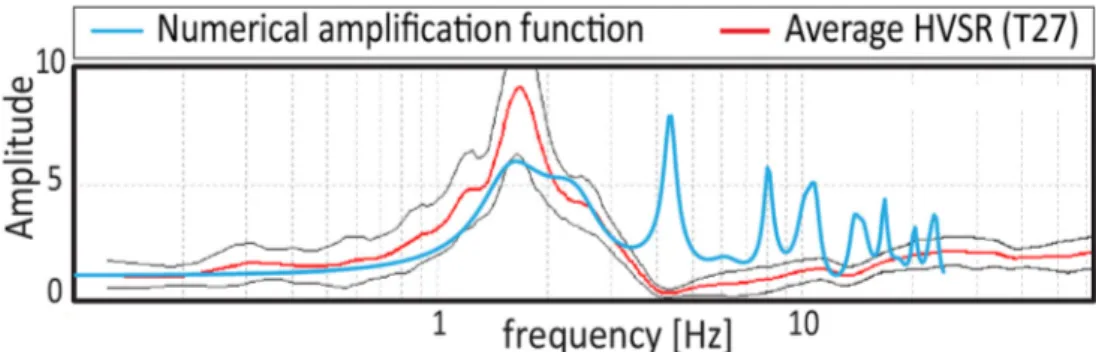
For all lithotypes a Poisson ratio of 0.35 has been assumed with the exception of lithotype #1 characterised by 0.47. The lithotechnical model was validated by comparing the funda-mental frequencies computed by 1D viscoelastic linear analy-ses with values estimated form HVSR analyanaly-ses. An example is reported in Fig.6where the fundamental resonance frequen-cy (about 1.7 Hz) highlighted by HVSR at T27 is well reproduced by the numerical amplification function, thus confirming the effectiveness of the model at least in the linear range.
Site response numerical analyses
Computer code
Both 1D and 2D numerical analyses were carried out with the equivalent linear, finite element QUAD4M code (Hudson et al.1994). Bidimensional analyses were carried out with reference to the cross-section of Fig.5cwhile 1D analyses were executed at selected points located on the cross-section surface; the comparison between 1D and 2D allows to quan-tify bidimensional site effects related to buried and surficial morphologies. The QUAD4M code employs the full Rayleigh formulation with two control frequencies to model damping properties of materials; this formulation generally allows re-duce the variation of damping with frequency in the range of interest by properly selecting the two values of control fre-quencies (Hudson et al.1994; Lanzo et al.2003).
The input motion is applied at the base in terms of shear stress time histories proportional to the specified control motion at the half-space outcrop; this strategy, coupled with Lysmer and Kuhlemeyer (1969) base dashpots, allows to model an elastic base (Joyner and Chen1975). On the contrary, side boundaries are perfectly reflecting thus producing artificial reflected waves coming back into the model; therefore, in order to reduce the
influence of these spurious waves, the lateral boundaries were extended about 560 m in both directions from the edges of the basin. The finite element mesh consists of about 11,650 elements of triangular shape whose size, for each material, was selected according the rulehmax= Vs/(8fmax), where Vs is the material
shear wave velocity value selected accordingly to the shear strain level (therefore taking into account the reduction of stiffness due to soil nonlinearity),hmaxis the maximum height of mesh
ele-ment, and fmaxis the maximum frequency to be transmitted,
assumed equal to 10 Hz. This rule allows to achieve a satisfactory accuracy of the numerical solution (Kuhlemeyer and Lysmer
1973).
The analyses were conducted by applying vertical incident S waves as input motion using the accelerograms selected accord-ing to the procedure described in the followaccord-ing paragraph.
Selection of input motion
The study area could be struck by two kinds of seismic events: volcanic local events generated by magma and/or volcanic fluids movements and tectonic events generated by faults in central Apennines (located at about 70 km from the maar). The different seismogenic mechanisms and source-site dis-tances cause variable energy and frequency content in the input motion associated to the two events. Two‘seismic sce-narios’ were therefore considered to consider the influence of input motion on the seismic response of the maar:
1. a near-field moderate magnitude shallow volcanic event (‘volcanic scenario’), characterised by an enrichment of long-period (> 1 s) motions, compared to tectonic events of equivalent magnitude (Jousset and Douglas 2007; Milana et al.2008). Considering this peculiar frequency content, as first approximation, the NS and EW record-ings at Bronte Station (BNT in ITACA database,http:// itaca.mi.ingv.it) of ML = 4.4 October 27, 2002 event were used. This event is part of a large seismic swarm with epicentres located in the Mount Etna volcano area (Bozzano et al. 2013); the accelerograms were applied as they are without scaling.
2. a high magnitude far-field tectonic event (‘tectonic sce-nario’), whose reference spectrum was built with ground
Fig. 6 Comparison between numerical linear amplification function at T27 site and HVSR from microtremors. The thin black lines represent the standard deviation of the average HVSR
motion prediction equation (GMPE) by Ambraseys et al. (2005) with reference to average ± 1 standard deviation values, assumingM = 6.5 and distance of 70 km. These conditions are compatible with seismogenic sources locat-ed in central Apennines. Five recordings of events characterised by magnitude and distance in the range of 6–7 and 60–90 km, respectively, were extracted from the ITACA database (http://itaca.mi.ingv.it) and scaled in order to match on average the reference spectrum: MMP1 station EW component (2016/10/30 Central Italy), GRR station EW component (1978/04/15 Gulf of Patti), MMUR station EW component (2016/08/24 Central Italy), PIEI station EW component (2016/10/30 Central Italy), TOD station NS component (2016/08/24 Central Italy). The selected range of magnitude is expected as the highest in the central Apennines, and the distances are calculated from the site to the main nearby Apennines seismogenic sources.
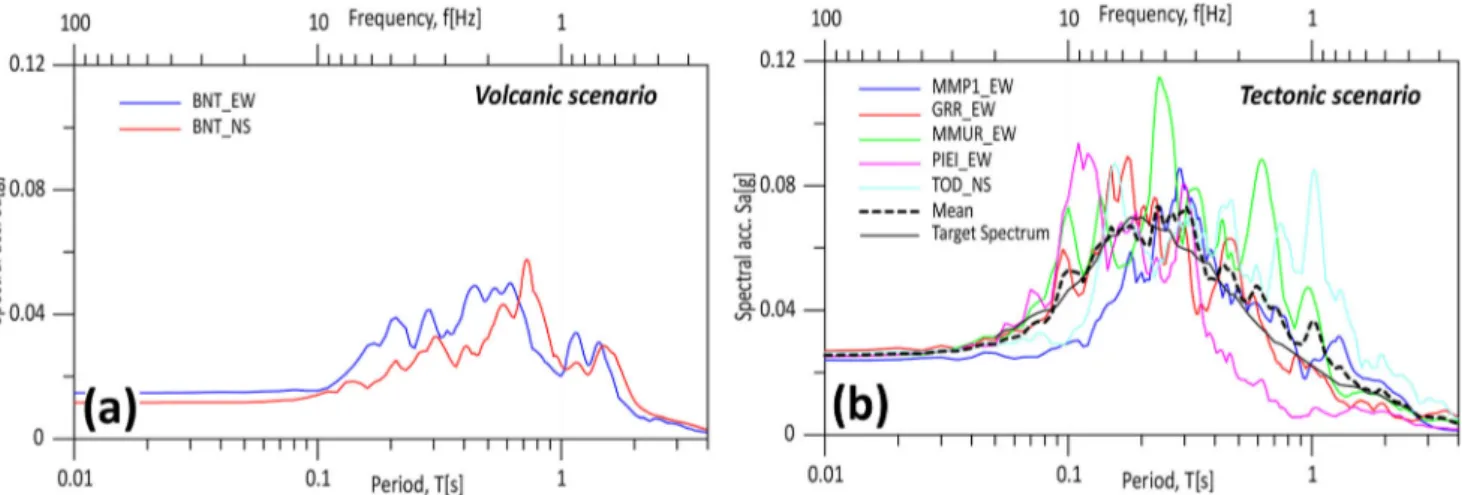
The response spectra selected for both scenarios are reported in Fig.7. For the ‘tectonic’ scenario, the reference spectrum computed by GMPE is also reported for comparison. By com-paring the two scenarios, some remarkable differences can be noted: even if a similar PGA (about 0.02 g) characterises both the tectonic and the volcanic inputs, the spectral shape is quite different. Major energy is in the 0.5–1 s for the volcanic scenario (Fig.7a), whereas predominant period of the average tectonic input is about 0.2 s (Fig.7b). This confirms the enrichment of long-period (> 1 s) motions of volcanic input with respect to tectonic events, despite the magnitude of the selected events is quite lower (4.4) compared to the size of tectonic recordings.
Assessing the influence of lateral heterogeneity
Preliminary analyses were carried out by considering a simpli-fied subsoil model. Lithotypes #3b and #4 were grouped by
assuming a Vs = 850 m/s as average of the values pertaining to the two lithotypes (700 m/s for #3b and 1000 m/s for #4). The comparison between the results of the simplified model (model2) with the detailed one (model1 previously introduced in Table1) will allow us investigating the role of the lateral heterogeneity at depth in the maar on the surface response.
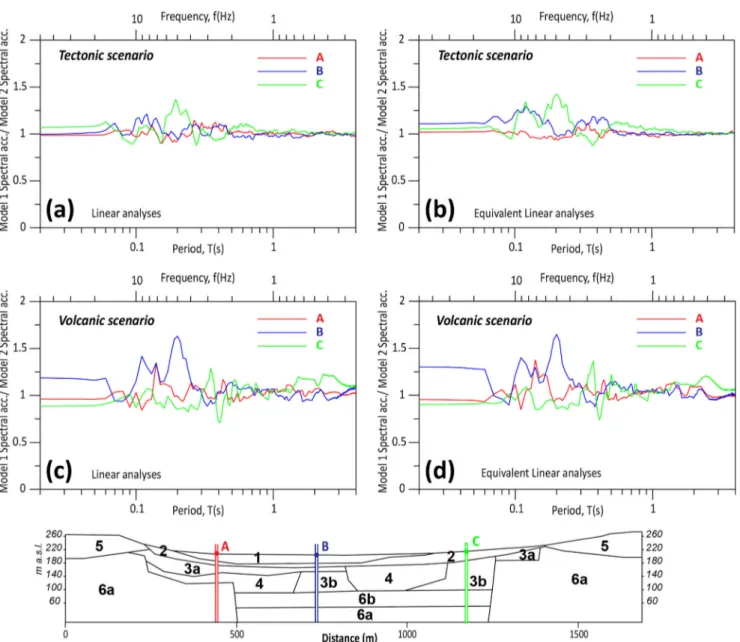
The results obtained with model1 and model2 are com-pared in Fig.8in terms of response spectral ratios at 3 sites of the surface of the maar (A, B, and C in Fig.8). In particular, the spectral acceleration ratio model1/model2 was computed for both input scenarios and for viscoelastic linear (the damping ratio was set to very small values 0.1% for all the materials) and equivalent linear approaches. All spectral ratios were calculated by averaging the response over all considered accelerograms for each scenario.
The following general conclusions can be drawn: (i) while the ground motion is comparable at 0.5–1 s (1–2 Hz), the spectral accelerations are higher in the heterogeneous model 1 with respect to the simplified model 2 especially in the period range 0.1–0.25 s; (ii) no relevant differences exist be-tween linear and equivalent linear analyses; (iii) a dependence from input motion is observed, i.e. higher differences at 0.1– 0.25 s between model1 and model2 are observed for volcanic scenario with respect to the tectonic one.
Regarding the spatial distribution of the ground motion, minor differences in spectral accelerations predicted by the two models are observed close to the western edge of the maar section (point A), where the subsoil is quite homogeneous, whereas higher discrepancies appear at the central (point B) and eastern portion (point C) of the maar section. Here, the spectral acceleration for model1 can be 40–60% higher than model2 at 0.1–0.25 s (medium-to-high frequency range 5– 10 Hz). For volcanic scenario, the differences are higher at the maar centre (point B), whereas for tectonic scenario, the effect of heterogeneity is maximum at the eastern portion (point C).
Fig. 7 Response spectra of natural accelerograms selected as input motion for numerical analyses for the a volcanic scenario and the b tectonic scenario. For the tectonic scenario, the target spectrum obtained with Ambreseys et al. (2005) GMPE is also reported
The results show that the subsoil lateral heterogeneity is a crucial parameter for predicting ground motion in the maar. As above discussed, multiple amplification peaks, especially at medium-to-high frequencies, are probably related to scat-tering effects and characterise the response of the heteroge-neous subsoil model with respect to the homogeheteroge-neous one. Therefore, in the following, reference is made only to the model1.
Amplification effects
Amplification pattern
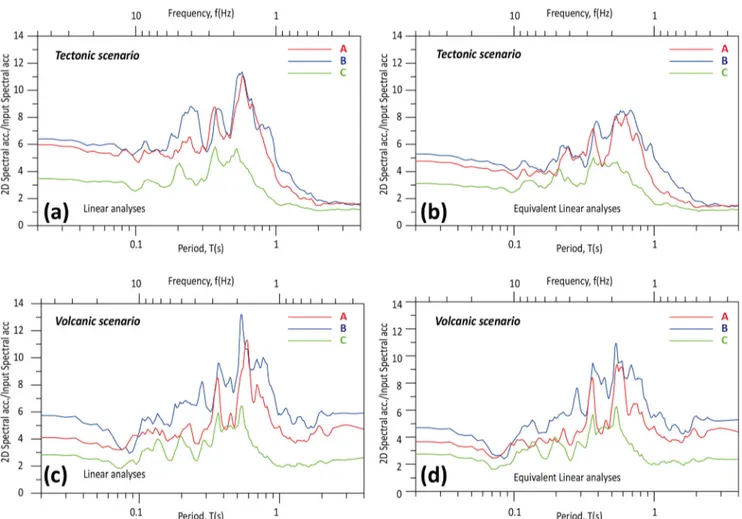
Amplification effects along the maar were evaluated in terms of amplification functions developed for spectral accelerations at the three selected points A, B, and C. The functions were
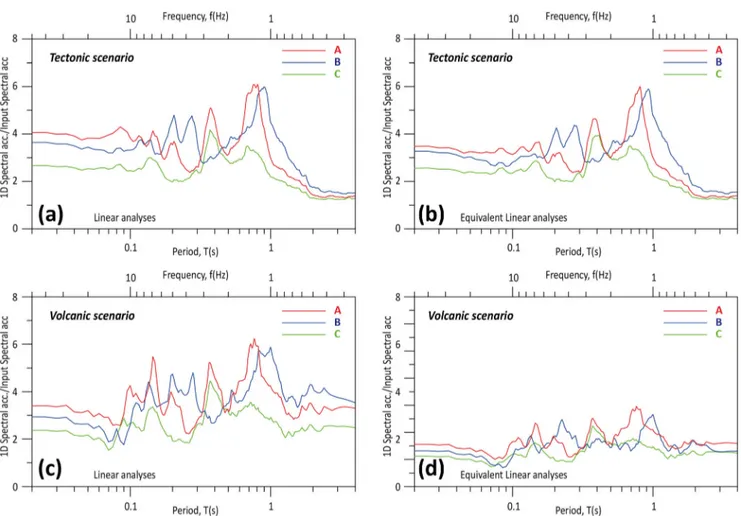
calculated by averaging the response over all considered accelerograms for each scenario and both linear and equiva-lent linear models were considered (Fig.9). As expected, the amplification effects reduce from linear to equivalent linear analyses due to the moderate nonlinear behaviour of soils which lead to an increase in damping properties (Fig.4b, c). This reduction is obviously more pronounced for the tectonic scenario (Fig.9a, b) characterised by higher input energy and therefore inducing more nonlinear effects in the soils with respect to the volcanic scenario (Fig.9c, d; compare tectonic and volcanic input spectra in Fig.7).
The amplification is maximum at the centre and eastern portion of maar (points B and C), where a peak of 8–10 is reached for equivalent linear analyses in the range 1–3 Hz including the resonance frequencies at surface. Frequencies and amount of amplification are comparable at points B and
Fig. 8 Comparison between seismic response of detailed model1 and simplified model2. Spectral acceleration ratios model 1/model 2 for tectonic (a, b) and volcanic scenario (c, d); results are from linear viscoelastic (a, c) and equivalent linear (b, d) analyses
C; for both points, the PGA is amplified of about 4–5 (see the high frequency range in Fig.9b, d). On the contrary, the am-plification is generally lower than 5–6 in the whole range of frequency around point A at western portion.
2D effects and role of soil nonlinearity
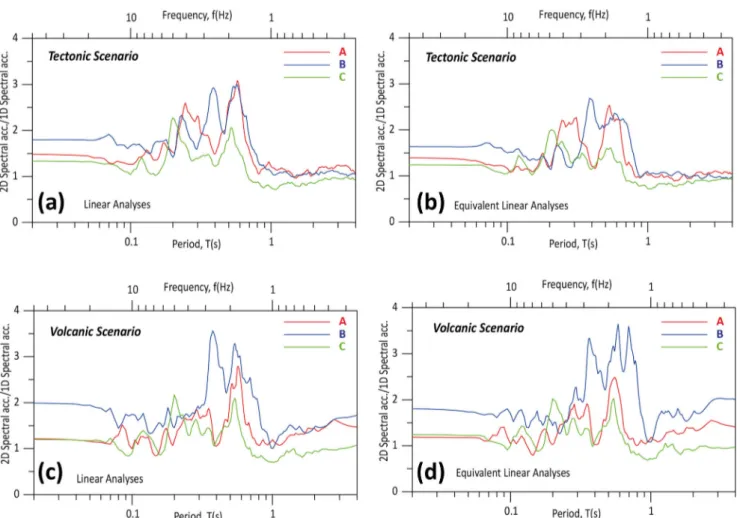
Additional 1D analyses were carried out at points A-B-C (model1) for exploring the role of 2D effects. The average spectral 2D/1D ratio (2D‘aggravation factors’) are presented in Fig.10for both tectonic and volcanic scenarios (Fig.10a, b) and linear/equivalent linear analyses (Fig.10c, d). Moderate 2D effects take place at point C (eastern side), where the aggravation factors are lower than 2 in the whole frequency range. In the central and western part of the maar, the 2D effects are more relevant in the order of 2.5–3.5 in 1–3 Hz range; the aggravation factors are higher at point B especially for volcanic scenario (Fig.10d). It should be noted that points A and B, where higher 2D effects occur, are located on very soft material (lithotype #1; Vs = 150 m/s), whereas point C lies on soft material (lithotype #2; Vs = 250 m/s). It should be also emphasised that the soil nonlinearity somewhat
reduces the 2D effects: for tectonic scenario the 2D/1D peaks in the 1–2 Hz range are 3 and 2.5 for linear and equivalent linear analyses, respectively. For volcanic scenario linear and equivalent linear, numerical simulations provide more compa-rable aggravation factors (see Fig.10c, d) probably due to the minor nonlinear behaviour: volcanic input spectra have minor spectral acceleration at 1–2 Hz (about half of corresponding tectonic input values, see Fig.7). Maximum shear strain pro-files at representative location B indicate that a maximumγ is reached at a depth of about 20 m (i.e. at the bottom of soft lithotype 1, Fig.8) being in the order of 0.01% and 0.04% for volcanic and tectonic input, respectively. In general, these deformations are lower than 0.1%, thus supporting the use of the equivalent linear approach for both 1D and 2D numer-ical analyses (Kaklamanos and Bradley2015).
By considering the 1D average spectral amplification func-tions (Fig.11), we observed that the peak of amplification is achieved at points A and B in the 1–1.5 Hz range and, there-fore, in the same range in which 2D effects are found. This suggests that the seismic response of the maar is essentially driven by 1D amplification phenomena and it is enhanced by the interaction of direct S waves with Rayleigh waves
Fig. 9 Bidimensional amplification functions in terms of spectral accelerations computed for model 1 for tectonic (a, b) and volcanic scenario (c, d); results are from linear viscoelastic (a, c) and equivalent linear (b, d) analyses
generated at edges of the most superficial lithotypes (#1 and #2 in Table1).
The ground motion across the maar
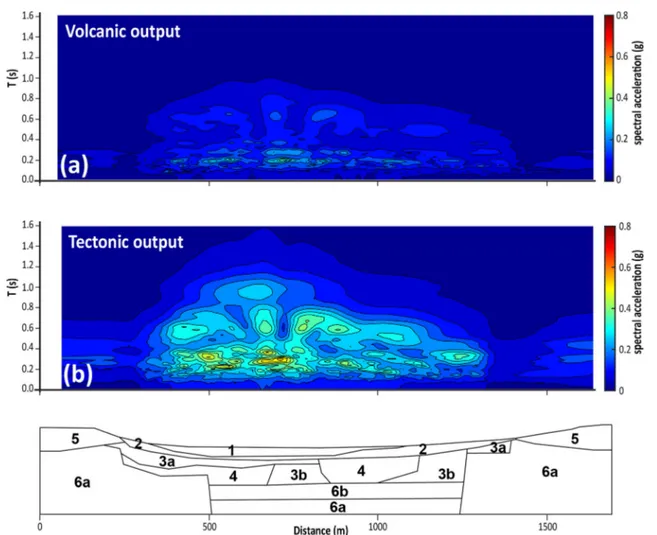
Contours of spectral acceleration along the maar surface from equivalent linear are reported in Fig.12for both scenarios, by considering average values for the tectonic scenario and only the BNT NS (Bronte Station) input motion for the volcanic scenario. This representation gives a picture of ground motion variation across the maar in the whole frequency range. The amplification of ground motion inside the maar with respect to the outside ring clearly appears for both scenarios. Higher spectral acceleration (up to 0.6 g) is reached in correspon-dence of the maximum thickness of the very soft lithotype #1 at the centre of the maar. For the tectonic scenario, the maximum accelerations are computed in the 0.2–0.4-s period range (2.5–5 Hz in terms of frequency), which almost corre-sponds to the peak of the input energy (Fig.7). For the volca-nic scenario, the spectral acceleration is maximum around 0.2 s.
Discussion
Physical stratigraphy and site response at the
Stracciacappa maar
The depth structure of the Stracciacappa maar (Fig.5b) reflects the idealised setting of a maar/diatreme system (e.g. Lorenz2003; Lorenz and Kurszlaukis2007; White and Ross2011; Isaia et al.
2015; Valentine et al.2015), which includes (i) syn-eruptive pyro-clastic and effusive sequences as forming the ring, (ii) post-eruptive lacustrine and epiclastic deposits within the maar crater, (iii) stratified beds of unconsolidated volcanoclastic material in the upper part of the diatreme, (iv) unbedded and mixed materials in the lower part of the diatreme, and (v) a disarticulated pre-eruptive substratum.
Our multidisciplinary dataset allows the recognition of a complex stacking of voluminous soft and stiff materials on top of a disarticulated substrate for the subsoil of the Stracciacappa maar. We identify abrupt stiffness heterogene-ities along both vertical and lateral directions within the maar. Main vertical stiffness heterogeneities correspond to (i) the stratigraphic boundary between the sediments (lacustrine and epiclastic; lithotypes #1 and #2, respectively) and the
Fig. 10 Ratio of spectral acceleration from 2D and 1D analyses computed at points A-B-C of model 1 for tectonic (a, b) and volcanic scenario (c, d); results are from linear viscoelastic (a, c) and equivalent linear (b, d) analyses
underlying chaotic lithofacies filling the upper diatreme (i.e. alternations of lithotypes #3a, #3b, and #4) and (ii) the strati-graphic boundary between the syn-eruptive deposits (lithotype #5) and the pre-eruptive substrate (lithotype #6) at the edges of the maar. Main lateral stiffness heterogeneities correspond to (i) the pinch-out and/or interfingering geome-tries between lacustrine and epiclastic deposits, (ii) the internal structure and composition of the chaotic material filling the upper diatreme, and (iii) the dislocations separating the chaot-ic material and the country substrate rocks.
Our numerical analyses demonstrate that, among these, the lithological heterogeneity within the upper diatreme (i.e. alterna-tions of lithotypes #3b and #4) and the impedance contrasts with the overlying very soft layer #1 have key influence on distribu-tion of the shear wave velocity and, in turn, induce amplitude-frequency modifications during wave propagation through the maar structure. In particular, by comparing analysis carried out from the heterogeneous model and the simplified model (in which lateral variation at depth were neglected), we conclude that subsoil lateral heterogeneity is crucial parameter for a correct prediction of ground motion in the maar. An increase in ground motion of the order of 50% can be obtained when considering the heterogeneous model1 (Table1).
Finally, by comparing the results of linear 1D and 2D site response analyses and by examining the experimental HVNSR spectral ratios, we suggest that the amplification ef-fects are essentially related to 1D resonance of the very soft lacustrine/epiclastic deposits on the stiffer underlying de-posits, significantly enhanced by 2D aggravation effects relat-ed to the interaction of direct S-waves and Rayleigh waves generated at the maar edges. Comparison between linear and equivalent linear analyses shows that nonlinear effects of la-custrine material reduce 2D effects.
General clues for assessing site effects at explosive
volcanic settings
Previous works reveal the key importance of constraining plausible subsoil setting for assessing factors leading to site effects and ground motion modifications in volcanic environ-ments (Mora et al. 2001; Almendros et al. 2004; Chávez-Garciá et al. 2007; Panzera et al.2011; Santos et al.2011; Chávez-García and Kang2014; Galluzzo et al.2016). In terms of suitable prospection methods, for such idealised setting of a maar/diatreme system, we learn from the Stracciacappa study that:
Fig. 11 1D amplification functions in terms of spectral accelerations computed for model 1 for tectonic (a, b) and volcanic scenario (c, d); results are from linear viscoelastic (a, c) and equivalent linear (b, d) analyses
(a) Ambient noise measurements reveal enough resolution for discriminating the stiffness contrast between the youngest, soft, sedimentary layers (i.e. lacustrine and epiclastic deposits) and the deeper layers filling the diatreme crater. These measurements provide clear H/V peaks whose features (in terms of amplification and res-onance frequency) help to constrain thicknesses and ve-locities of the upper layers throughout the crater. In par-ticular, HVNSR clear peaks identify the lateral variability of very soft sedimentary materials within the maar crater made by lacustrine muds and epiclastic deposits (lithotypes #1 and #2, respectively), whereas HVNSR near flat trends are related to the lack of a real impedance contrast occurring at the rim, where pyroclastic units are superimposed on the substrate. In this view, it seems that HVNSR are useful to provide insights on the first-order complexities of the volcanic structure (compare to HVNSR limitations in Chávez-García and Kang2014); (b) 2D arrays provide suitable average values of shear wave
velocity, which in our experience are useful for numeri-cal modelling of heterogeneous/chaotic media to inte-grate the pointy in-hole prospections data (i.e. VS
changes too rapidly to be properly detected by few in-hole prospections). Conversely, 2D array inversions do not show enough resolution to reconstruct the deepest layers (i.e. the seismic bedrock) due to the compromise between the array dimensions and the horizontally lay-ered hypothesis necessary to the application of the method.
(c) Electric resistivity tomography is a suitable prospection to highlight the main morphologic features and helps to identify extension and thickness of lithotypes within the maar. A realistic agreement does exist between anoma-lies observed in the ERT profiles and VSprofiles from
the 2D array inversion, as higher resistivity value corre-sponds to higher shear wave velocity and vice versa. In terms of site response, we learn from the Stracciacappa study that the expected ground motion across a maar structure is strictly related to the spatial distribution and thickness of the post-eruptive deposits that determine a strong stiffness con-trast with the underlying syn-eruptive deposits and the chaotic material filling the upper diatreme. A simplified scheme of a maar/diatreme system is provided in Fig. 13a, where the
Fig. 12 Results of equivalent linear numerical analyses in terms of contours of 2D spectral acceleration (expressed in g) at surface for a volcanic and b tectonic earthquake scenario
spatial distribution of deposits (classified in terms of pre-erup-tive, syn-eruppre-erup-tive, post-eruppre-erup-tive, and diatreme-filling) is cor-related with the expected ground motion generated after a generic seismic pulse. Noteworthy, our scenario infers that maximum expected ground motion is attained in the central part of the maar crater, where the maximum thickness of the post-eruptive deposits is reached, whereas no ground motion amplification is expected in correspondence of the stiffness contrast between the syn-eruptive deposits and the underlying pre-eruptive substratum at the maar ring. Therefore, we pro-pose a schematic correlation (Fig.13b) between vertical strat-igraphic heterogeneity and expected ground motion modifica-tion that could be considered for a maar/diatreme system sim-ilar to the Stracciacappa case study, i.e. in those volcanic set-tings where chaotic and violent events may determine hetero-geneous distribution of deposits in both vertical and lateral directions.
Finally, we consider our 1D and 2D outcomes as useful to set the ground for a 3D geometry, which better approximates the complex setting of maars and similar apparatus in explo-sive volcanic environments. We expect that 3D numerical simulations represent a challenge to identify near-field and far-field geological/geotechnical conditions in volcanic envi-ronments to be modelled in the light of site response assess-ment, as documented for non-volcanic sites characterised by complex geological and morphological features (e.g. Smerzini et al.2011; Wang et al.2018). The comparison between 1D, 2D, and 3D numerical approaches could improve our under-standing of additional subsoil heterogeneities in volcanic set-tings, including, but not limited to, the pattern migration and the accumulation of fluids causing overpressure conditions and hydrothermal paroxysm activity (e.g. Isaia et al.2015; Vignaroli et al.2015).
Conclusions
The Stracciacappa maar case study (Sabatini Volcanic District, central Italy) provides a close correlation between physical stratigraphy and distribution of local seismic re-sponse in an explosive volcanic setting. The results indicate that the occurrence of alternating soft and stiff materials in the central part of the maar strongly affects site amplifications occurring at the surface. The study also shows that electric resistivity tomography is a prospection suitable to highlight the main morphologic features and helps to identify lithotypes within the maar, while 2D seismic arrays provide suitable average values of S-wave velocity.
By comparing the results of linear 1D and 2D site response analyses and by examining the experimental HVNSR spectral ratios, it can be speculated that amplification effects are essential-ly related to 1D resonance of the very soft deposits on the stiffer underlying units, significantly enhanced by 2D aggravation ef-fects related to the interaction of direct S-waves and Rayleigh waves generated at the maar edges. Therefore, the Stracciacappa case study demonstrates that even if 1D model can be represen-tative of the expected effects, an exclusively 1D approach is not enough to explain the possible effects in such complex volcanic settings, as it can significantly underestimate amplifications.
It is proposed that complex site effects typical of volcanic setting can generally be ascertained by 2D subsoil models that are capable of better capturing level of amplification phenom-ena. It turns out that, in seismic microzonation studies on volcanic areas, 1D approaches should be used along with 2D modelling. Outcomes from 1D and 2D numerical simulations are expected to set the stage for the 3D computation of local seismic response at sites characterised by complex subsoil geological features.
Fig. 13 a Simplified stratigraphic setting of a maar/diatreme system and expected distribution of the ground motion amplification generated after a seismic pulse. This study suggests that the ground motion amplification is maximum in the central part of the maar, where maximum thickness of the post-eruptive deposits (of lacustrine origin) is reached above the
chaotic material filling the upper diatreme; b schematic diagram relating the expected ground motion amplification with the vertical stratigraphic heterogeneity in a typical maar structure, moving from the ring to the centre of the maar
Acknowledgements Open access funding provided by Alma Mater Studiorum - Università di Bologna within the CRUI-CARE Agreement. The manuscript benefits from the criticisms by three anonymous re-viewers who are thanked. The Editor (L. N.Y. Wong) is thanked for the editorial management. C. Felicetta and D. Pileggi are acknowledged for the work in the field and for constructive advices.
Funding information This work was funded by the Italian Civil Protection Department of the Presidency of the Council of Ministers, in the framework of a DPC-CNR IGAG agreement (DPC funds 2014).
Open Access This article is licensed under a Creative Commons Attribution 4.0 International License, which permits use, sharing, adaptation, distribution and reproduction in any medium or format, as long as you give appropriate credit to the original author(s) and the source, provide a link to the Creative Commons licence, and indicate if changes were made. The images or other third party material in this article are included in the article's Creative Commons licence, unless indicated otherwise in a credit line to the material. If material is not included in the article's Creative Commons licence and your intended use is not permitted by statutory regulation or exceeds the permitted use, you will need to obtain permission directly from the copyright holder. To view a
copy of this licence, visithttp://creativecommons.org/licenses/by/4.0/.
References
Acocella V, Palladino DM, Cioni R, Russo P, Simei S (2012) Caldera structure, amount of collapse, and erupted volumes: the case of
Bolsena caldera, Italy. Geol Soc Am Bull 124:1562–1576.https://
doi.org/10.1130/B30662.1
Alleanza GA, d’Onofrio A, Gargiulo F, Silvestri F, Mancini M, Gaudiosi
I, Caciolli MC, Cavuoto G, Di Fiore V, Milana G, Vassallo M (2020) Valutazione della risposta sismica locale di alcune aree
dell’Isola di Ischia per la pianificazione di interventi di mitigazione
del Rischio Sismico. Memorie del XXVII Convegno nazionale di
Geotecnica,‘La geotecnica per lo sviluppo sostenibile del territorio e
per la tutela dell’ambiente’, Reggio Calabria, 07-09/07/2021, p 8 (in
press)
Almendros J, Luzón F, Posadas A (2004) Microtremor Analyses at Teide Volcano (Canary Islands, Spain): assessment of natural frequencies of vibration using time-dependent horizontal-to-vertical spectral
ra-tios. Pure Appl Geophys 161:1579–1596.https://doi.org/10.1007/
s00024-004-2522-5
Ambraseys NN, Douglas J, Sarma SK, Smit PM (2005) Equations for the estimation of strong ground motions from shallow crustal earth-quakes using data from Europe and the Middle East: horizontal peak ground acceleration and spectral acceleration. Bull Earthq Eng 3:1– 53
Anderson JG (2007) Physical processes that control strong ground mo-tion. In: Schubert G (ed) Treatise on geophysics, earthquake
seis-mology, vol 5. Elsevier, Amsterdam, pp 513–565
Árnason K, Eysteinsson H, Hersir G (2010) Joint 1D inversion of TEM and MT data and 3D inversion of MT data in the Hengill area, SW Iceland. Geothermics 39:13–34
Avanzinelli R, Lustrino M, Mattei M, Melluso L, Conticelli S (2009) Potassic and ultrapotassic magmatism in the circum-Tyrrhenian re-gion: significance of carbonated pelitic vs. pelitic sediment recycling
at destructive plate margins. Lithos 113:213–227
Bard PY, Bouchon M (1985) The two-dimensional resonance of
sediment-filled valleys. Bull Seismol Soc Am 75:519–541
Bettig B, Bard PY, Scherbaum F, Riepl J, Cotton F, Cornou C, Hatzfeld D (2001) Analysis of dense array noise measurements using the modified spatial autocorrelation method (SPAC). Application to
the Grenoble area. B Geofis Teor Appl 42:281–304
Bibby HM, Caldwell TG, Davey FJ, Webb TH (1995) Geophysical ev-idence on the structure of the Taupo volcanic zone and its
hydro-thermal circulation. J Volcanol Geotherm Res 68:29–58
Bonnefoy-Claudet S, Baize S, Bonilla LF, Berge-Thierry C, Pasten C, Campos J, Volant P, Verdugo R (2009) Site effect evaluation in the basin of Santiago de Chile using ambient noise measurements.
Geophys J Int 176:925–937.https://doi.org/10.1111/j.1365-246X.
2008.04020.x
Bozzano F, Gaeta M, Lenti L, Martino S, Paciello A, Palladino DM, Sottili G (2013) Modeling the effects of eruptive and seismic activ-ities on flank instability at Mount Etna, Italy. J Geophys Res Solid
Earth 118.https://doi.org/10.1002/jgrb.50377
Chávez-García FJ, Kang TS (2014) Lateral heterogeneities and microtremors: limitations of HVSR and SPAC based studies for site
response. Eng Geol 174:1–10.https://doi.org/10.1016/j.enggeo.
2014.02.007
Chávez-Garciá FJ, Domínguez T, Rodríguez M, Pérez F (2007) Site effects in a volcanic environment: a comparison between HVSR and array techniques at Colima, Mexico. Bull Seismol Soc Am 97:
591–604.https://doi.org/10.1785/0120060095
Conticelli S, Francalanci L, Manetti P, Cioni R, Sbrana A (1997) Petrology and geochemistry of the ultrapotassic rocks from the Sabatini Volcanic District, central Italy: the role of evolutionary processes on the genesis of variably enriched alkaline magmas. J
Volcanol Geotherm Res 75:107–136
Cundari A (1979) Petrogenesis of Leucite-bearing lavas in the Roman volcanic region, Italy, The Sabatini Lavas. Contrib Mineral Petrol
70:9–21
D’Amico S, Meroni F, Sousa ML, Zonno G (2016) Building vulnerability
and seismic risk analysis in the urban area of Mt. Etna volcano
(Italy). Bull Earthq Eng 14:2031–2045.https://doi.org/10.1007/
s10518-015-9804-4
D’Elia B, Lanzo G, Pagliaroli A (2003) Small-strain stiffness and
damping of soils in a direct simple shear device. In: Proceedings of the Pacific Conf. on Earth. Eng., Christchurch, New Zealand, paper #111
Darendeli MB (2001) Development of a new family of normalized mod-ulus reduction and material damping curves. Ph.D Dissertation, The University of Texas at Austin, 362 pp
De Benedetti AA, Funiciello R, Giordano G, Diano G, Caprilli E, Paterne M (2008) Volcanology history and myths of the Albano maar. In: Cashman K, Giordano G (eds) Archaeology history and legends of
volcanoes. J Volcanol Geoth Res, Sp. Vol 176, 387–406.https://doi.
org/10.1016/j.jvolgeores.2008.01.035
De Rita D, Sposato A (1986) Correlazione tra eventi esplosivi e assetto strutturale del substrato sedimentario nel complesso vulcanico
Sabatino. Mem Soc Geol It 35:727–733
De Rita D, Zanetti G (1986) I centri esplosivi di Baccano e Stracciappe (Sabatini orientali, Roma): analogie e differenze della modellistica esplosiva in funzione del grado di interazione acqua/magma. Mem
Soc Geol It 35:689–697
De Rita D, Funiciello R, Rossi U, Sposato A (1983) Structure and
evo-lution of the Sacrofano–Baccano Caldera, Sabatini volcanic
com-plex, Rome. J Volcanol Geotherm Res 17:219–236
Eskişar T, Kuruoğlu M, Altun S, Özyalın Ş, Yılmaz HR (2014) Site
response of deep alluvial deposits in the northern coast ofİzmir
Bay (Turkey) and a microzonation study based on geotechnical
aspects. Eng Geol 172:95–116
Funiciello R, Mariotti G, Parotto M, Preite-Martinez M, Tecce F, Toneatti R, Turi B (1979) Geology, mineralogy and stable isotope
geochemistry of the Cesano geothermal field (Sabatini Mts. volcanic
system, northern Latium, Italy). Geothermics 8:55–73
Funiciello R, Giordano G, De Rita D (2003) The Albano maar lake (Colli
Albani volcano, Italy): recent volcanic activity and evidence of pre–
Roman Age catastrophic lahar events. J Volcanol Geotherm Res
123:43–61.https://doi.org/10.1016/S0377-0273(03)000271
Galli P, Giocoli A, Peronace E, Piscitelli S, Quadrio B, Bellanova J (2014) Integrated near surface geophysics across the active Mount Marzano Fault System (southern Italy): seismogenic hints. Int J
Earth Sci 103:315–325.https://doi.org/10.1007/s00531-013-0944-y
Galluzzo D, Bianco F, La Rocca M, Zonno G (2016) Ground motion observations and simulation for local earthquakes in the Campi
Flegrei volcanic area. Bull Earthq Eng 14:1903–1916.https://doi.
org/10.1007/s10518-015-9770-x
Gaudiosi I, Vignaroli G, Sirianni P, Giallini S, Mori F, Polpetta F, Razzano R, Simionato M, Moscatelli M (2016) Local seismic re-sponse studies in the north-western portion of the August 24th, 2016 Mw 6.0 earthquake affected area. The case of Visso village (Central
Apennines). Ann. Geophys. 59, Fast Track 5,https://doi.org/10.
4401/ag-7258
Giallini S, Pizzi A, Pagliaroli A, Moscatelli M, Vignaroli G, Sirianni P, Mancini M, Laurenzano G (2020) Evaluation of complex site effects through experimental methods and numerical modelling: the case
history of Arquata del Tronto, central Italy. Eng Geol 272.https://
doi.org/10.1016/j.enggeo.2020.105646
Giardini M (2007) Late Quaternary vegetation history at Stracciacappa
(Rome, central Italy). Veg Hist Archaeobotany 16:301–316
Giocoli A, Quadrio B, Bellanova J, Lapenna V, Piscitelli S (2014) Electrical resistivity tomography for studying liquefaction induced by the May 2012 Emilia-Romagna earthquake (M w= 6.1, North
Italy). Nat Hazard Earth Syst 14:731–737.https://doi.org/10.5194/
nhess-14-731-2014
Hudson M, Idriss IM, Beikae M (1994) QUAD4M: a computer program to evaluate the seismic response of soil structures using finite ele-ment procedures and incorporating a compliant base. Univ. of California Davis
Isaia R, Vitale S, Di Giuseppe MG, Iannuzzi E, D’Assisi Tramparulo F,
Troiano A (2015) Stratigraphy, structure, and volcano-tectonic evo-lution of Solfatara maar-diatreme (Campi Flegrei, Italy). Geol Soc
Am Bull 127(9–10):1485–1504.https://doi.org/10.1130/B31183.1
Jousset P, Douglas J (2007) Long-period earthquake ground displace-ments recorded on Guadeloupe (French Antilles). Earthq Eng
Struct Dyn 36:949–963
Joyner WB, Chen ATF (1975) Calculation of nonlinear ground response in earthquakes. Bull Seismol Soc Am 65(5):1315–1336
Kaklamanos J and Bradley BA (2015) Evaluation of 1D nonlinear total-stress site response model performance at 114 KiK-net downhole
array sites. Proc. 6thInternational Conference on Earthquake
Geotechnical Engineering, 1–4 November 2015, Christchurch, New Zealand
Kishida T, Wehling TM, Boulanger RW, Driller MW, Stokoe Ii KH (2009) Dynamic properties of highly organic soils from Montezuma slough and Clifton court. J Geotech Geoenviron
135(4):525–532
Kuhlemeyer RL, Lysmer J (1973) Finite element method accuracy for wave propagation problems. J Soil Mech Found Div ASCE
99(SM5):421–427
Lacoss RT, Kelly EJ, Toksöz MN (1969) Estimation of seismic noise
structure using arrays. Geophysics 34:21–38
Lanzo G, Pagliaroli A, D’Elia B (2003) Numerical study on the
frequency-dependent viscous damping in dynamic response analy-ses of ground. In: Latini, Brebbia (eds) Earthquake Resistant
Engineering Structures IV. WIT Press, Boston, pp 315–324
Lanzo G, Silvestri F, Costanzo A, d'Onofrio A, Martelli L, Pagliaroli A, Sica S, Simonelli A (2011) Site response studies and seismic
microzoning in the Middle Aterno valley (L'aquila Central Italy).
Bull Earthq Eng 9:1417–1442
Le Roux O, Cornou C, Jongmans D, Schwartz S (2012) 1-D and 2-D resonances in an Alpine valley identified from ambient noise
mea-surements and 3-D modeling. Geophys J Int 191:579–590
Licata V, Forte G, d’Onofrio A, Santo A, Silvestri F (2019) A multi-level
study for seismic microzonation of the Western area of Naples
(Italy). Bull Earthq Eng 17:4711–4741.https://doi.org/10.1007/
s10518-019-00665-6
Loke MH (2018) Tutorial: 2-D and 3-D electrical imaging surveys.
Geotomo Software, Malaysia. Available at: http://www.
geotomosoft.com
Loke MH, Barker RD (1996) Rapid least-squares inversion of apparent resistivity pseudosections by a quasi-Newton method. Geophys
Prospect 44:131–152
Lorenz V (2003) Maar-diatreme volcanoes, their formation, and their
setting in hardrock and soft-rock environments. Geolines 15:72–83
Lorenz V, Kurszlaukis S (2007) Root zone processes in the phreatomagmatic pipe emplacement model and consequences for the evolution of maar diatreme volcanoes. J Volcanol Geotherm
Res 159:4–32.https://doi.org/10.1016/j.jvolgeores.2006.06.019
Lysmer J, Kuhlemeyer RL (1969) Finite dynamic model for infinite
me-dia. J Eng Mech 95(EM4):859–877
Mancini M, Marini M, Moscatelli M, Pagliaroli A, Stigliano F, Di Salvo C, Simionato M, Cavinato GP, Corazza A (2014) A physical stra-tigraphy model for seismic microzonation of the Central
Archaeological Area of Rome (Italy). Bull Earthq Eng 12:1339–
1363.https://doi.org/10.1007/s10518-014-9584-2
Marra F, Sottili G, Gaeta M, Giaccio B, Jicha B, Masotta M, Palladino DM, Deocampo DM (2014) Major explosive activity in the Monti Sabatini Volcanic District (central Italy) over the 800-390 ka inter-v a l : g e o c h r o n o l o g i c a l - g e o c h e m i c a l o inter-v e r inter-v i e w a n d
tephrostratigraphic implications. Quat Sci Rev 94:74–101
Martín-Serrano A, Vegas J, García-Cortés A, Galán L, Gallardo-Millán JL, Martín-Alfageme S, Rubio FM, Ibarra PI, Granda A, Pérez-Gonzaléz A, García-Lobón JL (2009) Morphotectonic setting of maar lakes in the Campo de Calatrava Volcanic Field (Central
Spain, SW Europe). Sediment Geol 222:52–63.https://doi.org/10.
1016/j.sedgeo.2009.07.005
Massa M, Barani S, Lovati S (2014) Overview of topographic effects based on experimental observations: meaning, causes and possible
interpretations. Geophys J Int 197(3):1537–1550.https://doi.org/10.
1093/gji/ggt341
Mihalić S, Oštrić M, Krkač M (2011) Seismic microzonation: a review of
principles and practice. Geofizika, Review paper UDC 550.340 28:
5–20
Milana G, Rovelli A, De Sortis A, Calderoni G, Coco G, Corrao M, Marsan P (2008) The role of long-period ground motions on mag-nitude and damage of volcanic earthquakes on Mt. Etna, Italy. Bull
Seismol Soc Am 98:2724–2738. https://doi.org/10.1785/
0120080072
Mora MM, Lesage P, Dorel J, Bard PY, Métaxian JP, Alvarado GE, Leandro C (2001) Study of seismic site effects using H/V spectral
ratios at Arenal Volcano, Costa Rica. Geophys Res Lett 28:2991–
2994
Moscatelli M, Piscitelli S, Piro S, Stigliano F, Giocoli A, Zamuner D, Marconi F (2014) Integrated geological and geophysical investiga-tions to characterized the anthropic layer of the Palatine hill and
Roman Forum (Rome, Italy). Bull Earthq Eng 12:1319–1338.
https://doi.org/10.1007/s10518-013-9460-5
Nakamura Y (1989) A method for dynamic characteristics estimates of subsurface using microtremor on the round surface. Railway
Technical Research Institute, Quarterly Reports 30:25–33
Nunziata C (2007) A physically sound way of using noise measurements in seismic microzonation, applied to the urban area of Napoli. Eng