UNIVERSITY OF CAMERINO
School of Advanced Study
Doctoral course in
Chemical and Pharmaceutical Sciences and Biotechnology
XXXI Cycle
C
C
H
H
E
E
M
M
I
I
C
C
A
A
L
L
T
T
O
O
O
O
L
L
S
S
F
F
O
O
R
R
F
F
O
O
O
O
D
D
Q
Q
U
U
A
A
L
L
I
I
T
T
Y
Y
A
A
S
S
S
S
E
E
S
S
S
S
M
M
E
E
N
N
T
T
Academic Year 2017/2018
PhD Candidate:
Dr. Maria Chiara Boarelli
Unicam Supervisor:
Prof. Dennis Fiorini
3
INDEX
Abstract……… 6
Chapter 1. A new system to analyze volatile organic compounds (VOCs)
produced during cooking……… 7
1.1 Introduction………. 8
1.1.1 Indoor air quality (IAQ)……….. 8
1.1.2 Hazardous and odorous pollutant emission during cooking activities…….. 11
1.1.3 The principles of air flow, air pressure and air filtration……….….. 13
1.1.4 Cooking hoods………... 19
1.1.5 Filters………. 21
1.1.6 Olfactometric bags………...………. 25
1.1.7 Aim of the work………...………. 28
1.2 Materials and Methods………...………... 30
1.2.1 Reagents and standards………...……….. 30
1.2.2 Samples and sample preparation………...……….... 30
1.2.3 Hood aspiration filters………...……….... 32
1.2.4 Headspace-solid phase microextraction and gas chromatography-mass
spectrometry analysis (SPME-GC-MS)..………...………... 33
1.2.5 Statistical analysis of data………...……….……. 34
1.3 Results and Discussion………...……….……….. 35
1.3.1 Evaluation of different SPME extraction methods………...…… 35
1.3.2 Blank samples analysis………...……….…. 39
1.3.3 Evaluation of different SPME extraction times………...………. 41
1.3.4 Qualitative composition………...………. 46
1.3.5 Quantitative (relative) composition………...……….... 48
1.3.6 Activated charcoal AC 90 filter………...………. 49
1.3.7 Washable filter 1100-6 1400-11………...………. 62
1.3.8 Helsa-Sorbexx-CS filter………...………. 75
1.4 Conclusions………...………..….. 94
4
Abstract……….. 99
Chapter 2. Characterization and authentication of extra virgin olive oils
(EVOOs)..………. 100
2.1 Introduction.……….. ..101
2.1.1 Mediterranean diet and extra virgin olive oil (EVOO).………….………. 101
2.1.2 Monovarietal extra virgin olive oils (MEVOOs): an Italian excellence…. 103
2.1.3 Chemical characteristics of EVOO.………….………... 107
2.1.4 Sensorial analysis.………….……….. 109
2.1.5 Aim of the work.………….……….... 111
2.2 Materials and Methods.………….……….. 112
2.2.1 Samples……….……….. 112
2.2.2 Acidity and peroxide value……….……… 112
2.2.3 Fatty acids composition……….………. 112
2.2.4 Fatty acids alkyl esters……….………... 112
2.2.5 Determination of α-tocopherol……….………... 113
2.2.6 Folin-Ciocalteu assay……….………. 113
2.2.7 Quantification of polyphenols by HPLC-DAD-ESI/MS……….. ..114
2.2.8 Volatile substances……….………... ..114
2.2.9 Sensory analysis……….………. 115
2.2.10 Statistical analysis……….………... 115
2.3 Results and Discussion……….………. ..116
2.3.1 Fatty acids composition……….………. .116
2.3.2 Fatty acids alkyl esters……….……….….. 124
2.3.3 α-Tocopherol……….……….. 128
2.3.4 Polyphenols……….……….. ..132
2.3.5 Volatile substances……….………..…. ..150
2.3.6 Sensory analysis……….………...….. 165
2.4 Conclusions……….……….. ..170
References……….……….... 208
5
Abstract……….………... 213
Chapter 3. Ergosterol: a new molecule to determine olives and oils quality…. 214
3.1 Introduction……….……….. ..215
3.1.1 Ergosterol……….………... 215
3.1.2 Aim of the work……….………. 217
3.2 Materials and Methods……….………. ..218
3.2.1 Reagents and standards……….……….. 218
3.2.2 Samples……….……….. 218
3.2.3 Sample preparation……….………. 218
3.2.4 LC pre-separation……….………... 219
3.2.5 GC-MS analysis……….………. 219
3.2.6 Validation method……….……… ..220
3.2.7 Extraction from olives……….……….... 220
3.2.8 Microbiological analysis……….……… 220
3.3 Results and Discussion……….………. ..221
3.3.1 Ergosterol quantification……….……….. ..221
3.3.2 Correlation between ergosterol and other quality parameters……….….. ..228
3.3.3 Ergosterol in microbiologically spoiled olives……….………. ..235
3.4 Conclusions……….……….. ..237
6
Abstract
There is nowadays more awareness on the impact on health of pollutants emitted even during cooking both from commercial as well as from domestic activities. In this study, it has been set up a new system allowing to analyse by solid-phase microextraction and gas chromatography coupled to mass spectrometry (SPME-GC-MS) the volatile organic compounds (VOCs) emitted during cooking. This could be done by aspiring into a polyethylene terephthalate (PET, Nalophan) bag the air over a cooking process. The bag allows to transport the sample to the instrument location and to perform the SPME extraction of the sampled air. The efficiency of different systems to perform the SPME extraction from the air contained in the bag was assessed by using a standard mixture of alkanes in order to obtain a sufficient sensitivity. Then the defined system was used to extract and analyse VOCs in air obtained during frying fries in sunflower oil. Several SPME extraction times (1h, 3h, 5h, 7h and 24h) were evaluated bringing to results that can be useful both with short extraction times and with long extraction times. Then the evaluation of three different filters was performed. Thus, the developed system, combining the use of olfactometric bags and the SPME-GC-MS, is applied for the first time to the study VOCs emitted during cooking and it allows to perform the analysis, even on samples produced in sites far from the instrument location, in an easy way and with instrumentations available in most of the laboratories. The results show a different retention effect for each filter under investigation on the classes of molecules detected. In particular, it has been found that, one of the three examined filters gives better filtering performance than the other two, confirmed also by the statistical analysis.
7
Chapter 1.
A new system to analyze volatile organic
compounds (VOCs) produced during
cooking
8
1.1 Introduction
1.1.1 Indoor air quality (IAQ)
Indoor air quality (IAQ) is a common term generally used to describe the air quality within a building environment. IAQ theme has become an important current issue for the community due to the increased amount of personal time spent in indoor environment. Nowadays in fact, people spend approximately 90% of their time in an indoor environment such as home, office, school, car, shopping center and public buildings. In a recent study, it was seen that in the USA for example, adults spend around 21 h/day indoors while children spend, on average, 17-19 h/day indoors; consequently, the attention to safety has grown [1]. A large number of studies have shown that the level of pollutants in indoor environment is higher than that in outdoor environment [2]. For many years, the damaging effects of contaminated air on human health have been known. Environmental studies have initially focused on outdoor air and the potential problems of elevated levels of particulate and gas contaminants on health. However, over the last 30 years, there have been significant developments in this field: in fact, the evident impacts of the IAQ on people health makes important to find new approaches in order to reduce adverse health consequences, to improve quality of life and the work environment with consequential human benefits [3]. The main air pollutants contributing to decrease IAQ are carbon dioxide (CO2), carbon monoxide (CO), formaldehyde (HCOH), nitrogen dioxide (NO2), sulfur dioxide (SO2), volatile organic compounds (VOCs) and particulate matter (PM2.5 and PM10) [2]-[4]. In particular, PM2.5 and PM10 (fraction of particulate matter with aerodynamic diameter range smaller than 2.5 µm and 10 µm, respectively) are usually chosen as indicators of air pollution rather than total suspended particulate matter (TSPM), since such particles are small enough to enter the thoracic region [5]. In addition to this, air temperature, velocity and humidity levels are further IAQ factors associated with thermal comfort zone. The accumulation of these contaminants, in combination with other factors, likes low ventilation and moisture in building materials, leads to “sick building syndrome” (SBS), which cause sensory irritation or invoke effects on the central and peripheral systems, and to other reported diseases in affected spaces as respiratory problems (children are particularly affected), immune - allergy to dust mites, skin and mucous membranes diseases (especially to formaldehyde), cardiovascular problems, liver, kidney and gastro-intestinal diseases and cancer (connected to tobacco smoke and radon) [3]. Therefore, many countries’ national organizations and worldwide influential committees, as an example World Health Organization (WHO), have stipulated standard and guideline values that encourage improving IAQ management. In general, IAQ standard guidelines establish values
9
which are recommended during the development of a facility. An IAQ target value is defined as value that one should seek to achieve by a set date, while an IAQ limit value is a legally binding value in legislation that must not be exceeded to avoid risk of penalty or punishment. Considering these different values' definitions, to understand the application of IAQ guidelines and standard values to minimize health effects and reducing the probability of SBS, has become of considerable importance. International agencies that establish air quality guidelines and standards are listed in Table 1. Some of these are the American Society of Heating, and Refrigerating and Air-Conditioning Engineers (ASHRAE), the National Health and Research Council of Australia (NHMRC), the American Conference of Governmental Industrial Hygienists (ACGIH), Health Canada and the Deutsche Forschungs Gemeinschaft (DFG/MAK) Commission [4].
10
Table 1. International bodies involved in setting air quality guidelines and standards [4] a It consists of 28 member states, including the UK, Italy, Spain, Portugal and Germany as well
11
1.1.2 Hazardous and odorous pollutant emission during cooking activities
As a consequence of healthcare science progress, human life expectancy has increased gradually over the years; many risks that previously threatened human life, with the advances of civilization and urbanization have been reduced or eliminated. Nevertheless, other kinds of risk are arising in our normal everyday life; in fact not many people are aware of the risks associated with cooking activities. The impact on human health of pollutants emissions from domestic and commercial cooking activity are often overlooked throughout the world; all populations have become exposed to this cooking-related risk, regardless of their race, age, wealth, cultural food preferences, etc. [6]. Humans can be subject to cooking-related risks via various intake routes either directly (overcooked foodstuffs) or indirectly (fumes). The cooking processes like frying, roasting, grilling, steaming, barbecuing, smoking, microwaving, boiling and broiling, contribute to emissions of pollutants, particularly in closed, poorly ventilated areas where air quality is deeply influenced on their presence. Furthermore, considering that the most of fire-based cooking cannot be carried out without fuels, the effect of fuel combustion can add to the risks of cooking activities: cooking fuels are one of the most important causes of indoor air pollutants (IAPs), especially in developing countries [6]. Pollutant emissions from food mainly result from heating and cooking operation through which organic materials in the food are volatilized. The nature and quantities of pollutants emitted from those sources would highly depend on the cooking stuff, cooking styles, and even on cooking fuel [6]-[7]. However,food cooking not only is a known source of IAP, but also of odor emissions. Odor nuisance is generally defined by the four factors: frequency, intensity, duration, and offensiveness. These key properties can be defined briefly as follows: frequency refers to the number of times an odor occurs, intensity refers to the strength of an odor, duration refers to the period of time an odor is encountered, and offensiveness refers to the character or hedonic tone of the odor (pleasant or unpleasant) [7]. Different kinds of pollutants such as reduced sulfur compound (RSC), aldehydes, organic acids, ketones and polycyclic aromatic hydrocarbons (PAHs) are common components found in cooking oil fumes (COFs) [8]. These volatile organic compounds (VOCs) are the principle known IAP. The WHO classifies VOCs as indoor organic pollutants with a boiling point range between 50/100°C and 240/260°C [1]. Many VOCs are known to be toxic and are considered carcinogenic, mutagenic or teratogenic. In fact, as known in the literature [8], PAHs and hydrocarbons (HCs) are carcinogenic for people and may produce respiratory symptoms or local irritation in the airways. Studies regarding the activities of cooking in China and Taiwan have confirmed the development of these diseases due to exposure to the COFs, which has potential adverse effects on human health, because of the presence of compounds such as PAHs,
12
heterocyclic amines and unsaturated aldehydes [9]-[10]. Umano et al. [11], focused their attention on the acrolein effects. Acrolein is an α,β-unsaturated aldehyde, which is formed from the dehydration of glycerol when animal and/or vegetable fats are heated to high temperatures, and it is a liver toxic substance and an irritant for the gastric mucosa. In addition to this aspect, other studies, considered the odorant behavior of these molecules. Kabir et al. [7], studied the emissions from the roasted coffee seeds of six sample types, indicating that RSCs like hydrogen sulfide (H2S), methyl mercaptan (CH3SH), dimethyl sulfide (DMS), dimethyl disulfide (DMDS), aldehydes (such as acetaldehyde, propionaldehyde, butyraldehyde and isovaleraldehyde), organic acids (like propionic acid, butyric acid, isovaleric acid and valeric acid) and other VOCs such as toluene, styrene, p-xylene, methyl ethyl ketone (MEK), methyl isobutyl ketone (MIBK) are the principle odorants. On the contrary Blanda et al. [12], demonstrated that the generation of off-odours and off-flavours in boiled potatoes (POF) are strongly correlated with the presence of 2-pentanal, 2-hexanal, 2-heptanal, 2-pentylfuran and 2-decenal. As regards fishy odor, it is known that 1-penten-3-one, 1-octen-3-one, (Z)-4-heptenal, (E,Z)-2,6-nonadienal, (E,Z)-2,4-heptadienal and (E,Z,Z)-2,4,7-decatrienal are molecules responsible for the bad odors [13]. Therefore, for all these reasons, the monitoring of these substances both in private environments (as for example in the domestic kitchen environment) and in public environments (such as restaurants, fast-food, etc.), is particularly important in order to safeguard the public and private health.
13
1.1.3 The principles of air flow, air pressure and air filtration
Comfort air conditioning is described as "the processes of treating air to simultaneously control
its temperature, humidity, cleanliness and distribution to meet the comfort requirements of the occupants of the conditioned space" [14]. Air conditioning used in other fields than comfort is classified as "industrial air conditioning". Anyway, the four requirements of temperature, humidity, cleanliness and distribution control are applied equally to industrial conditioning. The air we breathe is a mixture of gases, composed of 21% oxygen (O2), 78% nitrogen (N2), 1% argon (Ar) and carbon dioxide (CO2), and traces of other gases (Figure 1).
Figure 1. Air composition
Air we breathe also includes VOCs, particulate material and gases generated by nature, by man, industrial processes, building materials and finishes, building contents such as furniture and fixtures, cooking odors, that influence our health or comfort, that damage the spaces we occupy, or that affect the products or components we are manufacturing. Therefore, air filtration becomes particularly important, because it supplies the means to obtain the level of particulate and molecular cleanliness required by any definition of air conditioning. It ranges from the simple task of preventing larger particles from plugging heating/cooling coils, to removing particles which can become a respiratory irritant or hazard, or molecular contaminants and particles as small as 0.1 µm and smaller which could cause a short circuit on a microchip [14]. For this reason, facility managers should always look to air filtration and cleaning as the best way to protect the health and safety of the occupants in a facility by removing contaminants from the
14
air. The flow of air between two points is due to the occurrence of a pressure difference between the two points. This pressure difference results in a force placed on the air, usually by fan, causing the air to flow from the area of higher pressure to the area of lower pressure. The quantity of air, usually referred to in cubic feet per minute (CFM) is represented by the symbol Q. The speed of flow or velocity of the air, usually referred to in feet per minute (FPM), is represented by the symbol V. The size of the conduit through which the air flows, usually ductwork, is referred to as area expressed in square feet and is represented by the symbol A. The air flow through a conduit, ductwork or a filter is expressed by the formula: Q = V·A [14]. As air travels through a conduit, it creates a pressure called velocity pressure (VP). There is a relationship between velocity of the air and the velocity pressure based upon the density of the air. This relationship is expressed by the formula: V = 4005 √VP, where V is the velocity in FPM, 4005 is the standard density of air derived from gravitational acceleration (32.2 ft/sec2 and air density of 0.075 pounds per cubic foot) and VP is the velocity pressure in inches of water. VP is measured in the direction of flow through a conduit and is always positive. Air confined in a conduit whether in motion or not, creates another type of pressure which exerts itself in all directions at the same time. Sometimes referred to as “bursting pressure”, this pressure is called static pressure (SP). SP is independent of the velocity of the air and can either be positive or negative depending on where it is measured in the conduit. This pressure can be measured using a device known as a Pitot tube. The figure below (Figure 2) shows the relationship of VP and SP, that is expressed by the formula: TP = SP + VP, where TP is the total pressure [14].
15
Air filters are devices that remove aerosols from an air stream as the particulate contaminated air passes through them. There are three different types of air filtration categories: mechanical air filters, filters incorporating electrostatically charged filter media and electronic air cleaners.
1. Mechanical air filters capture particulate on the filter media, the material that comprises the filter elements. There are four different processes responsible for the capture of particulates in a mechanical filter:
Impingement is the mechanism by which large, high-density particles are captured. When air flows through a filter, it must bend or change direction many times to flow around the filter fibers. However, due to their inertia, larger particles resist to change in direction and attempt to continue on in their original directions. For this reason, they collide with, and adhere to the fibers (Figure 3).
16
Interception occurs when a particle follows the air stream, but still comes in contact with the fiber as it passes around it. If the attraction forces between the fiber and the particle are greater than the force of the airflow to dislodge it, the particle will stick to the fiber. The interception process is increased when the sizes of the fiber and the particle are similar (Figure 4).
Figure 4. Interception process
Diffusion is typical for the capture of very small particles at low air velocities. While the contaminated air passes through the filter media, the small particles will take an irregular path described as Brownian Motion. This path increases the probability that particles will come in contact with fibers and will stay attached to them (Figure 5).
17
Straining is the phenomenon that happens when the smallest dimension of a particle is greater than the distance between adjoining filter media fibers (Figure 6).
Figure 6. Straining process
2. Electrostatically charged filter media (passive and active) were used for several decades. Their advantage is that the charge on the fibers increases initial filtration efficiency without affecting resistance to airflow. In the case of electrostatic attraction active, the synthetic filter fibers can be actively charged during manufacture to be either positively and/or negatively charged. This technology can be classified by the method used to create the electrostatic charge in:
Triboelectric charging; Corona charging; Charging by induction.
In the case of passive electrostatic attraction, the fiber media become electrostatically charged by the flow of air (especially dry air) through it. These filters are described as passive electrostatic filters. Most particles are charged naturally, and are held by strong electrostatic forces to the oppositely charged fiber with which they come in contact (Figure 7). The smaller a particle or a fiber is, the relatively stronger the electrostatic forces will be.
18
Figure 7. Particle attraction to charged fiber
3. Electronic air cleaners (two-stage) are externally powered devices. Air entering a two-stage air cleaner must first pass through a permanent screen or pre-filter, which catches the larger airborne particles. After passing through the pre-filter, the air enters the so called ionizer (ionizing section), or first stage, where the airborne particles receive an intense positive electrical charge. The positively charged airborne particles subsequently enter the collection (collecting sections), or second stage, which consists of a series of collector plates. These collector plates are metal plates or screens alternately charged with positive and negative high voltages. Because the airborne dust and dirt particles received a positive charge when they passed through the first stage of the electronic air cleaner, they are repelled by the positively charged plates in the second stage and propelled against the negatively charged collector plates where they adhere until washed away. The airborne particles are removed from the negative collector plates by periodic vacuuming or washing. Some electronic air cleaners are equipped with washing systems that flush the particles off the plates.
19
1.1.4 Cooking hoods
As discussed previously, VOCs are among the principle pollutants. The VOC sources can be distinguished in intermittent (Figure 8 and Figure 9) or continuous (Figure 10 and Figure 11) according to the time trends of the emission levels. Cooking food is a typical example of an intermittent and recurrent source, whose emissive profile is shown in Figure 8.
Therefore, the cooking hood represents a local indoor air filtration device.The hood is one of the most widespread household appliances, both in Italy and abroad. Its main function is the evacuation of the vapors generated by the domestic activities carried out in the kitchen, or the treatment of the same for the reinsertion of the fluid in the domestic environment. Based on these primary requirements, the product differs in a suction hood and in a filter hood. In both cases, the appliance eliminates fats by mechanical filtration systems. In the aspiration hood version, the fluid is directly discharged into the external environment by means of suitable drain pipes that connect the engine to the environment (Figure 12). In the filtering hood version (Figure 13), the aspired air after filtration is further treated to eliminate odors with a technology based on activated carbon. The purified air is returned to the kitchen again.
Figure 8. Intermittent and recurrent emission Figure 9. Intermittent and occasional emission
20
Figure 12. Aspiration hood Figure 13. Filtering hood
Thus, the kitchen hood is designed to capture cooking food fumes, consisting of a mixture of vapors, odors and particles of oil and/or fat. To perform this function, the hood is equipped with two different filtering systems:
Mechanical filters to prevent that the particles of oil and/or fat can contaminate the environment as well as damaging the hood itself;
Odor filters that absorb odorous gases in order to avoid high concentrations of unpleasant odors during cooking foods.
21
1.1.5 Filters
The filtration systems are described by different kind of factors. The Standard International (SI) system of measurements, used in most countries of the world, has established these parameters. In the following table (Table 2), SI units are reported.
MEASUREMENT SYMBOL DESCRIPTION
Air volume flow rate a m3/s Cubic meters per second
Filter pressure drop Pa Pascal
Face area m2 Square meters
Filter dimensions mm Millimeters
Particle size µm Micrometers b
Velocity m/s Mater/second
Temperature °C Degrees Celsius c
Table 2. SI units
aAirvolume flow is also given in liters per second (L/s).
b“Micron” is not used in the SI system to give dimensions of very small dust particles. Instead
the world “micrometer” is used.
c
The temperature in Celsius degrees can be obtained by subtracting 273.15 from Kelvin degrees. At 0°C the thermodynamic temperature is 273.15°K.
The most common material used in heating, ventilating and air conditioning (HVAC) system to remove the airborne molecular contaminants (AMC) is activated carbon. A variety of materials such as coal, petroleum coke, wood, and coconut shells are used in its preparation. Each raw material imparts its own special characteristics to the activated carbon which, in turn, may make it the preferred product for a specific application. However, activated charcoal is composed mostly of carbon atoms of vegetable or mineral origin; it is characterized by an extremely high porosity and has a black color; it can be found in powder (PAC) (Figure 14) or in granules (GAC) (Figure 15). Although many different kinds of activated carbon are available, there are a number of different physical properties which can be measured and used for determination of the applicability of various carbons for different uses.
22
Figure 14. Powder activated charcoal (PAC)
23
As discussed in the paragraph 1.1.4 the cooking hoods are provided of two different filtering systems: mechanical filter and odors filter. The grease filters of the hoods are generally metallic. The working principle of mechanical air filters is based on the capture of oil and/or fat particles present in the cooking food fumes, as it is possible to see in the figure below (Figure 16).
Figure 16. Particle capture with mechanical air filters
This capture involves two different considerations: the first is the probability that the particles collide or are removed from the filter medium; the second is the probability that the particles, once in contact with the filter, continue to adhere to it. The presence of mechanical filters introduces a pressure drop in the hood system, which results in an increase of energy consumption. Therefore, when mechanical air filters are chosen, it is necessary to find the right compromise between the following factors:
Efficiency: the ability of a filter to remove the highest number of particles from an air stream;
Pressure drop: the resistance that the filter opposed to the air flow. The higher the pressure drop, the greater the amount of energy required to overcome it;
Capacity: the air flow rate that a filter can handle at a specific pressure drop.
The odors filter is the second filtration system involved in the cooker hood. The operation of odor filters, used in hoods for the removal of gaseous contaminants, is based on a reversible physical process known as adsorption. Adsorption is the process by which a substance is attracted and held on the surface of another and it is usually described in terms of energy per unit area of a solid. Surface energy is caused by molecules in the surface layer of the solid, which are
24
subjected to unbalanced external forces. When the surface energy exceeds the kinetic energy of the passing molecule, the molecule is adsorbed by the solid. The adsorption capacity of solids is a function of their total surface area. The solid adsorbents are porous materials (Figure 17); therefore the useful surface extends also inside the solid itself. Activated charcoal is one of the most common adsorbent materials, in which the total surface area can reach up to 1400 m2/g.
Figure 17. Porous structure of activated charcoal
The efficiency of odors filters is dependent of the following parameters:
Efficiency of contact: the total contaminant percentage that is in contact with the adsorbent medium;
Permanence time: the amount of time that the contaminated air takes to pass through the filter, without considering the resistance opposed by the filter medium;
Adsorption efficiency: the probability that the gas molecules, coming in contact with the adsorbent particle, are retained by it;
Removal capacity: depending on the total surface area available in the adsorbent medium.
25
1.1.6 Olfactometric bags
As discussed in the previous sections, VOCs are a large group of carbon-based chemicals that easily evaporate at room temperature, but while some VOCs are odorous, many of them can not be detected by our senses, even if their inhalation may be associated with different health risk levels. Thus, it become very important to find a new analytical method that allows to detect, determine and quantify these molecules, in order to assess and improve the indoor air quality. Various analytical approaches can be used. Solid phase micro-extraction (SPME) has been developed in 1989 by Janusz Pawliszyn, as a rapid, inexpensive and easy alternative to other techniques of extraction-preconcentration, such as liquid-liquid extraction, solid phase extraction, purge and trap technique. The low cost of the device, the possibility of automation and the simplicity of coupling with instrumental methods of analysis, are additional advantages of this sampling strategy. However, the extraction is not quantitative because amount and composition of analytes extracted with this procedure depend on the equilibrium distribution between the fiber coating and the sample. Anyway, the applicability of this technique both for qualitative and quantitative purposes is shown in many literature studies. Estevez et al. [15] for example, have analyzed volatile compounds generated in meat from Iberian and lean pigs, using the SPME technique, combined with gas chromatography and mass spectrometry (GC-MS). Blanda et al. [12] and Sanches-Silva et al. [16] have used this kind of analytical method to analyzed respectively volatile components that generated off-odors and off-flavors in boiled potatoes and during the storage. SPME coupled to GC-MS has been used also to analyze volatile aroma compounds present in freshly cooked turkey breast muscle [17]. Nevertheless, numerous studies related to VOCs determination involve the use of such device in combination with a previous sampling of the air in bags typically used for olfactometric analysis where odors are evaluated both qualitatively and quantitatively using the human nose as the detector [18]. These bags (Figure 18) are made up of different types of polymeric films. In the European Committee of Normalization (CEN) standard EN 13725 (EN 13725, 2003) three bag materials are referred to as qualified for olfactometric sampling bags: tetrafluoroethylene-hexafluoropropylene copolymer (FEP), polyvinylfluoride (PVF, Tedlar) and polyethyleneterephalate (PET, Nalophan). Polymer bags are popular and commonly accepted sampling containers in different kind of analysis due to their moderate price, inertness, relatively good durability and reusability.
26
Figure 18. Olfactometric bag
In the literature, different kind of studies, regarding the use and the application of olfactometric bags, are reported. As an example, SPME combined to sampling in olfactometric bags, and subsequent GC-MS analysis has been applied to analyze fragrances from live plants [19]. In order to evaluate gas purification installations at landfills and sewage treatment plants, the correct quantification of siloxane levels in biogas is essential [20]. Also in this case, olfactometric bags are by far the most widely used biogas sampling method in Germany and have recently been included in the Association of German Engineers (VDI)-guidelines for the measurement of landfill gas. The combination of sampling olfactometric bags and GC-MS analysis was evaluated to quantify the emission concentrations of aromatic VOCs and carbonyl compounds during the combustion of commonly used barbecue charcoal [21] or else to analyze particulate matter and trace metals emitted through charcoal combustion in cooking activities
[22]. This sampling system has been also used in the analysis of VOC emissions from historic plastics and rubbers [23] by placing the objects in olfactometric bags, extracting and analyzing them using SPME-GC-MS. VOCs, and in particular volatile sulfur compounds (VSCs), are often the source of malodorous fumes at waste dumping sites and at biogas-production and sewage treatment plants [24]. These compounds are toxic and may cause health problems, even when present at low concentrations. In order to analyse sulfur compounds in air, also in this case, olfactometric bags and SPME coupled to GC-MS have been used. Furthermore olfactometric bags have been applied for sampling volatile sulphur compounds, relevant to breath analysis
[25], to be subsequently extracted and analysed by SPME-GC-MS. E. M. Gaspar et al. [26], demonstrated the presence in expired breath of potential biomarkers for cancer detection,
27
especially lung cancer, which is a major cause of death among adults and its incidence is increasingly global. The breath from healthy volunteers, smokers and non-smokers, and lung cancer patients without treatment and under radio and/or chemotherapy, was collected using olfactometric bags and then analyzed by SPME followed by GC-MS. The use of breath analysis for monitoring human physiology and exposure to toxic substances or environmental pollutants has been recently reviewed [27]. The SPME-GC-MS combined to sampling in olfactometric bags has been exploited also for the analysis of acetone in breath as a diagnostic tool for diabetes
[28] or the determination of isoprene in expired breath as a marker of body cholesterol synthesis
28
1.1.7 Aim of the work
This research project rises from a collaboration between University of Camerino and Elica company of Fabriano (AN, Italy); the final purpose of this collaboration is to improve or design new aspiration filters for cooker hoods. Cooking processes contribute to emissions of pollutants, in particular in closed areas and poorly ventilated, where air quality is influenced on their presence. These substances, in particular VOCs, present in the environment, are accumulated in the human body and can cause important diseases to humans, as well as generate bad smells in environments such as kitchen. To address this problem and the discomfort due to bad cooking odors, generally aspiration system or filtering system are used, accompanied, when possible, by the prolonged opening of the windows, in order to favor the escape of odors and/or pollutants. This is the central point of this research project, aimed at the planning and production of a new and innovative filtering system that allows to remove selectively or mainly substances having bad odors and/or being toxic. In order to achieve the objective of research work, it is necessary to conduct a qualitative and quantitative study of the main VOCs found in the samples of air emitted during cooking. This is the first step and the principal point of this thesis work, connected to a detailed study of which substances are retained by the aspiration filters of the kitchen hoods, and the study of the air composition before and after the passage from the filter. SPME-GC-MS can be applied for the determination of these substances, if this system is combined with a previous air sampling in olfactometric bags. The bag allows to transport the sample to the instrument location and to perform the SPME extraction of the sampled air. However, despite several applications have been developed in different fields (see the paragraph 1.1.6), this kind of sampling system combined to SPME-GC-MS, has never been exploited to study the emissions of VOCs formed during cooking. Thus, given the importance of monitoring VOCs emissions during cooking activities, the objective of the present study was to assess the applicability of this system in such application. In order to do this, the efficiency of different systems to perform the SPME extraction from the air contained in the bag was assessed by using a standard mixture of alkanes from n-C5 to n-C18 in order to obtain a sufficient sensitivity. Then, the defined system was subsequently used to extract and analyse VOCs in air obtained from deep-fat frying. The evaluation of different SPME extraction times was performed in order to choose the most appropriate timing for our purpose. Then the evaluation of the effect of several types of filters (three different odors filters) on the composition of VOCs produces during frying of potatoes, determining their composition before passing on the hood aspiration filter and after passing on the hood aspiration filter, was performed. Quantitative (relative) and qualitative composition were evaluated for each examined filter. Especially, as regards
29
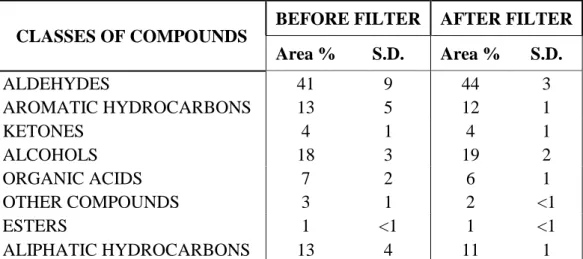
quantitative analysis, the absolute areas obtained before passing filter and the absolute areas obtained after passing filter were compared for each detected analyte; additionally, percentage of dejection, for the analyte passing through the filter, was calculated. However from a qualitative point of view, the percentage areas of each single category of molecules before and after passing through the filter were calculated and compared.
30
1.2 Materials and Methods
1.2.1 Reagents and standards
A standard mixture solution of alkanes (from n-C5 to n-C18) was purchased from Agilent Technologies (Milan, Italy).
1.2.2 Samples and sample preparation
The SPME fiber assembly was purchased from Supelco (Bellefonte, PA, USA) and had a 50/30 µm thickness divinyl-benzene/carboxen/polydimethylsiloxane (DVB/CAR/PDMS) coating with 2 cm length stationary phase. The experiments to evaluate the best SPME extraction conditions were performed by inserting a mixture of alkanes into a 8L, olfactometric PET bag (LOD s.r.l., Udine, Italy) and performing the SPME extraction in two different ways: in the first case the cap of the bag’s side tube (both cap and tube are made up of PET) was substituted with a pirceable septum cap in order to insert the fiber needle and to expose the fiber inside the tube; in the second case the SPME fiber assembly was connected to a modified holder equipped with a holed steel fiber cap which can be used to protect the fiber coating during the extraction from a possible contact with the bag walls (see paragraph 1.3.1). This holder, as well as the protecting fiber cap, are made up of steel and were realized in our institution for this kind of applications. The comparison of the efficiencies of the different procedures was performed by inserting 1 µl of the solution of pure alkanes (from n-C5 to n-C18) inside the bag. Subsequently, a further modification for the extraction phase was made: that is, a vial with a pierceable septum was cut and replaced directly to the side tube of the bag. This change allowed to avoid a large loss of volatile substances following the opening of the bag, and at the same time, allowed the entire exposure of the SPME fiber to the VOCs, while remaining protected inside the bag. Once the best SPME extraction conditions were identified (SPME inserted inside the cut vial), air over a deep fat fries frying was sampled connecting the bag side tube to the hood. First of all, five different bags were transferred to the laboratory where the evaluation of different extraction times was performed. Then, the fiber holder with the fiber exposed inside the holed cap was inserted and samples were analyzed at 1h, 3h, 5h, 7h and at a longer fiber exposure time of 24 hours. Then, the bag was opened, the holed protecting cap quickly removed from the holder and the fiber exposed inside the GC injector for the analysis of extracted VOCs. Once the best SPME extraction time was identified (24 hours), air before passing on the hood aspiration filter and after passing on the hood aspiration filter, was sampled and analyzed. Three different types of
31
filters were tested.For each type of sample (air before filter and air after filter, for each filter) six replicates were analyzed. Moreover, blank analyses were carried out. Olfactometric bags, filled up with nitrogen, were analyzed at room temperature, exposing the fiber for 1h, 3h, 5h, 7h and 24 hours, to monitor the possible release of volatile substances. Anyway, due to the high sensitivity of the SPME fiber a thermal cleaning before its use is necessary to avoid the presence of interferences. Therefore, before the samples analysis, the fiber was inserted into the hot injector of the GC-MS at 260 °C for 15 minutes after which cleaning run is performed. From the chromatogram obtained, it is possible to observe the condition of the fiber. In this way we can evaluate if optimal conditions are reached to proceed with the samples analysis.
32
1.2.3 Hood aspiration filters
Three different types of filters were tested:
1. Activated charcoal AC 90 (Figure 19) filter is an activated charcoal produced by extruding. It is of mineral origin and physically activated.
Figure 19. Activated charcoal AC 90
2. Washable filter 1100-6 1400-11 (Figure 20) is an open cell polyurethane foam, coated with granular activated charcoal and inserted in black polyamide sock (Nylon).
33
3. Helsa-Sorbexx-CS (Figure 21) filter is a composite of activated charcoal reinforced by ceramic.
Figure 21. Helsa-Sorbexx-CS
1.2.4 Headspace-solid phase microextraction and gas chromatography-mass
spectrometry analysis (SPME-GC-MS)
Volatile compounds were analysed by GC-MS using a 6890N Network GC System coupled to a 5973 Network Mass Selective Detector both from Agilent Technologies. For the initial attempt, the chromatographic column was a 5% phenylmethylsiloxane coated capillary column (30 m x 0.25 mm x 0.25 µm film thickness, HP-5MS, Agilent Technologies). The initial carrier gas (helium) flow rate was 1.2 ml min-1. Injector temperature was 260 °C, splitless time was 4 min. Oven temperature was held at 35 °C for 5 min, then raised to 300 °C at 15 °C min-1 and held for 3 min, for a total run time of 25.67 min. Mass analysis was performed in scan mode in the range of 29-400 Da. Transfer line was maintained at 300 °C, ion source at 230 °C and quadrupole at 150 °C. Subsequently, a capillary column coated with polyethylene glycol (60 m x 0.25 mm x 0.25 µm film thickness, DB-WAX, Agilent Technologies) was used. The initial carrier gas (helium) flow rate was 1.2 ml min-1. Injector temperature was 260 °C, splitless time was 4 min. Oven temperature was held at 35 °C for 4 min, then raised to 120 °C at 2.50 °C min-1 and then went up to 250 °C at 15 °C min-1 and held for 3,33 min, for a total run time of 50.00 min. Mass analysis was performed in scan mode in the range of 29-400 Da. Transfer line was maintained at 260 °C, ion source at 230 °C and quadrupole at 150 °C. Thermal desorption of volatiles compounds was carried out by exposing the SPME fiber in the injector for 10 min. Straight chain alkanes from n-C5 to C18 were used to calculate retention indices. Thus, the volatile compounds detected in the air sample, were identified by comparison of their retention indices and their
34
mass spectra with those of standard solution of alkanes, with reference spectra from the US National Institute of Standards and Technology (NIST) and with retention indices from literature (NIST, 2008). A blank test was performed before each analysis to prevent the release of undesirable compounds.
1.2.5 Statistical analysis of data
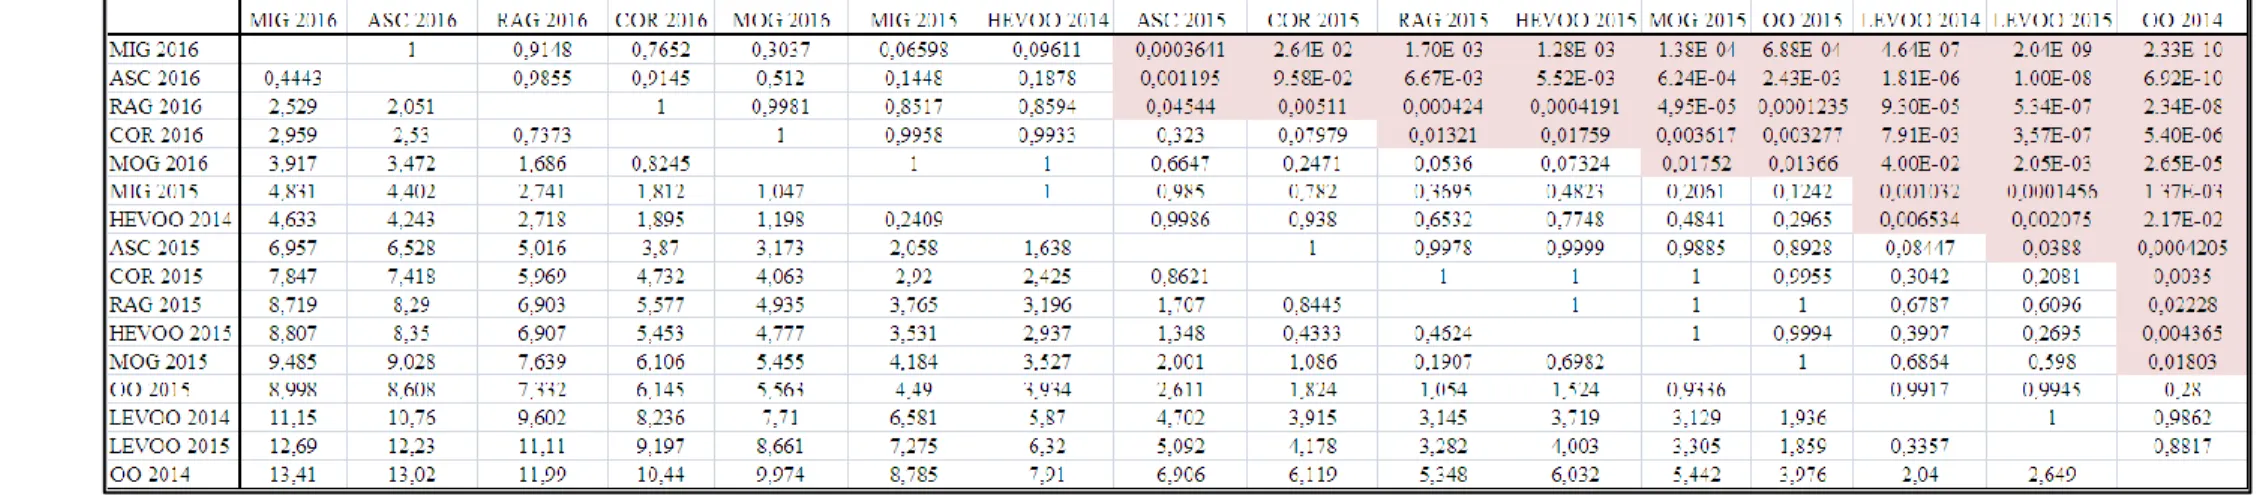
Significant differences among the different model systems were determined for each compound by one-way ANOVA statistical analysis. Differences with P < 0.05 were considered significant. Data elaboration was carried out using PAST software package [30].
35
1.3 Results and Discussion
1.3.1 Evaluation of different SPME extraction methods
The aim of the work was to set up a new system to determine the composition of the main volatile organic compounds (VOCs) which are formed during cooking. The study was specifically aimed at evaluating a suitable method allowing to carry out the GC analysis of VOCs in air samples produced during cooking even far from the analytical instrument location and to achieve a good sensitivity and reproducibility. Thus, it was decided to perform the air sampling in olfactometric bags which can be transported to the laboratory where to perform the extraction by SPME and the subsequent gas chromatographic analysis. In general, these bags can be filled with the air sample under investigation by means of a side tube which can be capped after the sampling. In the present study, the cap of the side tube has been initially substituted with a pierceable septum cap in order to allow the insertion of the SPME needle (Figure 22a). However it was found that the SPME extraction carried out by exposure in the side tube did not give satisfactory results in terms of sensitivity. In fact, air sampled over a hob during fries frying, analysed by SPME-GC-MS inserting the SPME needle in the side tube, did not allow to detect any substance, even extending extraction time to several hours. The problem can be attributed to the poor circulation of the VOCs inside the side tube (having relatively small internal diameter). Thus, it has been decided to the expose the fiber directly inside the bag (Figure 22b).
Figure 22a. System used to perform extraction with SPME fiber exposed in the side tube of the bag
36
Figure 22b. System used to perform extraction with SPME fiber exposed inside the bag
To do this, it has been used a modified SPME holder, realized in our institution, having a holed steel cap (Figure 23) protecting the fiber during the exposure and allowing to place the holder inside different types of container avoiding the risk of damaging the fiber by a possible contact with the container wall.
Figure 23. Protecting holed cap and SPME holder disassembled (a) and assembled (b)
Thus, by using this type of modified SPME holder assembly, the efficiency of the extraction performed from the side tube was compared with that from the extraction carried out inside the bag. A mixture of n-alkanes (from n-C5 to n-C18) was used to assess the different extraction efficiency. In Figure 24a and Figure 24b the chromatograms obtained from the two different extraction methods are reported. The experiments were conducted at a conditioning and extraction temperature of 20°C. The extraction carried out with the SPME inside the bag affords a significantly higher extent of extraction for most of the analytes (Figure 24a, Figure 24b and Figure 25). The differences in the extent of extraction carried out with the fiber exposed inside the bag or inside the side tube are particularly high for the heavier alkanes; from octane upward the differences are always statistically significant (P < 0.05).
37 Time Abunda nc e Time Abunda nc e
Figure 24a. Chromatograms obtained by extracting a mixture of linear alkanes (n-C5-n-C18) with SPME fiber exposed in the bag side tube
Figure 24b. Chromatograms obtained by extracting a mixture of linear alkanes (n-C5-n-C18) with SPME fiber exposed directly inside the bag
2.00 4.00 6.00 8.00 10.00 12.00 14.00 16.00 0 5000000 1e+07 1.5e+07 2e+07 2.5e+07 3e+07 Time--> Abundance TIC: 12111504.D\data.ms 2.00 4.00 6.00 8.00 10.00 12.00 14.00 16.00 0 5000000 1e+07 1.5e+07 2e+07 2.5e+07 3e+07 Time--> Abundance TIC: 11111504.D\data.ms (*) 2.00 4.00 6.00 8.00 10.00 12.00 14.00 16.00 0 5000000 1e+07 1.5e+07 2e+07 2.5e+07 3e+07 Time--> Abundance TIC: 12111504.D\data.ms 2.00 4.00 6.00 8.00 10.00 12.00 14.00 16.00 0 5000000 1e+07 1.5e+07 2e+07 2.5e+07 3e+07 Time--> Abundance TIC: 11111504.D\data.ms (*) n-C10 n-C9 n-C11 n-C12 n-C14 n-C15 n-C16 n-C8 n-C7 n-C5 n-C6 n-C10 n-C9 n-C11 n-C12 n-C14 n-C15 n-C16 n-C8 n-C7 n-C5 n-C6
38
Figure 25. Comparison of the average peak areas (± standard deviation) of alkanes extracted with SPME fiber exposed in the bag side tube or directly inside the bag. Significant differences
(P < 0.05) are indicated by different letters.
After demonstrating the necessity of performing the extraction exposing the fiber inside the bag, the analysis was performed on real samples of air produced frying potatoes in sunflower oil. However, to avoid possible loss of sample, the new system of extraction (Figure 26) has been applied (as discussed in the paragraph 1.2.2).
Figure 26. New system of extraction: SPME fiber inserted inside the cut vial, through a pierceable septum 0,00E+00 2,00E+08 4,00E+08 6,00E+08 8,00E+08 1,00E+09 1,20E+09 1,40E+09 1,60E+09 1,80E+09 2,00E+09 A rea
SPME extraction from side tube SPME extraction inside the bag
0,00E+00 5,00E+06 1,00E+07 1,50E+07 2,00E+07 2,50E+07 3,00E+07 A rea
39 Time
Time
1.3.2 Blank samples analysis
Blank analysis was performed in order to detect and extract possible volatile compounds released by the bag wall. This kind of analysis was performed in the same way as the sample: at room temperature and with a fiber exposure time of 1h, 3h, 5h, 7h and 24 hours. Thus, first of all the olfactometric bag was filled up with nitrogen, then the SPME extraction phase was carried out. The analysis was repeated several times to evaluate the system reproducibility. From the overlapping of the chromatograms obtained by carrying out the extraction at 1h, 3h, 5h, 7h and 24 hours (Figure 27a), it is possible to see that the SPME extraction time increase causes an increase in the quantity of substances detected released by the bag.
Figure 27a. Overlaid blank chromatograms at 1h (in black), 3h (in blue), 5h (in red), 7h (in green) and 24 hours (in yellow)
Furthermore, from the overlapping of the chromatograms, obtained from analyzes carried out at the same SPME extraction time (Figure 27b), it is noted that there is a high reproducibility. The three replicates, carried out under the same conditions (fiber exposure time of 7 hours), give chromatograms with the same profile and with signals roughly of the same intensity.
Figure 27b. Overlaid chromatograms of three blank replicates after 7 hours of SPME extraction
Abunda nc e Abunda nc e
40 Time
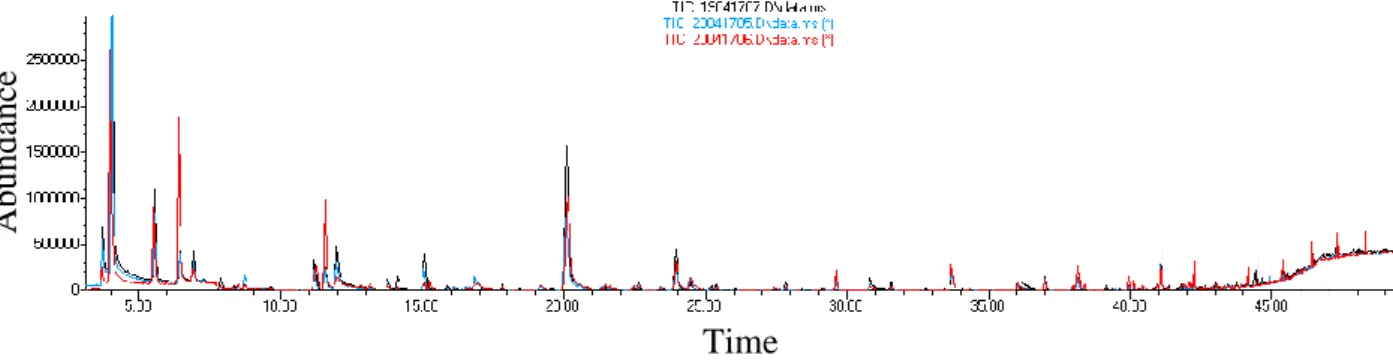
The chromatograms obtained from the blank analyses demonstrated that the substances detected are negligible if compared to the sample analyses (Figure 27c). The detected compounds are siloxanes derivatives, aldehydes, esters (like decanal and decanoic acid 2-ethylhexylester) and volatile compounds with low molecular weight (like ethyl acetate and hexane), that could derive also from an environmental contamination of the laboratory.
Figure 27c. Overlaid sample chromatogram (in black) with blank chromatogram (in blue) both at 24 hours of SPME extraction time
Abunda
nc
41 Ethyl acetate Butanol Toluene Time Time Abunda nc e Abunda nc e
1.3.3 Evaluation of different SPME extraction times
Once decided the most appropriate SPME extraction method, the evaluation of different SPME extraction times was performed. In order to do this, air sampled from fried potatoes in different olfactometric bags, was analyzed. The air sample was analyzed at 1h, 3h, 5h, 7h and at more prolonged SPME exposure time of 24h. In the figures below examples of obtained chromatograms are reported. In particular, the Figure 28a shows the chromatogram obtained from the analysis of air collected while frying fries using an SPME extraction time of 1h; in the Figure 28b the chromatogram obtained with an SPME extraction time of 24 hours is reported. In both cases, carrying out the extraction with SPME fiber exposed inside the bag.
Figure 28a. Chromatogram obtained from the analysis of air collected while frying fries with an SPME extraction time of 1h, carrying out the extraction with SPME fiber exposed inside the bag
Figure 28b. Chromatogram obtained from the analysis of air collected while frying fries with an SPME extraction time of 24h, carrying out the extraction with SPME fiber exposed inside the
bag 2 .0 0 4 .0 0 6 .0 0 8 .0 0 1 0 .0 0 1 2 .0 0 1 4 .0 0 1 6 .0 0 0 5 0 0 0 0 0 1 0 0 0 0 0 0 1 5 0 0 0 0 0 2 0 0 0 0 0 0 2 5 0 0 0 0 0 3 0 0 0 0 0 0 3 5 0 0 0 0 0 4 0 0 0 0 0 0 4 5 0 0 0 0 0 5 0 0 0 0 0 0 T i m e - - > A b u n d a n c e T IC : 1 3 1 1 1 5 0 9 .D \ d a ta .m s 2 .0 0 4 .0 0 6 .0 0 8 .0 0 1 0 .0 0 1 2 .0 0 1 4 .0 0 1 6 .0 0 0 5 0 0 0 0 0 1 0 0 0 0 0 0 1 5 0 0 0 0 0 2 0 0 0 0 0 0 2 5 0 0 0 0 0 3 0 0 0 0 0 0 3 5 0 0 0 0 0 4 0 0 0 0 0 0 4 5 0 0 0 0 0 5 0 0 0 0 0 0 T i m e - - > A b u n d a n c e T IC : 1 6 1 1 1 5 0 1 .D \ d a ta .m s ( * ) 2 .0 0 4 .0 0 6 .0 0 8 .0 0 1 0 .0 0 1 2 .0 0 1 4 .0 0 1 6 .0 0 0 5 0 0 0 0 0 1 0 0 0 0 0 0 1 5 0 0 0 0 0 2 0 0 0 0 0 0 2 5 0 0 0 0 0 3 0 0 0 0 0 0 3 5 0 0 0 0 0 4 0 0 0 0 0 0 4 5 0 0 0 0 0 5 0 0 0 0 0 0 T i m e - - > A b u n d a n c e T IC : 1 3 1 1 1 5 0 9 .D \ d a ta .m s 2 .0 0 4 .0 0 6 .0 0 8 .0 0 1 0 .0 0 1 2 .0 0 1 4 .0 0 1 6 .0 0 0 5 0 0 0 0 0 1 0 0 0 0 0 0 1 5 0 0 0 0 0 2 0 0 0 0 0 0 2 5 0 0 0 0 0 3 0 0 0 0 0 0 3 5 0 0 0 0 0 4 0 0 0 0 0 0 4 5 0 0 0 0 0 5 0 0 0 0 0 0 T i m e - - > A b u n d a n c e T IC : 1 6 1 1 1 5 0 1 .D \ d a ta .m s ( * ) Nonanal Decanal 1,2,3-Trimethyl benzene Hexanal Toluene Butanol Acetic acid Hexanal Octanal
42
Most of the compounds detected could be clearly identified by interpretation of their electron ionization mass spectra and by comparison of their mass spectra with those reported in the NIST library and also by means of their linear retention indices (Table 3). As could be expected, due to the typical autoxidation process of unsaturated fatty acids [31], the main components detected were aldehydes, in particular hexanal, heptanal, octanal, nonanal, decanal and undecanal, typically associated with negative sensorial attributes. Beyond producing off flavors (such as fatty, fishy), these aldehydes are toxic and can be responsible for the development of diseases and pathologies for the human organism [32], thus their monitoring in the kitchen environment and in places often frequented, is especially important to safeguard private and public health. Another category of analytes detected is that of aromatic hydrocarbons. Some of them, such as styrene and p-xylene, are known to be carcinogenic and it is known that they can be found in cooking oil fumes [33] due to an incomplete combustion or pyrolysis of organic substances. Other compounds belonging to the same class, as toluene and propyl benzene [34], have been also detected in the sample. The abundance of each VOC after the cooking process depends on its initial amount in the original oil, on its formation rate throughout the heating time, on the rate at which it escapes into the atmosphere during heating and on the rate of its possible degradation to yield other compounds. The initial VOCs abundances are, in general, small in relation to those generated by the cooking process. Frying temperature and time, frying oil type, antioxidants, and the type of fryer affect the hydrolysis, oxidation, and polymerization of the oil during frying. These are the chemical reactions of frying oil that influence the presence and the abundance of VOCs in the oils [32]-[34]. The flavor of oil formed during deep-fat frying is described as fruity, grassy, buttery, burnt, nutty, and fishy. The oxidation of linolenic acid during deep-fat frying increases fishy odor and decreases fruity and nutty odor. Sensory quality generally decreases with the number of fryings. The optimal concentration of oxygen produces the typical desirable fried flavor. Low amounts of oxygen produce poor and weak flavor, and high levels of oxygen produce off-flavor. Fried flavor compounds in fried foods are mainly VOCs produced from linoleic acid and they are dienal, alkenals, lactones, hydrocarbons and various cyclic compounds. From the literature [32]-[35]-[36], compounds such as acetaldehyde, pentanal, hexanal, 2-heptenal, 2-octenal, 2-nonenal, 2,4-decadienal, pentane and 1-pentanol are emitted after degradation of linoleic acid (C18:2, n-6). In this way, for instance, as reported from Katragadda et al. [35], the emission rates of 2-heptenal and 2-hexanone should be higher in those oils having higher content of linoleic acid: safflower > canola > extra virgin olive > coconut (Figure 29).
43
Figure 29. Emission rates of 2-heptenal and 2-hexanone (mg h-1 loil-1) being released from coconut, safflower, canola and extra virgin olive oils heated at four different temperature (180° -
270°C) [35]
Likewise, the abundances of (E)-2-butenal and (E)-2-pentenal are very closely related to the percentage of linolenic acid (C18:3, n-3) in the total fatty acid composition of the original oils; while the abundance of (E)-2-propenal and (E)-2-hexenal depends on the percentage of linolenic and linoleic groups. Different studies [32]-[35]-[37], have shown that compounds like heptane, heptanol, octane, octanal, nonanal and decanal derive from oleic acid (C18:1, n-9), and more precisely from the homolytic fission of the R-O bond of this fatty acid. Moreover, also 2-nonenal, 2-decenal, 1-undecene and 2-undecenal are closely related to the percentage of oleic acid in the total fatty acid composition in the original oils. For instance, it has been seen [35], that the emission rates of 2-decenal and nonanal should be higher in those oils having higher contents of oleic acid: extra virgin olive ≥ canola > safflower ≥ coconut (Figure 30).
44
Figure 30. Emission rates of 2-decenal and nonanal (mg h-1 loil-1) being released from coconut, safflower, canola and extra virgin olive oils heated at four different temperature (180° - 270°C)
[37]
The analysis was performed also by prolonging to 24 hours the extraction time in order to evaluate if it is possible to detect a higher number of analytes and/or to increase the overall sensitivity of the method. In Figure 28a, Figure 28b and Table 3, it is shown that actually the extent of extraction increases significantly for many compounds.
Peak No. RT (min)a Compounds detectedb LRI (exptl)c LRI (lit)d
SPME extraction time
1h 24h
1 1.913 Hexane Hexane 600 600
2 2.038 - Acetic acid 611 608
3 2.036 Ethyl acetate Ethyl acetate 612 608
4 2.358 2-Methyl-1,3-dioxolane 2-Methyl-1,3-dioxolane 641 -
5 2.511 Butanol Butanol 655 646
6 4.569 Toluene Toluene 758 760
7 5.679 Hexanal Hexanal 799 801
8 6.164 Butyl acetate Butyl acetate 820 815
9 7.030 - 2-Hexenal 857 854 10 7.173 Ethylbenzene Ethylbenzene 863 859 11 7.347 - o-Xylene 871 885 12 7.341 1,3-Dimethyl benzene - 873 869 13 7.471 1-Methoxy-2-propyl benzene - 878 - 14 7.719 - Acetyl cyclohexene 887 - 15 7.777 Styrene Styrene 889 895 16 7.814 p-Xylene p-Xylene 891 876 17 8.000 Heptanal Heptanal 899 902
18 8.081 2-Butoxy ethanol 2-Butoxy ethanol 906 -
19 8.553 α-Pinene - 936 938
20 8.881 Propyl benzene Propyl benzene 954 950
21 8.925 (Z)-2-Heptenal (Z)-2-Heptenal 956 964
22 9.010 1-Ethyl-2-methyl benzene Ethyl-2-methyl benzene 962 985
45
24 9.283 - Ethyl-4-methyl benzene 979 968
25 9.394 - 6-Methyl-5-hepten-2-one 986 987
26 9.388 2-Methyl-5-hepten-2-one - 988 -
27 9.485 1,2,3-Trimethyl benzene 1,2,3-Trimethyl benzene 991 1018
28 9.624 Octanal Octanal 1000 1002
29 9.810 - 2-Ethyl butanal 1015 -
30 9.886 1,2,4-Trimethyl benzene 1,2,4-Trymethyl benzene 1021 -
31 9.915 p-Cymene p-Cymene 1023 1027
32 9.972 D-Limonene D-Limonene 1028 1032
33 10.066 Indane - 1039 1029
34 10.266 Methyl-3-propyl benzene 1-Methyl-3-propyl benzene 1051 1058
35 10.354 - o-Cymene 1058 1050 36 10.467 - (E)-2-hepten-1-ol 1067 - 37 10.588 - 4-Ethyl-1,2-dimethyl benzene 1077 1091 38 10.689 - 1-Ethyl-2,4-dimethyl benzene 1085 1083 39 10.729 - (Z)-Linalool oxide 1088 1088 40 10.921 Nonanal Nonanal 1104 1108 41 11.510 - (E)-2-Nonenal 1158 1158 42 11.693 - (Z)-9-Methyl-3-undecene 1175 - 43 12.032 Decanal Decanal 1207 1207 44 12.561 - (E)-2-Decenal 1263 1263 45 12.615 - Nonanoic acid 1269 1274 46 12.647 - (E)-2-Undecenol 1280 - 47 12.719 - (Z)-9,10-Epoxyoctadecanol 1297 - 48 12.877 - 2,4-Dodecadienal 1297 - 49 12.995 Undecanal Undecanal 1308 1308 50 13.096 - (E,E)-2,4-Decadienal 1320 1319 51 13.518 - 2-Undecenal 1365 - 52 14.309 - (Z)-Geranyl acetone 1456 1455 53 14.358 - 2,6-Dimethyl heptadecane 1462 - 54 14.495 - 2,6-Di-tert-butyl-p-benzoquinone 1478 1472 55 14.608 - α-Isomethyl ionone 1491 1485 56 14.739 - (Z)-8-Hexadecene 1507 - 57 14.986 - Lilial 1538 1532 58 15.305 - 4,5-Dimethyl-2-pentadecyl-1,3-dioxane 1577 - 59 16.966 - 2-Methylpentyl benzoate 1800 -
Table 3. Volatile compounds detected by HS-SPME-GC-MS, their experimental linear retention indices on a 5% phenyl polydimethylsiloxane column and values reported in literature on 5%
phenyl polydimethylsiloxane columns
a RT: retention time
b Compounds reported are those which had peak area values higher than 500.000 c Experimental linear retention index
d Linear retention indices reported in literature (NIST, 2008)
Thus, the extraction time can be modulated depending on the specific analytes under investigation. In the specific case under investigation an extraction time of 1 hour (as of 3h, 5h and 7h) is sufficient to detect the most abundant compounds and the most volatile compounds, while an extraction time of 24 hours allows to quantitate and to detect a much higher number of analytes. It is also noteworthy that the shortest extraction time (1h) allows a higher sensitivity for