U
NIVERSITY OF
U
RBINO
C
ARLO
B
O
Department of Biomolecular Sciences (DISB)
Ph.D. Course in Life Sciences, Health and Biotechnologies
Curriculum: Exercise and Health Science
XXX cycle
Using the HR-V̇O
2
relationship in prescribing aerobic
exercise intensity: examining the true nature of the
association between HR and V̇O
2
during incremental
exercise and its transferability to steady-state exercise
SSD: M-EDF/01
Supervisor
Prof. Ario Federici
Co-advisor
Ph.D. student
Dr. Francesco Lucertini
Dr. Carlo Ferri Marini
Acknowledgements
During these years of scientific and personal development I’ve been constantly followed, helped, and led by several people who deserve to be acknowledged.
Foremost, I wish to express my sincere gratitude to Dr. Francesco Lucertini for the scientific knowledge and method that he’s been teaching since I was one of his undergraduate students. He transmitted to me his passion for research and science, beyond exercise science.
I thank Prof. Ario Federici for his constant and full support. He made me feel part of the team and included me in his research group since day one.
I am grateful to Prof. Marco Rocchi and Dr. Davide Sisti for guidance, advices, and support on most of the statistical procedures employed in the present work.
I also thank Dr. Massimiliano Ditroilo and Prof. Giuseppe De Vito, who allowed me to work with their group on diverse exciting projects.
My sincere thanks also go to Dr. Gerald A. Smith and Dr. Brent Alumbaugh, who offered me an internship opportunity with their group.
I am grateful to the researchers involved in the HERITAGE Family Study, who provided their great expertise and allowed our group to collaborate with them.
A very special thank goes to all the people of the LAMA laboratory of Pavia, namely Dr. Matteo Vandoni and his collaborators Dr. Luca Correale, Dr. Erwan Codrons, and Dr. Stefano Dell'Anna, for their commitment to the joint project that represents the experimental part of this work.
Finally, I want to thank Timothy C. Bloom for the linguistic revision of the four studies included in the present work.
Contents
Preface ... 4 References ... 6 Study 1 ... 9 Introduction ... 9 Methods ... 10 Results ... 18 Discussion ... 20 Conclusions ... 22 References ... 23 Study 2 ... 26 Introduction ... 26 Methods ... 28 Results ... 31 Discussion ... 33 Conclusions ... 34 References ... 35 Study 3 ... 37 Introduction ... 37 Methods ... 39 Results ... 42 Discussion ... 46 Conclusions ... 47 References ... 48 Study 4 ... 51 Introduction ... 51 Methods ... 52 Results ... 57 Discussion ... 59 Conclusions ... 61 References ... 62 Overall conclusions ... 66 Appendix ... 68 List of abbreviations ... 68Preface
Cardiorespiratory fitness is positively associated with health status, and structured individually tailored aerobic exercise training programs are universally recommended to improve cardiorespiratory fitness.[1-4] Structuring an aerobic exercise program involves the manipulation of several parameters[5] related
to both the overall training regimen (e.g., weekly exercise frequency, volume, progression, etc.) and the single exercise session (e.g., duration, intensity, etc.). Intensity is a fundamental consideration when tailoring an aerobic exercise prescription: low intensity is considered safe but may be insufficient to elicit the biological responses necessary to improve cardiorespiratory fitness,[6] whereas vigorous intensity, although effective in
improving cardiorespiratory fitness, may increase the health risks associated with exercise when individuals are not accustomed to it.[5]
Aerobic exercise intensity is usually prescribed and monitored with parameters calculated using either oxygen uptake (V̇O2) or heart rate (HR), both of which increase with increasing aerobic exercise
intensity. Studies investigating the association between V̇O2 and HR have generally found a linear relationship
when values were expressed as percentages of maximal V̇O2 (V̇O2max) and maximal HR (HRmax), respectively. [7-11] However, the relationship between %V̇O
2max and %HRmax may be affected by inter-individual differences
in the maximal[12] and/or resting values. On the contrary, using the 'reserve' values, i.e., the difference
between maximal and resting values, allows the correction for nonzero resting values.
The concept of reserve, which was introduced by Karvonen for HR,[13] was applied to V̇O
2 by Swain
& Leutholtz[12] in light of the previous findings of Davis & Convertino.[14] These investigations, focusing on
young adults, showed that: I) the percentages of the reserve values of V̇O2 (%V̇O2R) and HR (%HRR) did not
differ significantly at four different exercise intensities;[14] II) %V̇O
2R and %HRR were strongly correlated and
their regression was not distinguishable from the line of identity, i.e., slope = 1 and intercept = 0.[12]
Subsequent studies confirmed that %V̇O2R and %HRR regressions did not differ significantly from the line of
identity in healthy subjects,[15, 16] in myocardial infarction,[17] obese,[18] and diabetic[19] patients or in elite
amateur and professional cyclists.[20]
The actual association between %V̇O2R and %HRR, however, has always been questionable. Indeed,
in 1998, Swain et al.[21] found that regression parameters differed significantly from those of the identity line
in healthy adults, and the same discrepancies have since been found in children and adolescents,[22] in
overweight and obese pregnant women,[23] and in obese,[24] CHF,[16, 17] CAD,[17] and heart transplant[25]
patients. Cunha et al.[26] obtained mixed results in healthy adults, and found that the %V̇O
2R-%HRR
relationship was significantly affected by the exercise testing protocol that was used. Importantly, they also found that %HRR was more closely associated with %V̇O2max than it was with %V̇O2R,[26] confirming the results
of a previous study.[22] The conflicting nature of the aforementioned results have often been attributed to
methodological biases, namely the different methods used to assess the resting and maximal values of V̇O2
and HRand the differences among the incremental exercise protocols adopted.[26] Nonetheless, since 1998[27]
the regression between %V̇O2R and %HRR has been widely accepted as non-significantly different from the
line of identity. Indeed, the latest position stand of the American College of Sports Medicine (ACSM)[6] are
also based on the 1:1 relationship between the percentages of the HRR and V̇O2R, and therefore recommend
using the reserve values in prescribing aerobic intensity during steady-state exercise.
To date, the nature of the association between HR and V̇O2 and their true relationship, either during
incremental or steady-state exercise, have yet to be examined properly. Therefore, the overall aim of the present work was to investigate the HR-V̇O2 relationships under different exercise conditions, overcoming
the methodological limitations of the studies reported in the literature. We conducted four separate investigations. In the first two, we focused on incremental exercise, whereas in the following two studies the issue of the transferability of the HRR-V̇O2R relationship from incremental to steady-state exercise was
addressed.
In Studies 1 and 2, the relationship between HR and V̇O2 and the potential influence of an
individual’s particular characteristics on those relationships, were investigated using the large heterogenous dataset provided by the HERITAGE Family Study[28]. The main aims of the first study (STUDY 1) were to identify
the actual relationship between %HRR and %V̇O2R and between %HRR and %V̇O2max and to assess if those
relationships are equal to the identity line (i.e., intercept = 0 and slope = 1). The results of STUDY 1 showed
that both the %HRR-%V̇O2R and %HRR-%V̇O2max relationships (i.e., the individual linear regressions derived
from an incremental exercise test) were different from the identity line (i.e., y = x). Importantly, the intercepts and the slopes of the regressions, for both relationships, presented high standard deviations (SD). This indicates high variability among individuals and can lead to substantial error when the relationship is used to predict HR and/or V̇O2 values for a single subject. We hypothesized that the high variability found in STUDY 1
may be the result of the heterogeneity of the HERITAGE study participants (age, gender, fat mass, cardiorespiratory fitness, etc.). STUDY 2 was therefore designed to assess the potential confounding effect of several characteristics of the HERITAGE study participants on the relationship (i.e., slopes and intercepts) between the percentages of the HRR and V̇O2R. Hence, the aim of STUDY 2 was to use those variables as
predictors to increase the accuracy of the %HRR vs. % V̇O2R relationship.
The final two studies encompassed in this work aimed to assess if the HR-V̇O2 relationships currently
adopted can be used in steady-state exercise conditions. Indeed, the relationships between HR and V̇O2 are
based on studies that used incremental exercise protocols, yet these relationships based on such protocols are commonly used in prescribing the intensity of steady-state aerobic exercise.[5] This is a controversial
as cardiovascular drift and V̇O2 slow component,[29] which can affect the relationships found during
incremental exercise. Therefore, in STUDY 3 the reliability of the 1:1 relationship between %HRR and %V̇O2R
and the transferability of %HRR-%V̇O2R relationship from incremental to steady-state exercise were
investigated using the results of the steady-state tests of the HERITAGE study, which were performed at a fixed power output and a fixed relative exercise intensity. The maximum duration of the steady-state exercises in STUDY 3 was 15 minutes. Since exercise duration and intensity are possible confounding effects of the HR-V̇O2 relationship,[29] STUDY 4 was designed to assess if different intensities and durations of
steady-state aerobic exercise can affect the %HRR-%V̇O2R relationship.
The findings of the present work may be used to either confirm or revise the current physical activity guidelines for prescribing aerobic exercise intensity, which could result in more tailored and therefore effective aerobic exercise training prescriptions.
References
1. Brown WJ, Bauman AE, Bull FC, Burton NW: Development of evidence-based physical activity recommendations for adults (18-64 years). In. Canberra: Australian Government Department of Health; 2012.
2. Haskell WL, Lee IM, Pate RR, Powell KE, Blair SN, Franklin BA, Macera CA, Heath GW, Thompson PD, Bauman A: Physical activity and public health: updated recommendation for adults from the American College of Sports Medicine and the American Heart Association. Medicine and science in
sports and exercise 2007, 39(8):1423-1434.
3. O'Donovan G, Blazevich AJ, Boreham C, Cooper AR, Crank H, Ekelund U, Fox KR, Gately P, Giles-Corti B, Gill JM et al: The ABC of Physical Activity for Health: a consensus statement from the British Association of Sport and Exercise Sciences. Journal of sports sciences 2010, 28(6):573-591.
4. Physical Activity Guidelines Advisory Committee: Physical activity guidelines advisory committee report. In. Washington, DC: U.S. Department of Health and Human Services; 2008.
5. American College of Sports Medicine, Riebe D, Ehrman JK, Liguori G, Magal M: ACSM's guidelines for exercise testing and prescription, Tenth edition. edn. Philadelphia: Wolters Kluwer; 2018.
6. Garber CE, Blissmer B, Deschenes MR, Franklin BA, Lamonte MJ, Lee IM, Nieman DC, Swain DP, American College of Sports M: American College of Sports Medicine position stand. Quantity and quality of exercise for developing and maintaining cardiorespiratory, musculoskeletal, and neuromotor fitness in apparently healthy adults: guidance for prescribing exercise. Medicine and
science in sports and exercise 2011, 43(7):1334-1359.
7. Franklin BA, Hodgson J, Buskirk ER: Relationship between percent maximal O2 uptake and percent maximal heart rate in women. Research quarterly for exercise and sport 1980, 51(4):616-624.
8. Katch V, Weltman A, Sady S, Freedson P: Validity of the relative percent concept for equating training intensity. European journal of applied physiology and occupational physiology 1978, 39(4):219-227.
9. Londeree BR, Ames SA: Trend analysis of the % VO2 max-HR regression. Medicine and science in
sports 1976, 8(2):123-125.
10. Simmons DN, Berry MJ, Hayes SI, Walschlager SA: The relationship between %HRpeak and %VO2peak in patients with chronic obstructive pulmonary disease. Medicine and science in sports
and exercise 2000, 32(5):881-886.
11. Swain DP, Abernathy KS, Smith CS, Lee SJ, Bunn SA: Target heart rates for the development of cardiorespiratory fitness. Medicine and science in sports and exercise 1994, 26(1):112-116.
12. Swain DP, Leutholtz BC: Heart rate reserve is equivalent to %VO2 reserve, not to %VO2max.
Medicine and science in sports and exercise 1997, 29(3):410-414.
13. Karvonen MJ, Kentala E, Mustala O: The effects of training on heart rate; a longitudinal study.
Annales medicinae experimentalis et biologiae Fenniae 1957, 35(3):307-315.
14. Davis JA, Convertino VA: A comparison of heart rate methods for predicting endurance training intensity. Medicine and science in sports 1975, 7(4):295-298.
15. Dalleck LC, Kravitz L: Relationship Between %Heart Rate Reserve And %VO2 Reserve During Elliptical Crosstrainer Exercise. Journal of sports science & medicine 2006, 5(4):662-671.
16. Mezzani A, Corra U, Giordano A, Cafagna M, Adriano EP, Giannuzzi P: Unreliability of the %VO2 reserve versus %heart rate reserve relationship for aerobic effort relative intensity assessment in chronic heart failure patients on or off beta-blocking therapy. European journal of cardiovascular
prevention and rehabilitation : official journal of the European Society of Cardiology, Working Groups on Epidemiology & Prevention and Cardiac Rehabilitation and Exercise Physiology 2007, 14(1):92-98.
17. Brawner CA, Keteyian SJ, Ehrman JK: The relationship of heart rate reserve to VO2 reserve in patients with heart disease. Medicine and science in sports and exercise 2002, 34(3):418-422. 18. Byrne NM, Hills A: Relationships between HR and VO(2) in the obese. Medicine and science in sports
and exercise 2002, 34(9):1419-1427.
19. Colberg SR, Swain DP, Vinik AI: Use of heart rate reserve and rating of perceived exertion to prescribe exercise intensity in diabetic autonomic neuropathy. Diabetes care 2003, 26(4):986-990. 20. Lounana J, Campion F, Noakes TD, Medelli J: Relationship between %HRmax, %HR reserve,
%VO2max, and %VO2 reserve in elite cyclists. Medicine and science in sports and exercise 2007, 39(2):350-357.
21. Swain DP, Leutholtz BC, King ME, Haas LA, Branch JD: Relationship between % heart rate reserve and % VO2 reserve in treadmill exercise. Medicine and science in sports and exercise 1998, 30(2):318-321.
22. Hui SS, Chan JW: The relationship between heart rate reserve and oxygen uptake reserve in children and adolescents. Research quarterly for exercise and sport 2006, 77(1):41-49.
23. Davenport MH, Charlesworth S, Vanderspank D, Sopper MM, Mottola MF: Development and validation of exercise target heart rate zones for overweight and obese pregnant women. Applied
physiology, nutrition, and metabolism = Physiologie appliquee, nutrition et metabolisme 2008,
33(5):984-989.
24. Pinet BM, Prud'homme D, Gallant CA, Boulay P: Exercise intensity prescription in obese individuals.
Obesity 2008, 16(9):2088-2095.
25. Carvalho VO, Bocchi EA, Pascoalino LN, Guimaraes GV: The relationship between heart rate and oxygen consumption in heart transplant recipients during a cardiopulmonary exercise test: heart rate dynamic during exercise test. International journal of cardiology 2010, 145(1):158-160.
26. Cunha FA, Midgley AW, Monteiro WD, Farinatti PT: Influence of cardiopulmonary exercise testing protocol and resting VO(2) assessment on %HR(max), %HRR, %VO(2max) and %VO(2)R relationships. International journal of sports medicine 2010, 31(5):319-326.
27. Pollock ML, Gaesser GA, Butcher JD, Despres J, Dishman RK, Franklin BA, Garber CE: American College of Sports Medicine Position Stand. The recommended quantity and quality of exercise for developing and maintaining cardiorespiratory and muscular fitness, and flexibility in healthy adults. Medicine and science in sports and exercise 1998, 30(6):975-991.
28. Bouchard C, Leon AS, Rao DC, Skinner JS, Wilmore JH, Gagnon J: The HERITAGE family study. Aims, design, and measurement protocol. Medicine and science in sports and exercise 1995, 27(5):721-729.
29. Cunha FA, Midgley AW, Monteiro WD, Campos FK, Farinatti PT: The relationship between oxygen uptake reserve and heart rate reserve is affected by intensity and duration during aerobic exercise at constant work rate. Applied physiology, nutrition, and metabolism = Physiologie appliquee,
nutrition et metabolisme 2011, 36(6):839-847.
30. Wingo JE: Exercise intensity prescription during heat stress: A brief review. Scandinavian journal of
medicine & science in sports 2015, 25 Suppl 1:90-95.
31. Wingo JE, Ganio MS, Cureton KJ: Cardiovascular drift during heat stress: implications for exercise prescription. Exercise and sport sciences reviews 2012, 40(2):88-94.
S
TUDY
1
The percentages of heart rate reserve and oxygen uptake
reserve are not equivalent during incremental exercise and the
percentages of heart rate reserve more closely reflect those of
maximal oxygen uptake rather than oxygen uptake reserve
Introduction
Cardiorespiratory fitness is positively associated with health status, and structured and individually tailored aerobic exercise training programs are universally recommended to improve cardiorespiratory fitness .[1-4] Structuring an aerobic exercise program involves the manipulation of several parameters[5] related to
both the overall training regimen (e.g., weekly exercise frequency, volume, progression, etc.) and the single exercise session (e.g., duration, intensity, etc.). Intensity is a fundamental consideration when tailoring an aerobic exercise prescription: low intensity is considered safe but may be insufficient to elicit the biological responses necessary to improve cardiorespiratory fitness,[6] whereas vigorous intensity, although effective in
improving cardiorespiratory fitness, may increase the health risks associated with exercise when individuals are not accustomed to it.[5]
Aerobic exercise intensity is usually prescribed and monitored with parameters calculated using either oxygen uptake (V̇O2) or heart rate (HR), both of which increase with increasing aerobic exercise intensity.
Studies investigating the association between V̇O2 and HR have generally found a linear relationship when
values were expressed as percentages of maximal V̇O2 (V̇O2max) and maximal HR (HRmax), respectively.[7-11]
However, the relationship between %V̇O2max and %HRmax may be affected by inter-individual differences in
the maximal[12] and/or resting values. On the contrary, using the 'reserve' values, i.e., the difference between
maximal and resting values, allows the correction for nonzero resting values. The concept of reserve, which was introduced by Karvonen for HR,[13] was applied to V̇O
2 by Swain & Leutholtz[12] in light of previous findings
of Davis & Convertino.[14] These investigations, focusing on young adults, showed that: i) the percentages of
the reserve values of V̇O2 (%V̇O2R) and HR (%HRR) did not differ significantly at four different exercise
intensities;[14] ii) %V̇O
the line of identity, i.e., slope = 1 and intercept = 0.[12] Subsequent studies confirmed that %V̇O
2R and %HRR
regressions did not significantly differ from the line of identity in healthy subjects,[15, 16] in myocardial
infarction,[17] obese,[18] and diabetic[19] patients or in elite amateur and professional cyclists.[20]
The actual association between %V̇O2R and %HRR, however, has been questioned in other reports. Swain et
al.[21] in 1998, found that regression parameters differed significantly from those of the identity line in healthy
adults and, subsequently, the same discrepancies have been found in children and adolescents,[22] in
overweight and obese pregnant women,[23] and in obese,[24] CHF,[16, 17]CAD,[17] and heart transplant
recipient[25] patients. Cunha et al.[26] obtained mixed results in healthy adults, and found that the %V̇O 2
R-%HRR relationship was significantly affected by the exercise testing protocol used. Importantly, they also found that %HRR was more closely associated with %V̇O2max than it was with %V̇O2R,[26] confirming the results
of a previous study.[22]
Nonetheless, since 1998[27] the regression between %V̇O
2R and %HRR has been widely accepted as
non-significantly different from the line of identity, as reported in the latest position stand by the ACSM.[5]
Therefore, the main aim of the present study was to assess the actual relationships between %HRR and %V̇O2R and between %HRR and %V̇O2max using the large dataset of the HERITAGE Family Study.[28]
Methods
Sample
The sample of the present investigation was composed of 741 members of Caucasian and African American families participating in the pre-training assessments of the HERITAGE Study (see Bouchard et al.[28] for details
regarding ethical approval, inclusion and exclusion criteria, and study design).
All the subjects enrolled in the HERITAGE study, ranging in age from 17 to 65, were healthy, i.e., with no significant medical conditions or diseases. They were sedentary, i.e., they had not engaged in regular physical activity in the previous 6 months, and were not taking any medications that could affect resting and/or exercise HR.
HERITAGE study assessments
The design of the HERITAGE study included several exercise and non-exercise tests performed before and after an aerobic exercise training intervention. In the present study, only baseline (body weight and pre-exercise HR) and pre-exercise testing (V̇O2max tests) data of selected pre-training assessments were used (see
below).
Body weight and pre-exercise heart rate
Body mass was measured to the nearest 0.1 kg using a balance beam scale. Resting HR (HRrest) was measured
both immediately before the exercise test and at the end of a 5-min rest period with the subject sitting quietly in a chair.
Maximal oxygen uptake
Participants’ V̇O2max was defined based on the results of two cardiorespiratory fitness tests. First, a
continuous, incremental exercise test to exhaustion (T1) was performed on a cycle ergometer (model 800S – Sensor Medics, Yorba Linda, CA, USA) connected to a mixing-chamber metabolic cart (model 2900 – Sensor Medics, Yorba Linda, CA, USA). In the first 3-min stage, participants pedalled at 50 W, then the resistance of the ergometer was increased by 25 W every 2 minutes until volitional exhaustion (in older, smaller, or less fit subjects, starting the test with a lower power output and/or making smaller increases every 2 minutes was permitted). At least 48 hours later, a submaximal, steady-state exercise test, followed by a progressive test to maximum (T2) was performed. After the first phase of the test (which is not relevant to the present investigation but involved having the subjects exercise at a steady-state intensity of about 60% of the V̇O2max
measured in T1), participants peddled for 3 minutes at the power output corresponding to 80% of the V̇O2max
measured in T1. Thereafter, a 2-min stage at the highest power output attained in T1 was performed, and the resistance was then increased, if necessary, by the same increment used in T1, every 2 minutes until volitional exhaustion. Since the cycle ergometer was able to keep the PO constant regardless of the pedalling frequency, each participant was allowed to choose his/her own "comfortable" cadence (usually around 60 rpm), which was noted and used in both T1 and T2.
In both tests, V̇O2 (along with other gas exchange variables that were not used in the present investigation)
was determined every 20 seconds and retained for subsequent analysis as the average of the last three 20-s values of each stage, whereas HR was measured continuously by means of ECG (in order to confirm HR, ECG rhythm strips were taken within the last 15 seconds of each stage and at maximum).
The criteria used for the attainment of V̇O2max were: a plateau in V̇O2 (a change <100 mL∙min-1 in the last three
consecutive 20-s intervals); a HR within 10 bpm of the age-predicted HRmax; a respiratory exchange ratio >1.1.
more.[30] Hence, when the V̇O
2 peak of only one test met at least one criterion, it was assumed to be the
V̇O2max. When both T1 and T2 V̇O2 peaks met the criteria and the values were within 5% of each other, their
average was calculated and assumed to be the V̇O2max; otherwise, the highest value was assumed to be the
V̇O2max[29] HRmax was assumed to be the highest value attained during either of the two maximal exercise tests.
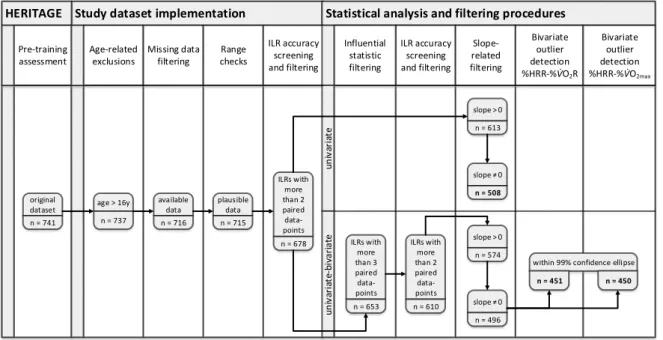
Study dataset implementation
Before performing the calculations necessary to implement the dataset used in the present study, the HERITAGE study data were screened and filtered.
HERITAGE study dataset screening and filtering
Since only a few subjects were under the age of 17, only the records of the participants who were 17 or older were retained. Moreover, participants whose records had missing data in the V̇O2max (and/or body weight),
HRrest, or HRmax fields were excluded. Subsequently, each stage of the T1 was inspected and deleted if either
the V̇O2 or the HR fields were missing. Finally, the data integrity of all the above-mentioned variables was
assessed by means of range checks: when implausible physiological data were found, the whole participant record and/or the relevant stage/s of the T1 were excluded (see Figure 1 for details).
Figure 1. Flowchart illustrating the number of subjects (n) retained after each step of the screening and filtering procedures applied to the original HERITAGE Family Study dataset. ILR, individual linear regression.
Study dataset implementation
HERITAGE Statistical analysis and filtering procedures
Age-related exclusions Missing data filtering Range checks ILR accuracy screening and filtering ILR accuracy screening and filtering Influential statistic filtering Slope-related filtering Bivariate outlier detection %HRR-%V̇O2R Pre-training assessment Bivariate outlier detection %HRR-%V̇O2max u n iv ar ia te u n iv ar ia te -b iv ar ia te slope>0 n = 613 slope 0 n = 508 slope>0 n = 574 slope 0 n = 496 original dataset n = 741 available data n = 716 age > 16y n = 737 plausible data n = 715 ILRs with more than 2 paired data-points n = 678 ILRs with more than 3 paired data-points n = 653 ILRs with more than 2 paired data-points n = 610
within 99% confidence ellipse
Data preparation and processing
Each V̇O2 and HR recorded for each stage of the T1 was computed as a percentage of both the reserve and
maximal values using, respectively, the following two formulae: i) 100 x (recorded value – resting value) / (maximal value – resting value); ii) 100 x recorded value / maximal value. In the calculation of %V̇O2R, the
V̇O2max was retrieved from the HERITAGE study dataset, whereas the resting V̇O2 was assumed to be 3.5
mL∙min-1∙kg-1, as suggested by the current ACSM guidelines[5] (all values had been previously expressed in
relation to body weight). As regards %HRR, both HRrest and HRmax were retrieved from the HERITAGE study
dataset.
Once calculated, %V̇O2R, %V̇O2max, and %HRR paired data points were used to perform the individual linear
regressions for the %HRR-%V̇O2R and the %HRR-%V̇O2max relationships. As suggested by Swain et al.,[11, 12] a
regression was performed for each participant and the %HRR was set as the dependent variable. Data from individual linear regressions resulting from less than 3 paired data points were excluded because they were assumed to be potentially not accurate in representing the true underlying relationship.
Statistical analysis
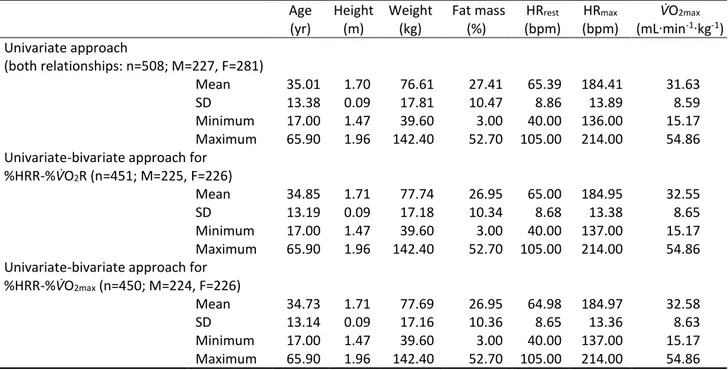
The analyses were performed using Excel (Microsoft Office, v.2016), SPSS Statistics (IBM, v.20), and R (R Core Team, v.3.2.3 – "Robust" package, v.0.4/16) software, with a α level of statistical significance of 0.05. The study dataset was filtered and analyzed twice using a univariate and a univariate-bivariate blended approach. In both approaches data were adjusted for the familial clusters of the original HERITAGE study dataset (see the specific paragraph below for details). A flowchart illustrating the number of cases resulting from the analyses is presented in Figure 1. See Table 1 for details of the characteristics of the participants.
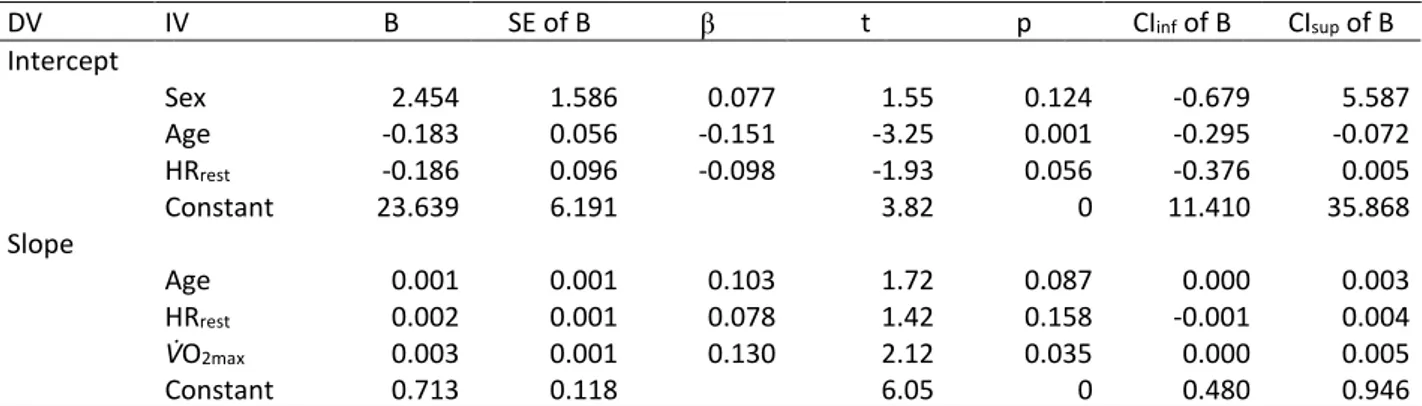
Table 1. Baseline characteristics of the subjects retained after applying the screening and filtering procedures to the original dataset of the HERITAGE Family Study.
Age (yr) Height (m) Weight (kg) Fat mass (%) HRrest (bpm) HRmax (bpm) V̇O2max (mL∙min-1∙kg-1) Univariate approach (both relationships: n=508; M=227, F=281) Mean 35.01 1.70 76.61 27.41 65.39 184.41 31.63 SD 13.38 0.09 17.81 10.47 8.86 13.89 8.59 Minimum 17.00 1.47 39.60 3.00 40.00 136.00 15.17 Maximum 65.90 1.96 142.40 52.70 105.00 214.00 54.86
Univariate-bivariate approach for
%HRR-%V̇O2R (n=451; M=225, F=226)
Mean 34.85 1.71 77.74 26.95 65.00 184.95 32.55
SD 13.19 0.09 17.18 10.34 8.68 13.38 8.65
Minimum 17.00 1.47 39.60 3.00 40.00 137.00 15.17
Maximum 65.90 1.96 142.40 52.70 105.00 214.00 54.86
Univariate-bivariate approach for
%HRR-%V̇O2max (n=450; M=224, F=226)
Mean 34.73 1.71 77.69 26.95 64.98 184.97 32.58
SD 13.14 0.09 17.16 10.36 8.65 13.36 8.63
Minimum 17.00 1.47 39.60 3.00 40.00 137.00 15.17
Maximum 65.90 1.96 142.40 52.70 105.00 214.00 54.86
HRrest, resting heart rate; HRmax, maximal heart rate; V̇O2max, maximal oxygen uptake; HRR, heart rate reserve; n,
number of subjects; M, number of male subjects; F, number of female subjects; SD, standard deviation.
Univariate approach
Data filtering
After excluding the linear regressions whose slopes were lower than zero, the slope of each linear regression was compared to zero using a 2-tailed regression slope t test. The regressions whose slopes were not significantly different from zero were excluded.
Statistics
For each relationship, the mean slope and intercept were compared to the line of identity (i.e., to 1 and 0, respectively) using two 2-tailed 1-sample t tests with degrees of freedom corrected for familial clusters (see specific paragraph below).
Univariate-bivariate approach
Data filtering
For each relationship, paired data-points were filtered using the DFFITS influential statistics and those having an absolute value of DFFITS larger than the size adjusted cut-off (i.e., double the square root of the ratio
between the number of the regression’s parameters and the number of paired data points, as proposed by Belsley et al.[31]) were excluded. Since the DFFITS procedure requires at least four values to be performed, all
the regressions resulting from less than four paired data points were also excluded. Subsequently, the individual linear regressions were run using the remaining paired data points, and those resulting from less than three paired data points and those with a slope both lower than zero and not significantly different from zero (2-tailed regression slope t test) were excluded as well (see Figure 1).
Robust means and the variance-covariance matrix were then calculated using the Huber M-estimator.[32]
Thereafter, a bivariate paired data point filtering procedure was performed by adapting the ISO 13528:2015 rule.[33] Briefly, the 99% confidence ellipse was created using the robust means and the variance-covariance
matrix and all paired data laying outside the ellipse were assumed to be bivariate outliers, hence excluded (Figure 2).
A. %HRR-%V̇O2R
B. %HRR-%V̇O2max
Figure 2. Bivariate 99% confidence ellipses calculated for the %HRR-%V̇O2R
(panel A) and the %HRR-%V̇O2max (panel B) relationships. %HRR, percentage
of heart rate reserve; %V̇O2R, percentage of oxygen uptake reserve; %V̇O2max,
percentage of maximal oxygen uptake.
Statistics
A test for Pearson’s r significance was performed to evaluate the correlation between intercepts and slopes of both the %HRR-%V̇O2R and the %HRR-%V̇O2max relationships.
The slopes and intercepts were used to build a mean vector (𝑎𝑏) that was compared to the expected vector (01) using the bivariate Mahalanobis distance and the Wishart distribution. Post-hoc univariate analyses were then performed using two 2-tailed 1-sample t tests to compare the average slopes and intercepts to 1 and 0, respectively. The degrees of freedom used for Mahalanobis distance and post-hoc tests were those obtained from familial cluster adjustment calculations (see below).
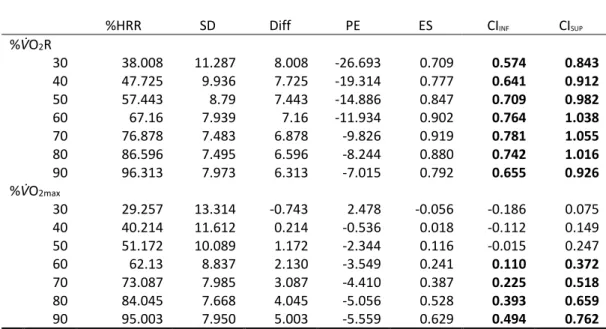
The equations of the individual linear regressions retained were also used to calculate, for each subject, the predicted %HRRs over the V̇O2R and V̇O2max continua (0% to 100%). The mean %HRRs predicted at 30%, 40%,
50%, 60%, 70%, 80%, and 90% of V̇O2R and V̇O2max were then reported in Table 3 along with the relevant
descriptive statistics and the 95% confidence intervals (CI) of the effect size (ES).
Finally, for each relationship the average root mean square error (RMSE) was calculated as follows. For each participant, the difference between the actual %HRR and the %V̇O2R or %V̇O2max of each stage of the T1 was
calculated. The sum of the squared differences was then divided by the number of stages completed before calculating the square root of each relationship and their averages. The RMSEs of the two relationships were compared using a two-tailed, paired sample t-test (in order to be as conservative as possible, the number of families was assumed to be the sample size; degrees of freedom: 155).
Familial cluster adjustments
In order to take into account the heritage effect on each regression variable (see Table 2), the following procedure was performed: i) the eta squared (η2) for univariate ANOVA with random effect (family
membership) was calculated (the dependent variables were either slope or intercept); ii) the η2 was
computed in the equation of Shieh[34] and an intraclass correlation coefficient (ICC) was obtained; iii) the
variance inflation factor (VIF) was calculated using the ICC and the mean size of the grouped data; iv) the VIF was used to calculate the corrected sample size (ncorr) for clustered data,[35] which was used for both analyses
Results
The results are presented separately for each approach used.
Univariate approach
The intercepts of both %HRR-%V̇O2R and %HRR-V̇O2max regressions were significantly different from 0,
whereas only the slope of the %HRR-%V̇O2max regression was significantly different form 1 (see Table 2 for
details).
Table 2. Average values, familial cluster adjustments, and statistics for the univariate and the blended univariate-bivariate approaches.
Univariate approach Univariate-bivariate approach
%HRR-%V̇O2R %HRR-%V̇O2max %HRR-V̇O2R %HRR-V̇O2max
Slope Intercept Slope Intercept Slope Intercept Slope Intercept
Mean 0.979 7.578 1.112 -5.706 0.972 8.855 1.096 -3.616 SD 0.214 16.509 0.243 19.547 0.189 16.022 0.216 18.993 CV 0.219 2.179 0.219 3.426 0.195 1.809 0.197 5.252 ICC 0.431 0.411 0.476 0.445 0.418 0.501 0.414 0.440 VIF 1.821 1.782 1.906 1.847 1.762 1.914 1.756 1.803 ncorr 279.091 285.051 266.551 275.065 255.329 235.131 256.310 249.594 t 1.662 6.728 7.483 4.841 2.377 8.475 7.085 3.008 p(t) 0.098 ns < 0.001 # < 0.001 * 0.000 # 0.018 * < 0.000 # < 0.000 * 0.003 #
%HRR, percentage of heart rate reserve; %V̇O2R, percentage of oxygen uptake reserve; %V̇O2max,
percentage of maximal oxygen uptake; SD, standard deviation; CV, coefficient of variation; ICC,
intraclass correlation coefficient; VIF, variance inflation factor; ncorr, corrected number of subjects; t,
t-value; p(t), level of significance; ns, non-significantly different from 1; #, significantly different from 0;
*, significantly different from 1.
Univariate-bivariate approach
The t-test for the correlation index between the slopes and the intercepts revealed a significant correlation for both the %HRR-%V̇O2R (r=-0.72; p<0.0001) and the %HRR-%V̇O2max (r=-0.79; p<0.0001) relationships.
The Mahalanobis distance showed a highly significant difference (p<0.0001) between the mean vector (𝑎𝑏) and the expected vector (01) for both the %HRR-%V̇O2R (χ2(2)=186; p<0.0001) and the %HRR-%V̇O2max (χ2(2)=98;
p<0.0001) relationships. Post-hoc univariate t tests (see Table 2) revealed that, in both relationships, the
slopes and the intercepts were significantly different from 1 and 0, respectively (see Figure 3 for a graphical representation of both regressions over the expected identity line).
Figure 3. The regression lines of the %HRR-%V̇O2R and %HRR-%V̇O2max
relationships are plotted over the expected identity line (y = x). HRR,
heart rate reserve; V̇O2max, maximal oxygen uptake; V̇O2R, oxygen
uptake reserve.
The predicted %HRRs were significantly different from the identity line (i.e., the expected zero ES did not lie within the 95% CIs of the ES) for all the percentages calculated for the %HRR-V̇O2R relationship, whereas for
the %HRR-V̇O2max relationship, they differed significantly from the identity line above 50% of the V̇O2max (Table
3). 20 30 40 50 60 70 80 90 100 20 30 40 50 60 70 80 90 100 H R R ( % ) % VO2max (y = 1.0958x - 3.6165) VO2R (y = 0.9718x + 8.8553) Identity line (y = x) V̇O2max (y = 1.096x – 3.616) Identity line (y = x) V̇O2R (y = 0.972x + 8.855)
Table 3. %HRRs calculated averaging the predicted %HRR resulting from each individual linear
regression, and relevant descriptive statistics, at different %V̇O2R and %V̇O2max.
%HRR SD Diff PE ES CIINF CISUP
%V̇O2R 30 38.008 11.287 8.008 -26.693 0.709 0.574 0.843 40 47.725 9.936 7.725 -19.314 0.777 0.641 0.912 50 57.443 8.79 7.443 -14.886 0.847 0.709 0.982 60 67.16 7.939 7.16 -11.934 0.902 0.764 1.038 70 76.878 7.483 6.878 -9.826 0.919 0.781 1.055 80 86.596 7.495 6.596 -8.244 0.880 0.742 1.016 90 96.313 7.973 6.313 -7.015 0.792 0.655 0.926 %V̇O2max 30 29.257 13.314 -0.743 2.478 -0.056 -0.186 0.075 40 40.214 11.612 0.214 -0.536 0.018 -0.112 0.149 50 51.172 10.089 1.172 -2.344 0.116 -0.015 0.247 60 62.13 8.837 2.130 -3.549 0.241 0.110 0.372 70 73.087 7.985 3.087 -4.410 0.387 0.225 0.518 80 84.045 7.668 4.045 -5.056 0.528 0.393 0.659 90 95.003 7.950 5.003 -5.559 0.629 0.494 0.762
%HRR, percentage of heart rate reserve (average of the predicted); %V̇O2R, percentage of oxygen
uptake reserve; %V̇O2max, percentage of maximal oxygen uptake; SD, standard deviation; Diff,
difference between the predicted and the expected percentage; PE, percentage error (of the Diff);
ES, effect size; CI, inferior (INF) and superior (SUP) 95% confidence intervals of the ES (bold when
the zero expected ES does not lay within the interval).
The average RMSE of the %HRR-%V̇O2max relationship (7.78%±4.49%) was significantly lower (t=5.172;
p<0.001) than that of the %HRR-%V̇O2R relationship (9.25%±5.54%).
Discussion
The main finding of the present study is that the regression between %HRR and %V̇O2R does differ from the
identity line, which conflicts with the current guidelines on aerobic exercise intensity prescription.
We used two different approaches to analyze the relationships, and both provided results oriented in the same direction.
When straight t tests were performed on the data retained for the univariate approach, only the slope of the %HRR-%V̇O2R relationship was non-significantly different from the expected (having a negligible effect size),
whereas all the other comparisons showed significant differences (with small ES).
This widely used approach[12, 15-18, 20-24] was mainly adopted to assess the reproducibility of the results in the
literature using a larger and more heterogeneous dataset, whose data quality has already been proven. Indeed, quality assurance and control procedures were implemented within the HERITAGE study showing an overall high quality of the measurements.[36] In particular, the procedures showed good reproducibility of
V̇O2max and HRmax measurements,[37] as well as high reliability of resting HR measurements[38] and
anthropometrics and body composition parameters,[39] all of which are relevant to the present study.
Conflicting results in the literature may stem from methodological limitations. Firstly, several investigators[16, 25] set the %HRR as the independent rather than the dependent variable of the individual linear regressions
as suggested by Swain & Leutholtz.[12] Secondly, in some of the investigations, the linear regressions were
performed also including the resting values of the percentages of the reserve,[12, 15, 16, 20-23] which, along with
the maximal values, could induce the slope and intercept to tend to 1 and 0, respectively. Thirdly, in several studies[15-18, 21, 22, 24] the resting HR was not properly measured (i.e., as recommended by the ACSM[40]), which
could affect the extent of the reserve.
As suggested by Swain et al.,[11] a regression was performed for each participant and the %HRR was set as
the dependent variable in order to accurately reflect the variability within the data and not to obscure the individual relationships. This approach is theoretically correct from both the physiological standpoint (HR does not elicit whole body V̇O2, while V̇O2 is clearly the main factor determining the demand for HR) and
statistical standpoint (the transposition of a linear regression equation does not yield the same values as those that would be obtained if the regression had initially been performed with the dependent and independent variables reversed).
Resting HR was measured immediately before the exercise test and at the end of a 5-min rest period with the subject sitting quietly in a chair. This procedure is in line with current ASCM recommendations[40], which
recommends that resting HR should be measured after at least 5-min of quiet rest, preferably with the subject in a similar position as in the prescribed exercise mode.[40]
We surmised that more stringent data filtering procedures were necessary. Hence, the study dataset was re-analyzed to avoid any potential confounding effects that may have been caused by outliers in the UNIVARIATE approach. Two additional data filtering procedures were applied, deleting both influential paired data points (DFFIT) of the individual linear regressions and the individuals whose outcomes/dependent variables (i.e., the slopes and intercepts deriving from the individual linear regressions) were outliers.
Since the dependent variables showed significant correlations for both the %HRR-%V̇O2R (r=-0.72; p<0.0001)
and the %HRR-%V̇O2max (r=-0.79; p<0.0001) relationships, a bivariate filter was applied (Figure 2) and the
slope and intercept were analyzed using a multivariate inferential statistic. Both %HRR-%V̇O2R and
%HRR-%V̇O2max relationships were found to be significantly different from the identity line, with χ2 of the
Mahalanobis distances vs. the identity line of 186 and 98, respectively.
The post hoc tests showed that both the %HRR-%V̇O2R and %HRR-%V̇O2max relationships were significantly
different from the identity line, with all the slopes and intercepts significantly different from 1 and 0, respectively. Regarding the ES of the %HRR-%V̇O2R and %HRR-%V̇O2max relationships vs. the identity line, the
slope showed a negligible (-0.15) and small (0.44) ES (in line with the univariate approach), whereas the ES of the intercepts differed from the univariate approach, showing a medium (0.55) and negligible (-0.19) ES, respectively.
When the %HRRs were predicted at different exercise intensities from the individual linear regressions, the predicted %HRRs were always different from the expected values of the identity line in the %HRR-%V̇O2R
relationship, whereas they only differed above 50% in the %HRR-%V̇O2max relationship (see Table 3).
Moreover, the difference between the predicted and expected percentages, their percentage error, and ES seem to be higher in the %HRR-%V̇O2R than in the %HRR-%V̇O2max relationship (see Table 3).
Likewise, the RMSEs were also higher (t=8.875; p<0.001) for the %HRR-%V̇O2Rrelationship (9.25%±5.54%)
than they were for the %HRR-%V̇O2max relationship (7.78%±4.49%), with a mean difference of 1.47%±3.55%
and an ES of 0.41.
A limitation of the present study is that resting V̇O2 was not measured but assumed to be 3.5 mL∙min-1∙kg-1.
However, this value is adopted by the current guidelines as well.
Conclusions
Both relationships are slightly (in terms of mean difference and ES) but significantly different from the identity line. Although the difference is small, the intercepts and slopes are highly variable with a high SD. The same is true for the average RMSE and the predicted HRR at different intensities.
Therefore, even though the intercept and slopes are close – on average – to the identity line, using a single equation to predict the individual equation can cause an important and substantial error when applied to a single individual.
In the present study we chose not to create subject subgroups (age, gender, race, etc.) because the current guidelines adopt a 1:1 relationship between %HRR-%V̇O2R for all subjects. Therefore, future studies assessing
the influence of different variables (age, body composition, V̇O2max, gender, HRrest) on the relationship are
necessary. In addition, both the type of ergometer used and the incremental protocol adopted should be taken into account as influential variables. Future studies that take all these variables into consideration may help to explain the high variability of intercepts and slopes among different individuals.
Finally, it would also be useful to consider the possibility that the relationship between %HRR and %V̇O2R
might be not perfectly linear, either as a whole or within a specific range of intensity of the incremental exercise test.
References
1. Brown WJ, Bauman AE, Bull FC, Burton NW: Development of evidence-based physical activity recommendations for adults (18-64 years). In. Canberra: Australian Government Department of Health; 2012.
2. Haskell WL, Lee IM, Pate RR, Powell KE, Blair SN, Franklin BA, Macera CA, Heath GW, Thompson PD, Bauman A: Physical activity and public health: updated recommendation for adults from the American College of Sports Medicine and the American Heart Association. Medicine and science in
sports and exercise 2007, 39(8):1423-1434.
3. O'Donovan G, Blazevich AJ, Boreham C, Cooper AR, Crank H, Ekelund U, Fox KR, Gately P, Giles-Corti B, Gill JM et al: The ABC of Physical Activity for Health: a consensus statement from the British Association of Sport and Exercise Sciences. Journal of sports sciences 2010, 28(6):573-591.
4. Physical Activity Guidelines Advisory Committee: Physical activity guidelines advisory committee report. In. Washington, DC: U.S. Department of Health and Human Services; 2008.
5. American College of Sports Medicine, Riebe D, Ehrman JK, Liguori G, Magal M: ACSM's guidelines for exercise testing and prescription, Tenth edition. edn. Philadelphia: Wolters Kluwer; 2018.
6. Garber CE, Blissmer B, Deschenes MR, Franklin BA, Lamonte MJ, Lee IM, Nieman DC, Swain DP, American College of Sports M: American College of Sports Medicine position stand. Quantity and quality of exercise for developing and maintaining cardiorespiratory, musculoskeletal, and neuromotor fitness in apparently healthy adults: guidance for prescribing exercise. Medicine and
science in sports and exercise 2011, 43(7):1334-1359.
7. Franklin BA, Hodgson J, Buskirk ER: Relationship between percent maximal O2 uptake and percent maximal heart rate in women. Research quarterly for exercise and sport 1980, 51(4):616-624. 8. Katch V, Weltman A, Sady S, Freedson P: Validity of the relative percent concept for equating
training intensity. European journal of applied physiology and occupational physiology 1978, 39(4):219-227.
9. Londeree BR, Ames SA: Trend analysis of the % VO2 max-HR regression. Medicine and science in
sports 1976, 8(2):123-125.
10. Simmons DN, Berry MJ, Hayes SI, Walschlager SA: The relationship between %HRpeak and %VO2peak in patients with chronic obstructive pulmonary disease. Medicine and science in sports
and exercise 2000, 32(5):881-886.
11. Swain DP, Abernathy KS, Smith CS, Lee SJ, Bunn SA: Target heart rates for the development of cardiorespiratory fitness. Medicine and science in sports and exercise 1994, 26(1):112-116.
12. Swain DP, Leutholtz BC: Heart rate reserve is equivalent to %VO2 reserve, not to %VO2max.
Medicine and science in sports and exercise 1997, 29(3):410-414.
13. Karvonen MJ, Kentala E, Mustala O: The effects of training on heart rate; a longitudinal study.
Annales medicinae experimentalis et biologiae Fenniae 1957, 35(3):307-315.
14. Davis JA, Convertino VA: A comparison of heart rate methods for predicting endurance training intensity. Medicine and science in sports 1975, 7(4):295-298.
15. Dalleck LC, Kravitz L: Relationship Between %Heart Rate Reserve And %VO2 Reserve During Elliptical Crosstrainer Exercise. Journal of sports science & medicine 2006, 5(4):662-671.
16. Mezzani A, Corra U, Giordano A, Cafagna M, Adriano EP, Giannuzzi P: Unreliability of the %VO2 reserve versus %heart rate reserve relationship for aerobic effort relative intensity assessment in chronic heart failure patients on or off beta-blocking therapy. European journal of cardiovascular
prevention and rehabilitation : official journal of the European Society of Cardiology, Working Groups on Epidemiology & Prevention and Cardiac Rehabilitation and Exercise Physiology 2007, 14(1):92-98.
17. Brawner CA, Keteyian SJ, Ehrman JK: The relationship of heart rate reserve to VO2 reserve in patients with heart disease. Medicine and science in sports and exercise 2002, 34(3):418-422. 18. Byrne NM, Hills A: Relationships between HR and VO(2) in the obese. Medicine and science in sports
and exercise 2002, 34(9):1419-1427.
19. Colberg SR, Swain DP, Vinik AI: Use of heart rate reserve and rating of perceived exertion to prescribe exercise intensity in diabetic autonomic neuropathy. Diabetes care 2003, 26(4):986-990. 20. Lounana J, Campion F, Noakes TD, Medelli J: Relationship between %HRmax, %HR reserve,
%VO2max, and %VO2 reserve in elite cyclists. Medicine and science in sports and exercise 2007, 39(2):350-357.
21. Swain DP, Leutholtz BC, King ME, Haas LA, Branch JD: Relationship between % heart rate reserve and % VO2 reserve in treadmill exercise. Medicine and science in sports and exercise 1998, 30(2):318-321.
22. Hui SS, Chan JW: The relationship between heart rate reserve and oxygen uptake reserve in children and adolescents. Research quarterly for exercise and sport 2006, 77(1):41-49.
23. Davenport MH, Charlesworth S, Vanderspank D, Sopper MM, Mottola MF: Development and validation of exercise target heart rate zones for overweight and obese pregnant women. Applied
physiology, nutrition, and metabolism = Physiologie appliquee, nutrition et metabolisme 2008,
33(5):984-989.
24. Pinet BM, Prud'homme D, Gallant CA, Boulay P: Exercise intensity prescription in obese individuals.
Obesity 2008, 16(9):2088-2095.
25. Carvalho VO, Bocchi EA, Pascoalino LN, Guimaraes GV: The relationship between heart rate and oxygen consumption in heart transplant recipients during a cardiopulmonary exercise test: heart rate dynamic during exercise test. International journal of cardiology 2010, 145(1):158-160.
26. Cunha FA, Midgley AW, Monteiro WD, Farinatti PT: Influence of cardiopulmonary exercise testing protocol and resting VO(2) assessment on %HR(max), %HRR, %VO(2max) and %VO(2)R relationships. International journal of sports medicine 2010, 31(5):319-326.
27. Pollock ML, Gaesser GA, Butcher JD, Despres J, Dishman RK, Franklin BA, Garber CE: American College of Sports Medicine Position Stand. The recommended quantity and quality of exercise for developing and maintaining cardiorespiratory and muscular fitness, and flexibility in healthy adults. Medicine and science in sports and exercise 1998, 30(6):975-991.
28. Bouchard C, Leon AS, Rao DC, Skinner JS, Wilmore JH, Gagnon J: The HERITAGE family study. Aims, design, and measurement protocol. Medicine and science in sports and exercise 1995, 27(5):721-729.
29. Bouchard C, Daw EW, Rice T, Perusse L, Gagnon J, Province MA, Leon AS, Rao DC, Skinner JS, Wilmore JH: Familial resemblance for VO2max in the sedentary state: the HERITAGE family study. Medicine
and science in sports and exercise 1998, 30(2):252-258.
30. Skinner JS, Gaskill SE, Rankinen T, Leon AS, Rao DC, Wilmore JH, Bouchard C: Heart rate versus %VO2max: age, sex, race, initial fitness, and training response--HERITAGE. Medicine and science in
sports and exercise 2003, 35(11):1908-1913.
31. Belsley DA: Regression diagnostics : identifying influential data and sources of collinearity. Hoboken, N.J.: Wiley-Interscience; 2004.
32. Huber PJ, Ronchetti E: Robust statistics, 2nd edn. Hoboken, N.J.: Wiley; 2009.
33. ISO: ISO-Standards: Statistical methods for use in proficiency testing by interlaboratory
comparison. In., vol. 13528; ISO 13528:2015 [available at
https://www.iso.org/standard/56125.html].
34. Shieh G: A comparison of two indices for the intraclass correlation coefficient. Behavior research
methods 2012, 44(4):1212-1223.
35. Rutterford C, Copas A, Eldridge S: Methods for sample size determination in cluster randomized trials. International journal of epidemiology 2015, 44(3):1051-1067.
36. Gagnon J, Province MA, Bouchard C, Leon AS, Skinner JS, Wilmore JH, Rao DC: The HERITAGE Family Study: quality assurance and quality control. Annals of epidemiology 1996, 6(6):520-529.
37. Skinner JS, Wilmore KM, Jaskolska A, Jaskolski A, Daw EW, Rice T, Gagnon J, Leon AS, Wilmore JH, Rao DC et al: Reproducibility of maximal exercise test data in the HERITAGE family study. Medicine
and science in sports and exercise 1999, 31(11):1623-1628.
38. Stanforth PR, Gagnon J, Rice T, Bouchard C, Leon AS, Rao DC, Skinner JS, Wilmore JH: Reproducibility of resting blood pressure and heart rate measurements. The HERITAGE Family Study. Annals of
epidemiology 2000, 10(5):271-277.
39. Wilmore JH, Stanforth PR, Domenick MA, Gagnon J, Daw EW, Leon AS, Rao DC, Skinner JS, Bouchard C: Reproducibility of anthropometric and body composition measurements: the HERITAGE Family Study. International journal of obesity and related metabolic disorders : journal of the International
Association for the Study of Obesity 1997, 21(4):297-303.
40. Swain DP, American College of Sports Medicine., American College of Sports Medicine.: ACSM's resource manual for Guidelines for exercise testing and prescription, 7th edn. Philadelphia: Wolters Kluwer Health/Lippincott Williams & Wilkins; 2014.
S
TUDY
2
Population-specific equations do not increase the prediction
accuracy of the relationship between oxygen uptake reserve
and heart rate reserve during incremental exercise
Introduction
It is well known that cardiorespiratory fitness is positively associated with health status, and structured and individualized aerobic exercise training is the most widely recommended form of exercise prescribed in order to improve it.[1] Structuring an aerobic exercise prescription involves the manipulation of several parameters
related to both the overall training regimen (e.g., weekly exercise frequency, volume, progression, etc.) and the single exercise session (e.g., duration, intensity, etc.). Intensity is an important consideration when tailoring aerobic exercise prescription. Indeed, low intensity is considered safe but may not be sufficient to elicit the biological responses that improve cardiorespiratory fitness,[1] whereas vigorous intensity, although
effective in improving cardiorespiratory fitness,[1] can increase the risks associated with exercise.[2]
Aerobic exercise intensity is usually prescribed and monitored using parameters calculated on the basis of the objective physiological measures of either oxygen uptake (V̇O2) or heart rate (HR).[2] Over the years,
correlations between HR and V̇O2 have been found, and these two parameters have been used
interchangeably to prescribe and monitor aerobic exercise.
Initially, a linear relation was found between the percentages of maximal V̇O2 (V̇O2max) and maximal HR
(HRmax).[3-7] However, it was found that this relationship can vary among individuals, depending on, for
instance, individual cardiorespiratory fitness level.[8] Therefore, the relation between the percentage reserve
values (i.e., the difference between the maximal and resting values) of V̇O2 (V̇O2R) and HR (HRR) was further
investigated. Swain et al.[8] proved that %HRR and %V̇O
2R were strongly correlated and their regression line
was not distinguishable from the identity line (i.e., the regression line with slope = 1 and intercept = 0), which means that the percentages of the two reserves had a 1:1 relationship. As a result of such findings, since 1998 the American College of Sports Medicine (ACSM) has recommended adopting either %V̇O2R or %HRR
Subsequently, several studies confirmed that the percentages of HRR and V̇O2R are indistinguishable from
the identity line.[8, 10-15] However, other investigations yielded conflicting results, showing that the relation
between %HRR and %V̇O2R was different from the identity line.[10, 14, 16-20]
The highly variable conflicting nature of the results present in the available literature was further reinforced by the results obtained in the first study (STUDY 1) of the present work. STUDY 1 showed high standard
deviations (SD) for both intercepts and slopes of the individual linear regressions performed with %HRR (dependent variable) and %V̇O2R (independent variable), highlighting high variability among individuals.
Therefore, using a single equation, which is represented by the mean slope and intercept, as proposed in the current literature,[2] to predict the individual relationships between %HRR and %V̇O
2R can lead to important
and substantial error in single individual (see STUDY 1).
The high variability within and between studies, along with the aforementioned conflicting nature of their results, are cause for concern when we consider that the HR-V̇O2 relationships are used to prescribe aerobic
exercise intensity.
A possible explanation that may have accounted for the high SD found in the regression coefficients (i.e., slopes and intercepts) of the individual linear regressions between %HRR and %V̇O2R in STUDY 1 was the
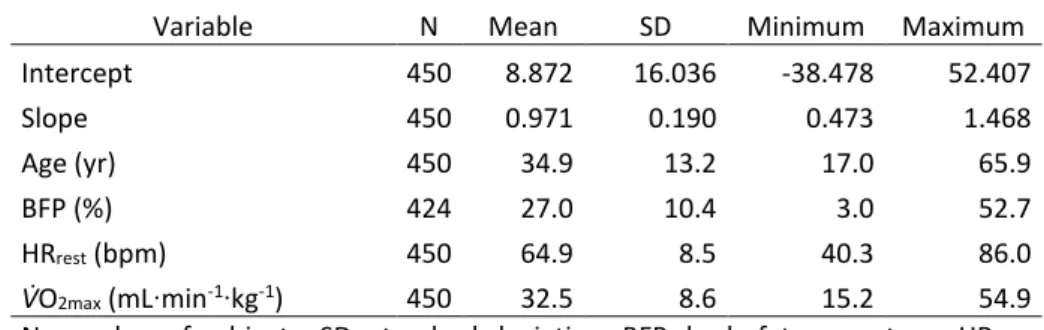
heterogeneity of the participants (see Table 1).
Subject characteristics have been found to be related to the relationships (i.e., slopes and intercepts) between HR and V̇O2,[15, 19] and the need for population-specific equations for a more accurate exercise
prescription based on %HRR, %V̇O2max and %V̇O2R relationships is highlighted in Cunha’s review.[21]
Determining whether individual characteristics affect and account for part of the variance of individual linear regression intercepts and slopes would directly affect and potentially improve the accuracy of aerobic exercise intensity prescription, allowing practitioners and researchers to prescribe aerobic exercise intensity by tailoring the %HRR and %V̇O2R relationship according to individual characteristics.
Aim
The aim of the present study was to assess the potential confounding effect of several individual characteristics on the relationship (i.e., slopes and intercepts) between the percentages of HRR and V̇O2R,
and subsequently to use those variables as predictors to increase the accuracy of the %HRR vs. %V̇O2R
Methods
Sample
The sample of the present investigation was composed of 741 members of Caucasian and African American families participating in the pre-training assessments of the HERITAGE Family Study (see Bouchard et al.[22]
for details regarding ethical approval, inclusion and exclusion criteria, and study design).
All the subjects enrolled in the HERITAGE study, ranging in age from 17 to 65, were healthy (i.e., with no significant medical conditions or diseases), sedentary (i.e., they had not engaged in regular physical activity in the previous 6 months), and were not taking any medications that could affect the outcome variables of the present investigation.
HERITAGE study assessments
The HERITAGE study included several exercise and non-exercise tests performed before and after an aerobic exercise training intervention. In the present study, only baseline (body weight, body composition and pre-exercise HR) and pre-exercise testing (V̇O2max tests) data of selected pre-training assessments were used (see
below).
Body weight, body composition and pre-exercise heart rate
Body mass was measured to the nearest 0.1 kg using a balance beam scale. Body composition was measured by means of underwater weighing performed in the post-absorptive state and body fat percentage (BFP) was calculated. Resting HR (HRrest) was measured both immediately before the exercise test and at the end of a
5-min rest period with the subject sitting quietly in a chair.
Maximum oxygen uptake
Participants’ V̇O2max was identified based on the results of two cardiorespiratory fitness tests. First, a
continuous, incremental exercise test to exhaustion (T1) was performed on a cycle ergometer (model 800S – Sensor Medics, Yorba Linda, CA, USA) connected to a mixing-chamber metabolic cart (model 2900 – Sensor Medics, Yorba Linda, CA, USA). In the first 3-min stage, participants pedalled at 50 W. The resistance of the ergometer was then increased by 25 W every 2 minutes until volitional exhaustion (in older, smaller, or less fit subjects, starting the test with a lower power output and/or making smaller increases every 2 minutes was permitted). At least 48 hours later, a submaximal, steady-state exercise test was performed, followed by