Lancet Neurol 2018 Published Online November 5, 2018 http://dx.doi.org/10.1016/ S1474-4422(18)30404-6 See Online/Comment http://dx.doi.org/10.1016/ S1474-4422(18)30398-3 *Collaborators listed at the end of the Article
Correspondence to: Prof Giancarlo Logroscino, Center for Neurodegenerative Diseases and the Aging Brain, Department of Clinical Research in Neurology, University of Bari Aldo Moro, Pia Fondazione Cardinale G Panico, Tricase 73039, Italy
Global, regional, and national burden of motor neuron
diseases 1990–2016: a systematic analysis for the Global
Burden of Disease Study 2016
GBD 2016 Motor Neuron Disease Collaborators*
Summary
Background
Understanding how prevalence, incidence, and mortality of motor neuron diseases change over time and
by location is crucial for understanding the causes of these disorders and for health-care planning. Our aim was to
produce estimates of incidence, prevalence, and disability-adjusted life-years (DALYs) for motor neuron diseases for
195 countries and territories from 1990 to 2016 as part of the Global Burden of Diseases, Injuries, and Risk Factors
Study (GBD) 2016.
Methods
The motor neuron diseases included in this study were amyotrophic lateral sclerosis, spinal muscular
atrophy, hereditary spastic paraplegia, primary lateral sclerosis, progressive muscular atrophy, and pseudobulbar
palsy. Incidence, prevalence, and DALYs were estimated using a Bayesian meta-regression model. We analysed
14 165 site-years of vital registration cause of death data using the GBD 2016 cause of death ensemble model. The
84 risk factors quantified in GBD 2016 were tested for an association with incidence or death from motor neuron
diseases. We also explored the relationship between Socio-demographic Index (SDI; a compound measure of income
per capita, education, and fertility) and age-standardised DALYs of motor neuron diseases.
Findings
In 2016, globally, 330 918 (95% uncertainty interval [UI] 299 522–367 254) individuals had a motor neuron
disease. Motor neuron diseases have caused 926 090 (881 566–961 758) DALYs and 34 325 (33 051–35 364) deaths in
2016. The worldwide all-age prevalence was 4·5 (4·1–5·0) per 100 000 people, with an increase in age-standardised
prevalence of 4·5% (3·4–5·7) over the study period. The all-age incidence was 0·78 (95% UI 0·71–0·86) per
100 000 person-years. No risk factor analysed in GBD showed an association with motor neuron disease incidence.
The largest age-standardised
prevalence was in high SDI regions: high-income North America (16·8, 95% UI
15·8–16·9), Australasia (14·7, 13·5–16·1), and western Europe (12·9, 11·7–14·1). However, the prevalence and
incidence were lower than expected based on SDI in high-income Asia Pacific.
Interpretation
Motor neuron diseases have low prevalence and incidence, but cause severe disability with a high
fatality rate. Incidence of motor neuron diseases has geographical heterogeneity, which is not explained by any risk
factors quantified in GBD,
suggesting other unmeasured risk factors might have a role. Between 1990 and 2016, the
burden of motor neuron diseases has increased substantially. The estimates presented here, as well as future estimates
based on data from a greater number of countries, will be important in the planning of services for people with motor
neuron diseases worldwide.
Funding
Bill & Melinda Gates Foundation.
Copyright
© 2018 The Author(s). Published by Elsevier Ltd. This is an Open Access article under the CC BY 4.0 license.
Introduction
Motor neuron diseases are a group of neurodegenerative
disorders related to upper and lower motor neuron
degeneration, including amyotrophic lateral sclerosis,
spinal muscular atrophy, hereditary spastic paraplegia,
primary lateral sclerosis, progressive muscular atrophy,
and pseudobulbar palsy. Amyotrophic lateral sclerosis,
the most common motor neuron disease, is clinically
characterised by extensive paralysis leading to death
generally by respiratory failure, with 50% of patients
dying within 15–20 months after diagnosis.
1,2Although spinal muscular atrophy and hereditary
spastic paraplegia are known to have a genetic basis,
the causes of other motor neuron diseases remain
unknown, but are postulated to combine environmental
and genetic factors.
1,3,4Genetic variants have been
associated with amyotrophic lateral sclerosis,
3whereas
the contribution of environmental factors, with the
possible exception of smoking,
5,6is still not clear because
of the difficulties in assessment of potential risk factors
retrospectively in case-control studies.
Previous reviews and meta-analyses using a
world-wide approach to study amyotrophic lateral sclerosis
reported a median prevalence of 4·48 per 100 000
(IQR 3·03–6·70)
7and a standardised incidence rate of
1·68 per 100 000 person-years (95% CI 1·50–1·85)
8that
varied with geography, sex, and age.
8Amyotrophic lateral
sclerosis is
rare before age 50 years, with peak incidence
at age 70 years followed by a sharp decrease in incidence.
8,9Previous syntheses of motor neuron disease prevalence,
7incidence,
8and phenotype
2based on population-based
studies have had scarce geographical coverage. Although
insights into our under standing of the epidemiology
of motor neuron diseases, and amyotrophic lateral
sclerosis in particular, have been provided by
population-based registries in Europe over the past two decades
10,11and in the USA more recently,
12these epidemiological
surveillance systems are not available in other parts of
the world. Additionally, world wide data on other metrics
of motor neuron disease burden (eg, mortality, years of
life lost [YLLs], years of life lived with disability [YLDs],
and disability-adjusted life-years [DALYs]) are still scarce.
Within the Global Burden of Diseases, Injuries, and
Risk Factors Study (GBD) 2016, we quantified the burden
of motor neuron diseases in terms of incidence,
prevalence, mortality, and DALYs (a sum of YLLs and
YLDs) between 1990 and 2016 by age, sex, year, and
geographical location. Our study considers motor neuron
diseases across the whole age spectrum including spinal
muscular atrophy, a rare disorder in the first years of life
affecting proximal limbs and respiratory muscles. The
relationships between motor neuron disease burden and
country development level, as measured by the
Socio-demographic Index (SDI), a composite measure of
income per capita, years of schooling, and total fertility
rate, were
also analysed.
Methods
Overview
General methods used in GBD 2016 are reported in the
appendix. Specific methods relevant to the estimation of
motor neuron disease burden are described here. Motor
neuron diseases included in this analysis were amyotrophic
lateral sclerosis, spinal muscular atrophy, hereditary
spastic paraplegia, primary lateral sclerosis, progressive
muscular atrophy, and pseudobulbar palsy. We analysed
See Online for appendix
Research in context
Evidence before this study
Motor neuron diseases are a group of rare neurodegenerative
disorders (amyotrophic lateral sclerosis, spinal muscular atrophy,
hereditary spastic paraplegia, primary lateral sclerosis, progressive
muscular atrophy, and pseudobulbar palsy) that are fatal in
50% of affected people within 15 to 20 months after diagnosis.
Previous epidemiological studies of motor neuron diseases
showed large geographical variations in incidence, but no data on
motor neuron disease incidence existed for most countries. We
did a systematic review of prevalence, incidence, and mortality
risk in PubMed for articles published in English from Jan 1, 1990,
to Dec 31, 2015. In the Global Burden of Diseases, Injuries, and
Risk Factors Study (GBD), systematic reviews for motor neuron
diseases are done every 3 years, with new sources suggested by
GBD collaborators included in each round of estimates. The
search terms were: ((“motor neuron disease”[MeSH Terms]
OR (“motor”[All Fields] AND “neuron”[All Fields] AND
“disease”[All Fields]) OR “motor neuron disease”[All Fields]
OR (“motor”[All Fields] AND “neuron”[All Fields] AND
“diseases”[All Fields]) OR “motor neuron diseases”[All Fields])
OR (“amyotrophic lateral sclerosis”[MeSH Terms] OR
(“amyotrophic”[All Fields] AND “lateral“[All Fields] AND
“sclerosis”[All Fields]) OR “amyotrophic lateral sclerosis”[All
Fields]) OR “ALS”[All Fields] OR (“motor neuron disease”[MeSH
Terms] OR (“motor“[All Fields] AND “neuron”[All Fields] AND
“disease”[All Fields]) OR “motor neuron disease”[All Fields] OR
(“primary”[All Fields] AND “lateral”[All Fields] AND “sclerosis”[All
Fields]) OR “primary lateral sclerosis”[All Fields]) OR
(“PLS”[Journal] OR “pls”[All Fields]) OR (“muscular atrophy,
spinal”[MeSH Terms] OR (“muscular”[All Fields] AND
“atrophy”[All Fields] AND “spinal”[All Fields]) OR “spinal muscular
atrophy”[All Fields] OR (“progressive”[All Fields] AND
“muscular”[All Fields] AND “atrophy”[All Fields]) OR “progressive
muscular atrophy”[All Fields]) OR “PBP”[All Fields] OR
(“pseudobulbar palsy”[MeSH Terms] OR (“pseudobulbar”[All
Fields] AND “palsy”[All Fields]) OR “pseudobulbar palsy”[All
Fields])) AND ((“epidemiology”[Subheading] OR
“epidemiology”[All Fields] OR “epidemiology”[MeSH Terms]) OR
“population-based”[All Fields]).
Added value of this study
This is the first concerted effort to make the methods and results
of GBD accessible to clinicians and researchers with an interest in
motor neuron disease. We show that the burden of motor
neuron disease
is highest in countries with a high
Socio-demographic Index (SDI; a measure of country social
development based on education, income, and fertility),
especially high-income North America, western Europe, and
Australasia, but not in high-income Asia Pacific. We show that
age-standardised incidence rates of motor neuron diseases vary
within each SDI level,
suggesting that causative factors other
than sociodemographic development are responsible for the
geographical variation in disease occurrence. We also show that
the geographical heterogeneity of motor neuron disease burden
is not explained by any of the 84 risk factors quantified in GBD,
suggesting a role of unmeasured risk factors.
Implication of all the available evidence
The burden of motor neuron diseases is currently greatest in
high-income countries and this burden is increasing because of
population ageing. Small increases in age-standardised
incidence and prevalence rates occurred between 1990 and
2016, but we report larger increases in counts because of
population ageing and population growth. Despite the absence
of a cure for motor neuron diseases, these findings are
important to health service planning as the care of patients
with motor neuron disease is intensive and expensive.
Additional research into the causes of motor neuron disease
is needed.
motor neuron diseases across all ages, and included motor
neuron disease with a strong genetic component with high
prevalence in the early years of life.
Mortality
The International Classification of Diseases ninth
edition (ICD-9) code for motor neuron diseases
is
335 and the ICD-10 code is G12. Mortality from motor
neuron diseases was modelled by use of CODEm, the
cause of death ensemble model used throughout GBD.
The model used 14
165 site-years of data—ie, a
combination of location and calendar year—as well as
predictive covariates on asbestos production, mean
serum cholesterol, fruit consumption, average latitude,
proportion of the population with access to sanita tion,
proportion of the population with access to clean
water, health-care access and quality,
13education,
log-transformed lag-distributed income, and SDI.
14Predictive covariates in our cause of death analytical
tool, CODEm, are based on literature review of factors
that have been found to be associated with a disease of
interest without necessarily having sufficient evidence
for a causal relationship. CODEm is designed to choose
the set of covariates that best predicts mortality rates
given the available data from vital registrations and
verbal autopsy studies.
Non-fatal disease modelling
The El Escorial Criteria
15were used as the reference
diagnostic criteria for amyotrophic lateral sclerosis.
Spinal muscular atrophy cases defined by ICD codes
were also included. Data from administrative health
records reporting by ICD codes were also included. We
identified 55 sources through our systematic literature
review, including 47 sources on incidence, covering
seven of the 21 world regions, and eight sources on
prevalence, covering five of the 21 world regions
(appendix). We also added 3 years (2000, 2010, and 2012)
of US medical claims data. There were no data for
southeast Asia, Oceania, central Asia, eastern Europe,
Australasia, the Caribbean, Andean Latin America,
central Latin America, south Asia, central sub-Saharan
Africa, southern Saharan Africa, and western
sub-Saharan Africa. Where data points spanned age ranges
greater than 20 years, we split the data into 5-year age
bands using the age pattern of the USA, where we had
the most detailed motor neuron disease data by age.
We used DisMod-MR 2.1, the Bayesian
meta-regression modelling tool developed for GBD, to
generate results that were consistent with the available
data on prevalence and incidence, as well as with our
estimates for mortality due to motor neuron diseases.
In the model, we included a setting of no remission (ie,
no cure). We used DisMod-MR 2.1 to adjust for
systematic bias in the first 2 years of US claims data,
because the data for 2000 and 2010 were systematically
lower than the data for 2012. Additionally, we included
the absolute value of latitude, as a country-level predictor
on prevalence, and included
national income, with a
built-in short lag, as a country-level predictor on excess
mortality rate.
Motor neuron disease severity and YLDs
To identify the different health consequences of motor
neuron diseases, we analysed data from the largest
amyotrophic lateral sclerosis clinical dataset, with a total
of 8635 patient records: the Pooled Resource
Open-access ALS Clinical Trials (PRO-ACT).
16These data were
compiled by the PRO-ACT Consortium, which is a
collaboration between Prize4Life and the Northeast ALS
Consortium, with funding from the ALS Therapy
Alliance. The data available in the PRO-ACT database
have been volunteered by PRO-ACT Consortium
members.
17We used records with complete information
on the Amyotrophic Lateral Sclerosis Functional Rating
Scale Revised (ALSFRS-R; n=4838)
and selected only the
observation at enrolment into a trial to eliminate
potential bias from treatment effects.
We used the ALSFRS-R to establish the severity
distri-bution of three symptom domains:
motor impairment,
respiratory problems, and speech impair
ment. Motor
impairment of the legs was assessed by two questions,
and we mapped a combined score of 8 to a state of no
impairment, 5–7 to mild impairment, 2–4 to moderate
impairment, and 0–1 to severe impairment. Three
addi-tional questions assessed fine motor impair ment, and a
combined score of 12 corresponded to no impairment,
9–11 to mild impairment, 3–8 to moderate impairment,
and 0–2 to severe impairment. To summarise total motor
impairment, we took the more severe of the two rankings.
Respiratory problems were assessed by one question,
and a score of 4 indicated no impairment, 3 indicated
mild impairment, 2 indicated moderate impairment,
and 0–1 indicated severe impair ment. Finally, there was
one question on speech impair ment, and we mapped a
score of 4 to no impairment, and any other score to an
impaired state.
After establishing the severity status, we estimated the
relative proportions of each of the 29 combinations of
the different levels on the three domains. To derive
combined disability weights for each impairment
combination, which constitute the different potential
health outcomes of motor neuron disease, we used a
multiplicative aggregation formula.
18DALYs
The proportions from the ALSFRS-R analysis were
applied to the prevalence estimates derived from
DisMod-MR 2.1, and the prevalence of each long-term
outcome was multiplied by the combined disability
weights to get uncorrected YLDs. The initial YLD
estimates were adjusted for comorbidity by use of the
comorbidity simulation
across all causes included in
number of deaths in each age group by the remaining
life expectancy derived from the GBD standard life table
(appendix). DALYs were then calculated by summing
YLLs and YLDs.
Uncertainty was propagated by sampling 1000 draws
at each computational step, which allowed for the
com-bination of uncertainty from different sources,
in-cluding input data, data processing steps, and residual
non-sampling error. Uncertainty intervals (UIs) were
defined as the 25th and 975th values of the ordered
draws and were used to define significant change over
time. This study complies with the Guidelines for
Accurate and Transparent Health Estimates Reporting
(GATHER) recommendations (appendix).
Risk factors
In GBD 2016, the contribution of 84 risks and
com-binations of risks to disease burden was quantified.
20Criteria for inclusion of risks into GBD include: the
availability of sufficient evidence for a causal relationship
between a risk and one or more disease or injury
out-come; evidence to support generalisability of an effect
size beyond the populations included in epidemi ological
studies; availability of sufficient data and methods to
enable estimation of exposure levels by country; and the
probable importance of a risk factor to disease burden or
policy considerations.
20Role of the funding source
The funder of the study had no role in study design,
data collection, data analysis, data interpretation, or the
writing of the report. All authors had full access to the
data in the study and had final responsibility for
the decision to submit for publication.
Results
All results presented in this paper can be found in the
GBD 2016 online results tool, with all estimates from
1990 to 2016 for all world regions. The same results
can also be explored by use of the GBD 2016 data
visualisation tool.
In 2016, 330 918 (95% UI 299 522–367 254) individuals
worldwide had a motor neuron disease: 161 901 (48·9%)
in high SDI, 50
286 (15·2%) in high-middle SDI,
70 924 (21·4%) in middle SDI, 38 873 (11·8%) in
low-middle SDI, and 8545 (2·6%) in low SDI countries
(table). The all-age global prevalence was 4·5 (4·1–5·0)
per 100 000 population. Globally, we estimated there to be
57 452 (52 522–63 242) incident cases of a motor neuron
disease, and all-age global incidence of motor neuron
disease to be 0·78 (0·71–0·86) per 100 000 person-years.
We estimated there to be 34 325 (33 051–35 364) motor
neuron disease-related deaths (table), with an all-age
cause-specific mortality rate of 0·46 (0·45–0·48) per
100 000 person-years. Motor neuron diseases caused
926 090 (881 566–961 758) DALYs (table; age-standardised
DALYs rate 13·2, 12·5–13·7), of which 70
165
(49
321–93
203) were YLDs (age-standardised rate
1·0, 0·7–1·3) and 855 924 (819 373–883 289) were YLLs
(age-standardised rate 12·2, 11·6–12·6).
From 1990 to 2016, the worldwide age-standardised
mortality rates of motor neuron disease increased
by
8·0% (95% UI –0·1 to 12·2; table). A statistically
signifi-cant increase in age-standardised mortality was present
across all SDI quintiles, except for the low SDI group.
Globally, the age-standardised prevalence of motor
neuron disease increased by 4·5% (3·4 to 5·7; table)
while the all-age prevalence increased by 18·8%
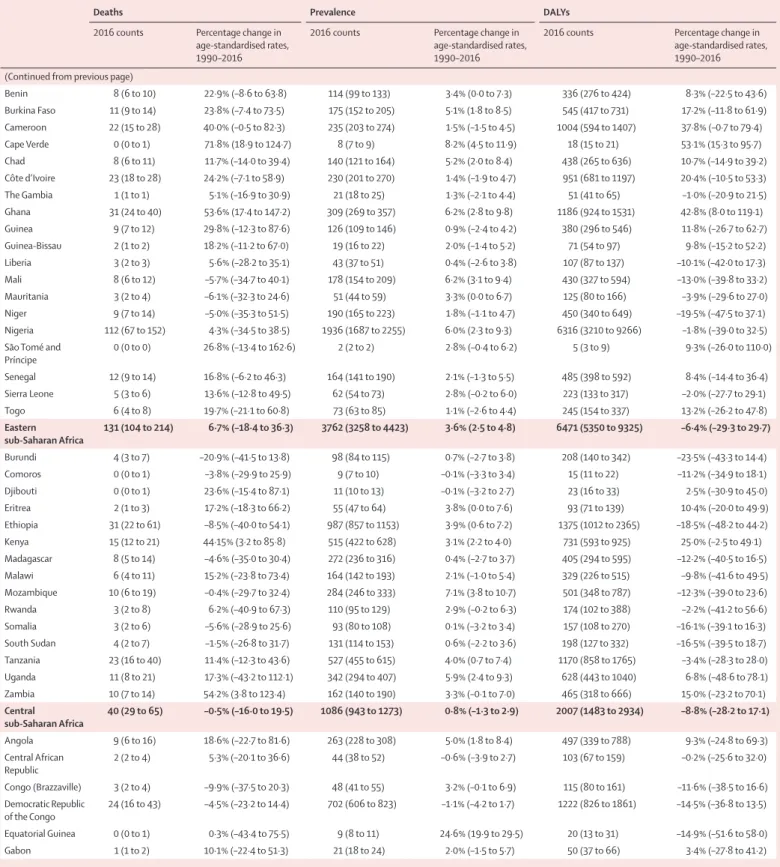
(15·28 to 22·21). A map of age-standardised prev alence
of motor neuron disease in each country for both sexes is
shown in figure 1. Age-standardised prevalence increased
in low SDI, low-middle SDI, middle SDI, high-middle
SDI, and high SDI quintiles (table).
The age-standardised
incidence of motor neuron disease was stable in all SDI
groups, except for the high SDI quintile where incidence
increased by 13·0% (11·9 to 14·1) from 1·60 to 1·81 per
100 000 population (see the GBD 2016 online results
tool). No statistically significant change was found in the
global age-standardised DALY rate of motor neuron
diseases (–1·5%, –9·3 to 2·9; table).
Considering 21 GBD regions, in 2016, the highest
all-age prevalence was observed in high-income North
America (20·2, 95% UI 19·0–21·5), followed by
Australasia (17·7, 16·2–19·2) and western Europe (16·7,
15·3–18·1). The lowest all-age prevalence was in
sub-Saharan Africa, especially in central sub-sub-Saharan Africa
(0·9, 0·8–1·1), followed by eastern sub-Saharan Africa
(1·0, 0·8–1·1) and western sub-Saharan Africa (1·0,
0·9–1·2). Only a small proportion of these geographical
differences in the prevalence can be explained by a
different age structure of the countries: in 2016,
age-standardised prevalence per 100 000 population ranged
from a high of 22·6 (20·9–24·7) in Canada to a low
of 1·1 (0·9–1·2) in the Central African Republic.
Among regions with high SDI values, age-standardised
prevalence per 100 000 population was lowest in
high-income Asia Pacific, southern Latin America, eastern
Europe and central Europe (figure 1). Age-standardised
prevalence per 100 000 population was 16·8 (15·8–17·9)
in high-income North America, 14·7 (13·5–16·1) in
Australasia, 12·9 (11·7–14·1) in western Europe,
1·2 (1·1–1·4) in central sub-Saharan Africa, 1·3 (1·1–1·4)
in eastern sub-Saharan Africa, and 1·3 (1·2–1·5) in
western sub-Saharan Africa. Half of the world’s
prevalent cases resided in countries in the highest SDI
quintile, most of whom were living in high-income
North America and western Europe (table).
The prevalence ranking was generally consistent with
that of incidence (see the GBD 2016 online results
tool). The highest age-standardised incidence per
100 000 person-years was in Australasia with 2·77
(2·63 to 2·91), followed by high-income North America
with 2·30 (2·20 to 2·41) and western Europe with 2·00
(1·89 to 2·11). The lowest age-standardised incidence
For the online results tool see http://ghdx.healthdata.org/gbd-results-tool For the GBD 2016 data
visualisation tool see https://
vizhub.healthdata.org/gbd-compare
Deaths Prevalence DALYs
2016 counts Percentage change in age-standardised rates, 1990–2016
2016 counts Percentage change in age-standardised rates, 1990–2016
2016 counts Percentage change in
age-standardised rates, 1990–2016 Global 34 325 (33 051 to 35 364) 8·0% (–0·1 to 12·2) 330 918 (299 522 to 367 254) 4·5% (3·4 to 5·7) 926 090 (881 566 to 961 758) –1·5% (–9·3 to 2·9) High SDI 21 162 (20 081 to 21 830) 14·1% (5·2 to 19·1) 174 346)161 901 (150 024 to 19·7% (18·0 to 21·6) 479 748 (455 714 to 496 340) 3·8% (–3·7 to 8·2) High-middle SDI 4712 (4392 to 4972) 20·7% (2·9 to 31·8) 50 286 (44 798 to 56 819) 16·2% (14·2 to 17·9) 144 696 (134 507 to 153 708) 0·4% (–19·2 to 17·9) Middle SDI 5183 (4934 to 5387) 22·7% (9·7 to 30·6) 70 924 (61 566 to 82 419) 12·3% (10·3 to 14·0) 177 160 (166 987 to 185 970) 5·7% (–6·0 to 18·0) Low-middle SDI 2813 (2455 to 3304) 36·7% (11·7 to 57·3) 38 873 (33 761 to 45 357) 10·2% (8·9 to 11·4) 104 268 (93 547 to 119 177) 21·6% (4·8 to 37·3) Low SDI 443 (382 to 648) 20·2% (–1·8 to 41·9) 8545 (7405 to 10 007) 3·8% (2·8 to 5·0) 19 786 (17 506 to 26 045) 7·1% (–12·9 to 31·5) High-income North America (8226 to 8870)8592 27·2% (19·7 to 32·8) (68 184 to 77 282)72 577 7·4% (4·4 to 10·8) 204 447 (195 872 to 212 530) 14·1% (8·0 to 18·9) Canada 959 (873 to 1045) 20·2% (6·8 to 33·6) 10 013 (9208 to 10 952) 42·1% (35·4 to 49·3) 22 072 (20 194 to 23 900) 12·7% (1·0 to 24·3) Greenland 0 (0 to 1) 3·3% (–24·6 to 41·1) 8 (7 to 9) 29·8% (25·1 to 35·0) 11 (9 to 14) –1·4% (–24·6 to 27·5) USA 7632 (7315 to 7902) 27·9% (20·3 to 34·0) 62 531 (58 894 to 66 406) 3·4% (0·1 to 7·2) 182 359 (174 927 to 189 911) 14·3% (8·1 to 19·3) Australasia 850 (776 to 925) 20·0% (6·9 to 32·3) 5065 (4632 to 5506) 29·4% (25·1 to 33·9) 18 723 (17 236 to 20 191) 11·3% (0·0 to 23·1) Australia 711 (643 to 779) 21·9% (6·8 to 36·3) 4247 (3886 to 4621) 30·3% (25·4 to 35·4) 15 625 (14 212 to 17 040) 12·7% (–1·1 to 26·1) New Zealand 139 (122 to 157) 10·8% (–5·6 to 26·5) 818 (747 to 887) 25·1% (19·8 to 30·8) 3097 (2730 to 3465) 3·5% (–10·8 to 18·1) High-income Asia-Pacific 1919 (1777 to 2055) –9·2% (–15·6 to –2·9) 17 574 (15 713 to 19 782) 18·9% (16·5 to 21·5) 40 294 (37 320 to 43 001) –18·1% (–23·4 to –12·8) Brunei 1 (0 to 1) 7·3% (–24·0 to 41·3) 19 (17 to 21) 16·2% (12·2 to 20·9) 23 (18 to 28) 7·3% (–20·7 to 38·8) Japan 1796 (1660 to 1927) –2·5% (–10·2 to 4·5) 13 893 (12 394 to 15 659) 19·9% (17·6 to 22·5) 36 101 (33 402 to 38 439) –11·9% (–18·2 to –6·6) Singapore 23 (19 to 29) 9·9% (–14·2 to 39·2) 243 (219 to 271) 20·6% (16·0 to 25·1) 718 (592 to 868) –1·2% (–21·0 to 24·5) South Korea 100 (72 to 130) –33·9% (–55·6 to –8·1) 3419 (3033 to 3860) 26·3% (21·5 to 31·3) 3452 (2658 to 4327) –34·7% (–52·4 to –12·0) Western Europe 10 357 (9723 to 10 818) 15·2% (3·6 to 22·1) (65 330 to 77 548)71 288 31·2% (29·1 to 33·3) (213 738 to 237 121)227 135 –0·2% (–9·8 to 6·1) Andorra 2 (2 to 3) 13·2% (–15·4 to 52·2) 15 (14 to 17) 21·0% (16·6 to 25·3) 50 (36 to 62) –0·4% (–23·2 to 30·2) Austria 152 (136 to 168) 36·8% (20·2 to 54·1) 1282 (1172 to 1405) 36·9% (31·6 to 42·3) 3721 (3367 to 4114) 17·2% (1·0 to 34·7) Belgium 263 (232 to 293) 24·8% (6·5 to 41·6) 1850 (1699 to 2019) 37·2% (31·8 to 43·4) 5983 (5353 to 6648) 10·9% (–4·9 to 26·9) Cyprus 13 (11 to 14) –15·4% (–47·2 to 4·2) 108 (98 to 118) 19·7% (14·8 to 24·8) 303 (273 to 336) –27·4% (–55·4 to –5·5) Denmark 134 (114 to 156) –15·4% (–29·5 to 0·4) 983 (899 to 1078) 20·8% (16·5 to 25·9) 2915 (2487 to 3339) –19·4% (–31·6 to –5·5) Finland 183 (159 to 204) –23·8% (–38·5 to –9·1) 1207 (1103 to 1319) 19·5% (14·4 to 25·2) 3959 (3455 to 4405) –24·2% (–38·4 to –11·3) France 1557 (1408 to 1707) 5·0% (–7·5 to 17·7) 11 712 (10 762 to 12 638) 27·3% (22·5 to 32·1) 34 427 (31 349 to 37 585) –6·1% (–17·5 to 5·6) Germany 1911 (1698 to 2129) 1·3% (–16·3 to 19·9) 12 502 (11 442 to 13 684) 27·5% (22·7 to 32·9) 42 111 (37 875 to 46 516) –9·9% (–26·6 to 6·6) Greece 111 (96 to 124) 156·3% (104·4 to 202·3) 1141 (1031 to 1256) 29·4% (24·2 to 34·6) 2994 (2620 to 3375) 114·9% (51·4 to 166·4) Iceland 8 (7 to 9) 23·7% (5·9 to 41·6) 61 (56 to 67) 25·1% (20·2 to 30·2) 188 (169 to 208) 12·8% (–2·6 to 28·6) Ireland 120 (104 to 138) 24·7% (4·4 to 47·8) 835 (764 to 911) 37·6% (31·6 to 44·0) 2927 (2571 to 3344) 17·9% (–1·5 to 38·5) Israel 73 (59 to 89) –23·2% (–43·1 to –0·9) 784 (714 to 863) 17·4% (12·7 to 22·1) 1991 (1642 to 2373) –29·6% (–47·2 to –9·8) Italy 1418 (1 270 to 1 570) 35·8% (18·6 to 54·5) 9553 (8745 to 10 416) 34·5% (28·4 to 40·4) 30 525 (27 281 to 33 409) 9·0% (–6·5 to 26·1) Luxembourg 9 (8 to 10) 4·4% (–11·4 to 20·3) 86 (79 to 95) 27·2% (22·1 to 32·9) 217 (192 to 245) –7·5% (–21·3 to 6·4) Malta 8 (7 to 10) 14·5% (–5·9 to 40·8) 62 (56 to 67) 32·2% (26·7 to 37·9) 194 (164 to 233) 15·5% (–4·0 to 38·4) Netherlands 494 (443 to 554) 7·8% (–7·1 to 22·8) 3347 (3060 to 3648) 28·1% (23·0 to 33·1) 11 110 (9988 to 12 405) –1·4% (–14·5 to 11·8) Norway 124 (107 to 141) 1·9% (–13·2 to 18·0) 1046 (961 to 1153) 28·0% (22·3 to 33·5) 2764 (2416 to 3125) –8·4% (–21·2 to 5·3) Portugal 185 (166 to 205) 95·7% (70·3 to 124·7) 1365 (1250 to 1489) 37·6% (31·7 to 43·8) 4639 (4173 to 5106) 48·2% (21·7 to 73·4) Spain 905 (819 to 991) 41·1% (25·9 to 56·8) 6436 (5888 to 7035) 36·7% (31·0 to 42·3) 20 680 (18 811 to 22 572) 12·1% (–1·0 to 26·0) Sweden 304 (266 to 344) 35·9% (15·6 to 55·6) 2153 (1944 to 2416) 33·5% (28·7 to 39·3) 6141 (5401 to 897) 25·3% (7·8 to 43·3) Switzerland 184 (143 to 233) –7·4% (–31·0 to 22·2) 1441 (1314 to 1578) 22·8% (17·9 to 28·3) 3971 (3164 to 4972) –12·9% (–33·9 to 12·7) United Kingdom 2199 (2075 to 2281) 23·8% (15·5 to 29·3) 13 249 (12 000 to 14 556) 34·5% (31·7 to 37·8) 45 310 (42 802 to 47 187) 0·2% (–6·1 to 4·5) Southern Latin America 477 (423 to 532) 17·9% (–4·4 to 36·0) 4527 (4103 to 5021) 27·8% (24·7 to 31·1) 12 806 (11 433 to 14 281) 12·6% (–8·3 to 29·1) Argentina 279 (247 to 309) 29·2% (4·0 to 48·4) 2850 (2576 to 3164) 27·8% (23·6 to 32·5) 7570 (6748 to 8342) 22·0% (–0·3 to 38·8) Chile 152 (116 to 192) 4·7% (–26·3 to 41·0) 1391 (1253 to 1550) 27·6% (23·3 to 32·1) 4123 (3177 to 5265) 0·2% (–28·0 to 33·8) Uruguay 47 (42 to 51) –1·5% (–15·5 to 12·7) 285 (261 to 314) 23·4% (18·9 to 28·3) 1112 (998 to 1217) –4·2% (–17·5 to 8·2)
Deaths Prevalence DALYs
2016 counts Percentage change in age-standardised rates, 1990–2016
2016 counts Percentage change in age-standardised rates, 1990–2016
2016 counts Percentage change in age-standardised rates, 1990–2016 (Continued from previous page)
Eastern Europe 729 (583 to 909) 36·1% (6·0 to 72·7) 6497 (5784 to 7341) 3·2% (0·3 to 6·0) 21 974 (17 757 to 27 107) 24·3% (–0·7 to 54·7) Belarus 33 (26 to 39) 29·3% (4·2 to 56·1) 290 (257 to 329) 5·4% (1·3 to 9·5) 934 (757 to 1 121) 17·7% (–3·3 to 42·2) Estonia 6 (5 to 7) –1·0% (–16·8 to 14·6) 45 (41 to 51) 2·7% (–0·6 to 6·5) 156 (133 to 177) –12·5% (–26·0 to 1·6) Latvia 10 (9 to 12) 114·3% (75·3 to 151·7) 66 (59 to 74) 7·0% (3·3 to 10·7) 273 (230 to 312) 85·2% (50·8 to 116·4) Lithuania 30 (26 to 33) 133·8% (99·8 to 167·1) 121 (110 to 135) 21·3% (15·7 to 26·8) 743 (658 to 824) 105·3% (76·2 to 133·9) Moldova 9 (8 to 11) 16·9% (–5·7 to 41·9) 100 (88 to 114) 1·1% (–2·4 to 5·1) 297 (254 to 345) 15·9% (–5·4 to 38·2) Russia 486 (357 to 655) 39·9% (–0·3 to 90·8) 4 587 (4 079 to 5 196) 2·7% (–1·2 to 6·8) 15 218 (11 485 to 20 363) 25·3% (–7·0 to 65·5) Ukraine 155 (120 to 199) 18·5% (–10·5 to 57·9) 1287 (1141 to 1443) 1·8% (–2·4 to 5·9) 4352 (3386 to 5553) 14·0% (–11·8 to 48·9) Central Europe 691 (636 to 742) 5·3% (–9·7 to 15·7) 4449 (3998 to 4974) 4·2% (2·1 to 6·5) 19 034 (17 601 to 20 320) –9·3% (–20·9 to –0·3) Albania 6 (5 to 7) –7·2% (–24·2 to 11·7) 88 (78 to 99) 6·8% (2·5 to 10·9) 192 (161 to 221) –15·0% (–30·7 to 1·4) Bosnia and Herzegovina 13 (11 to 15) 22·5% (–18·2 to 57·7) 128 (114 to 145) 10·1% (5·6 to 14·8) 373 (317 to 439) 16·6% (–19·6 to 46·4) Bulgaria 17 (14 to 20) –28·5% (–42·5 to –13·1) 245 (216 to 277) –4·5% (–9·1 to 0·1) 493 (414 to 580) –40·9% (–51·5 to –28·6) Croatia 38 (32 to 44) 12·1% (–5·7 to 32·3) 179 (161 to 198) –0·4% (–5·0 to 4·8) 1054 (907 to 1202) –6·9% (–21·6 to 10·3) Czech Republic 77 (69 to 85) 0·5% (–12·9 to 13·8) 443 (397 to 496) –0·8% (–5·1 to 3·8) 2101 (1893 to 2306) –16·1% (–28·7 to –2·1) Hungary 80 (70 to 90) 0·3% (–14·5 to 16·7) 393 (353 to 438) –1·5% (–6·1 to 3·5) 2289 (2013 to 2578) –18·6% (–32·2 to –1·4) Macedonia 4 (4 to 5) –52·0% (–62·5 to –40·1) 64 (57 to 72) –5·8% (–10·4 to –0·8) 136 (121 to 151) –70·1% (–78·5 to –58·3) Montenegro 1 (1 to 1) 3·0% (–14·6 to 23·0) 20 (18 to 23) 4·1% (–0·1 to 8·3) 39 (33 to 44) –5·3% (–19·7 to 11·8) Poland 346 (307 to 389) 2·9% (–18·9 to 21·2) 1695 (1528 to 1888) 6·5% (2·4 to 10·9) 9135 (8111 to 10 229) –8·7% (–28·0 to 7·5) Romania 61 (54 to 68) 24·4% (1·4 to 47·1) 639 (566 to 720) 6·4% (2·2 to 10·7) 1825 (1623 to 2047) 8·5% (–12·3 to 29·5) Serbia 23 (20 to 25) 22·5% (3·9 to 43·3) 288 (256 to 327) 3·9% (–0·5 to 8·3) 662 (595 to 727) 8·9% (–7·2 to 26·0) Slovakia 21 (17 to 24) 42·5% (13·7 to 69·6) 192 (171 to 217) 6·1% (2·1 to 10·2) 611 (512 to 704) 25·0% (–0·2 to 50·2) Slovenia 4 (4 to 5) –79·2% (–82·8 to –74·5) 77 (68 to 87) –20·1% (–25·4 to –14·4) 124 (106 to 142) –82·4% (–85·6 to –78·3) Central Asia 114 (100 to 130) 5·3% (–5·8 to 20·0) 1830 (1612 to 2083) 2·3% (0·6 to 3·9) 4127 (3637 to 4706) –0·5% (–10·0 to 10·0) Armenia 5 (4 to 5) 5·8% (–12·2 to 24·4) 73 (65 to 83) 3·7% (–0·4 to 7·3) 149 (131 to 168) –2·8% (–17·5 to 13·1) Azerbaijan 13 (11 to 16) 35·7% (0·5 to 101·2) 215 (190 to 246) 5·2% (1·6 to 9·2) 477 (390 to 575) 24·2% (–5·1 to 78·2) Georgia 9 (8 to 11) –6·4% (–26·9 to 21·4) 102 (90 to 115) 1·7% (–1·8 to 5·4) 290 (238 to 353) –6·3% (–25·9 to 19·9) Kazakhstan 34 (23 to 47) –2·2% (–21·6 to 22·5) 417 (366 to 474) 4·0% (0·2 to 8·0) 1180 (836 to 1634) –6·0% (–23·3 to 15·4) Kyrgyzstan 6 (6 to 7) 3·2% (–16·7 to 30·3) 113 (99 to 129) –0·1% (–3·7 to 3·5) 260 (226 to 293) 1·8% (–17·6 to 27·3) Mongolia 3 (3 to 4) 38·4% (0·4 to 76·2) 60 (53 to 69) 6·8% (3·1 to 11·0) 121 (102 to 142) 21·2% (–3·5 to 47·0) Tajikistan 5 (4 to 8) –1·9% (–23·8 to 25·0) 146 (127 to 169) –1·1% (–4·5 to 2·2) 245 (196 to 320) –13·4% (–34·8 to 10·9) Turkmenistan 8 (6 to 10) 23·9% (–3·1 to 46·9) 107 (94 to 122) 5·7% (1·8 to 9·3) 314 (245 to 380) 11·8% (–12·9 to 33·1) Uzbekistan 30 (26 to 34) 37·2% (4·7 to 73·7) 597 (524 to 682) 4·0% (0·2 to 8·0) 1091 (949 to 1249) 25·9% (–0·4 to 55·0) Central Latin America 748 (683 to 791) 57·0% (39·4 to 67·7) 7609 (6627 to 8760) 9·7% (8·3 to 11·1) 23 660 (21 696 to 25 181) 37·1% (23·0 to 45·8) Colombia 176 (150 to 201) 67·9% (44·4 to 93·6) 1383 (1233 to 1564) 12·4% (8·2 to 16·6) 5306 (4562 to 6054) 41·7% (21·2 to 62·0) Costa Rica 41 (35 to 46) 47·6% (23·6 to 73·3) 209 (189 to 232) 17·2% (12·5 to 22·2) 1093 (940 to 1239) 48·6% (24·4 to 73·2) El Salvador 9 (8 to 11) 19·9% (–4·6 to 46·9) 157 (139 to 180) 7·7% (4·0 to 11·8) 296 (250 to 342) 11·9% (–9·1 to 34·6) Guatemala 16 (12 to 20) 26·6% (–14·9 to 113·6) 367 (319 to 423) 5·7% (2·0 to 9·5) 570 (449 to 717) 19·4% (–16·4 to 88·2) Honduras 14 (11 to 20) 43·2% (–0·2 to 99·3) 192 (168 to 220) 6·3% (2·4 to 10·5) 501 (375 to 660) 25·5% (–11·0 to 70·5) Mexico 381 (351 to 405) 64·2% (51·7 to 74·1) 4187 (3577 to 4949) 9·8% (8·1 to 11·7) 12 494 (11 556 to 13 234) 38·7% (28·5 to 46·7) Nicaragua 8 (6 to 9) 33·6% (–1·3 to 73·1) 148 (130 to 168) 4·2% (0·6 to 8·0) 266 (219 to 316) 20·2% (–6·6 to 51·1) Panama 12 (10 to 15) 9·8% (–18·0 to 37·0) 117 (104 to 131) 9·4% (5·6 to 13·0) 384 (312 to 450) 9·4% (–16·8 to 35·7) Venezuela 90 (74 to 108) 28·6% (–4·7 to 67·0) 850 (751 to 966) 5·1% (1·6 to 9·0) 2750 (2235 to 3288) 27·5% (–5·0 to 65·5) Andean Latin America 114 (98 to 130) 8·3% (–9·9 to 26·0) 1408 (1249 to 1596) 6·5% (4·3 to 9·0) 3564 (3085 to 4013) –1·7% (–18·7 to 14·6) Bolivia 26 (19 to 34) 24·1% (–28·0 to 72·0) 246 (216 to 281) 7·6% (3·9 to 11·5) 804 (598 to 1047) 11·4% (–36·3 to 51·9) Ecuador 39 (35 to 44) 60·6% (31·3 to 84·0) 382 (337 to 435) 7·6% (3·8 to 11·0) 1221 (1077 to 1361) 43·5% (16·9 to 63·4) Peru 49 (39 to 60) –17·5% (–36·1 to 7·6) 779 (691 to 887) 5·6% (2·3 to 9·3) 1539 (1243 to 1855) –24·2% (–41·4 to –0·4)
Deaths Prevalence DALYs
2016 counts Percentage change in age-standardised rates, 1990–2016
2016 counts Percentage change in age-standardised rates, 1990–2016
2016 counts Percentage change in
age-standardised rates, 1990–2016 (Continued from previous page)
Caribbean 188 (171 to 204) 3·6% (–9·5 to 19·9) 1481 (1326 to 1657) 2·8% (0·8 to 4·9) 5721 (5093 to 6327) –5·0% (–20·5 to 10·3) Antigua and Barbuda 0 (0 to 0) –5·7% (–23·1 to 13·6) 3 (3 to 3) 4·9% (1·5 to 8·4) 7 (6 to 8) –4·7% (–20·7 to 12·7) The Bahamas 2 (2 to 2) –5·2% (–28·1 to 31·6) 14 (13 to 16) –0·2% (–3·8 to 3·3) 59 (51 to 69) –12·5% (–33·6 to 21·4) Barbados 4 (3 to 4) 12·7% (–5·7 to 36·5) 14 (13 to 15) 4·3% (0·8 to 7·8) 95 (84 to 107) 12·0% (–6·5 to 37·2) Belize 1 (1 to 1) 136·6% (46·9 to 229·1) 10 (9 to 11) 9·8% (5·6 to 13·6) 33 (25 to 43) 89·1% (23·8 to 167·1) Bermuda 0 (0 to 0) –36·5% (–53·5 to –13·5) 3 (3 to 4) –5·4% (–8·9 to –1·9) 11 (8 to 13) –41·5% (–55·6 to –18·2) Cuba 91 (81 to 101) –2·6% (–17·8 to 18·5) 502 (449 to 559) 2·7% (–1·3 to 6·8) 2500 (2228 to 2769) –11·1% (–24·1 to 6·7) Dominica 1 (0 to 1) 50·4% (4·7 to 88·4) 3 (2 to 3) 13·8% (10·1 to 18·4) 16 (14 to 19) 51·9% (7·4 to 89·6) Dominican Republic 16 (13 to 20) 13·7% (–23·7 to 45·7) 303 (268 to 344) 8·5% (4·8 to 12·6) 529 (428 to 631) 0·3% (–30·0 to 26·3) Grenada 1 (0 to 1) 72·9% (20·0 to 148·8) 3 (3 to 4) 13·6% (9·1 to 18·0) 16 (13 to 19) 64·5% (16·1 to 133·6) Guyana 2 (2 to 3) –1·5% (–22·9 to 20·6) 18 (16 to 21) 9·0% (5·1 to 13·3) 72 (59 to 86) –8·5% (–27·5 to 12·4) Haiti 23 (16 to 31) 16·6% (–31·3 to 62·3) 225 (196 to 260) 2·8% (–0·6 to 6·3) 957 (633 to 1 391) –1·7% (–45·3 to 45·8) Jamaica 11 (9 to 14) 45·5% (4·1 to 92·6) 91 (81 to 102) 5·8% (1·8 to 9·8) 424 (318 to 568) 31·7% (–12·2 to 87·8) Puerto Rico 24 (21 to 27) 16·2% (–6·9 to 39·6) 156 (141 to 174) 8·0% (4·1 to 11·5) 636 (555 to 709) 5·7% (–14·7 to 25·7) Saint Lucia 1 (1 to 1) 61·5% (15·4 to 124·7) 6 (6 to 7) 14·8% (10·8 to 19·2) 33 (30 to 37) 50·8% (8·1 to 106·5)
Saint Vincent and
the Grenadines 1 (1 to 1) 176·2% (136·0 to 228·0) 4 (3 to 4) 13·1% (9·1 to 17·0) 19 (17 to 21) 131·0% (86·8 to 178·2) Suriname 2 (2 to 2) 55·8% (27·8 to 85·3) 15 (13 to 17) 10·0% (6·0 to 14·1) 65 (56 to 75) 39·5% (14·7 to 68·3) Trinidad and Tobago 7 (6 to 7) 6·5% (–16·4 to 29·3) 46 (41 to 52) 7·8% (4·0 to 12·0) 197 (173 to 221) 10·0% (–13·5 to 35·0) Virgin Islands 2 (1 to 2) 58·9% (21·5 to 95·1) 6 (6 to 7) 18·1% (13·4 to 23·5) 39 (32 to 46) 45·6% (12·1 to 80·1) Tropical Latin America 1155 (1073 to 1219) 79·1% (60·0 to 90·1) 8125 (7084 to 9365) 20·0% (17·2 to 23·1) 33 632 (31 235 to 35 552) 57·7% (40·5 to 68·1) Brazil 1132 (1051 to 1197) 77·3% (58·9 to 88·3) 7919 (6904 to 9132) 20·3% (17·4 to 23·5) 32 909 (30 585 to 34 846) 56·2% (39·4 to 66·6) Paraguay 23 (19 to 26) 215·4% (120·4 to 311·1) 206 (184 to 233) 10·8% (6·8 to 14·9) 723 (610 to 834) 177·6% (101·4 to 253·5) East Asia 3097 (2956 to 3234) –1·3% (–12·4 to 16·3) 56 465 (48 633 to 65 987) 18·2% (15·3 to 20·9) 111 827 (104 988 to 118 511) –11·6% (–22·7 to 13·2) China 2988 (2839 to 3122) –1·1% (–12·4 to 17·4) 54 405 (46 781 to 63 692) 18·6% (15·6 to 21·4) 107 731 (100 956 to 114 351) –12·1% (–23·8 to 13·8) North Korea 60 (43 to 96) 14·6% (–6·1 to 43·8) 955 (847 to 088) 2·6% (–0·9 to 6·0) 2477 (1814 to 3998) 12·6% (–11·9 to 45·5) Taiwan (province of China) 49 (40 to 57) –28·0% (–44·3 to –12·3) 1104 (981 to 1253) 13·5% (9·2 to 17·5) 1619 (1354 to 1881) –22·9% (–38·2 to –8·1) Southeast Asia 903 (770 to 997) 25·2% (0·5 to 37·0) 16 378 (14 345 to 18 910) 10·4% (9·2 to 11·6) 33 240 (28 726 to 36 864) 10·5% (–5·9 to 20·4) Cambodia 15 (11 to 19) 36·7% (–0·1 to 74·7) 316 (278 to 362) 10·6% (7·0 to 14·3) 622 (457 to 783) 20·6% (–13·0 to 58·5) Indonesia 335 (232 to 397) 43·1% (24·6 to 59·8) 6151 (5193 to 7307) 10·6% (9·0 to 12·4) 12 963 (9505 to 15 281) 17·0% (2·5 to 38·1) Laos 7 (5 to 10) 24·9% (–11·7 to 79·0) 142 (124 to 163) 11·1% (7·4 to 15·2) 390 (242 to 652) 10·1% (–28·4 to 70·3) Malaysia 43 (33 to 49) 23·8% (–17·2 to 54·9) 814 (722 to 925) 8·6% (4·9 to 12·4) 1541 (1236 to 1761) 17·8% (–18·4 to 44·5) Maldives 0 (0 to 0) –24·4% (–48·9 to 21·6) 8 (7 to 10) 8·7% (5·3 to 12·5) 13 (11 to 16) –34·7% (–55·7 to 11·8) Mauritius 3 (3 to 4) 2·7% (–14·7 to 21·5) 41 (37 to 47) 8·6% (5·4 to 12·9) 103 (89 to 121) –3·5% (–18·6 to 13·7) Myanmar 110 (93 to 131) 26·7% (–13·7 to 60·1) 1285 (1139 to 1465) 13·3% (9·3 to 17·4) 3879 (3307 to 4615) 17·6% (–16·1 to 49·6) Philippines 102 (79 to 124) 17·0% (–11·3 to 44·4) 2309 (2034 to 2655) 6·7% (3·3 to 10·2) 3903 (3142 to 4678) 2·5% (–19·9 to 24·7) Sri Lanka 40 (32 to 51) 21·6% (–16·3 to 62·9) 593 (523 to 674) 9·6% (6·0 to 13·0) 1360 (1074 to 1677) –0·2% (–32·6 to 40·2) Seychelles 0 (0 to 0) 0·6% (–24·5 to 24·7) 3 (2 to 3) 7·5% (4·0 to 11·2) 7 (5 to 8) –3·8% (–26·8 to 17·2) Thailand 123 (106 to 142) –3·4% (–26·3 to 17·7) 2166 (1911 to 2458) 10·0% (6·7 to 13·7) 4091 (3555 to 4724) –7·3% (–27·7 to 11·9) Timor–Leste 1 (1 to 1) 39·7% (–12·3 to 136·9) 23 (20 to 26) 13·6% (10·0 to 17·3) 39 (27 to 55) 11·5% (–30·4 to 94·6) Vietnam 123 (99 to 153) 28·3% (–6·5 to 69·3) 2504 (2209 to 2846) 11·4% (7·8 to 15·6) 4324 (3536 to 5319) 14·0% (–13·6 to 46·4) Oceania 13 (10 to 18) –5·7% (–21·2 to 12·4) 212 (187 to 244) 4·0% (1·6 to 6·5) 467 (384 to 621) –3·8% (–19·4 to 15·3) American Samoa 0 (0 to 0) –22·1% (–42·3 to –0·3) 2 (2 to 2) 0·0% (–3·6 to 3·8) 5 (4 to 6) –19·2% (–39·4 to 2·8) Federated States of Micronesia 0 (0 to 0) 23·7% (–21·4 to 72·2) 2 (2 to 2) 6·4% (2·8 to 10·4) 8 (6 to 11) 22·0% (–19·7 to 71·1) Fiji 2 (1 to 2) 33·5% (–14·7 to 88·8) 22 (19 to 25) 7·0% (3·5 to 10·5) 52 (40 to 66) 31·3% (–11·1 to 82·3)
Deaths Prevalence DALYs
2016 counts Percentage change in age-standardised rates, 1990–2016
2016 counts Percentage change in age-standardised rates, 1990–2016
2016 counts Percentage change in age-standardised rates, 1990–2016 (Continued from previous page)
Guam 1 (1 to 1) –45·2% (–56·6 to –30·4) 6 (6 to 7) –16·3% (–20·2 to –12·5) 30 (24 to 35) –42·6% (–54·6 to –27·4)
Kiribati 0 (0 to 0) 46·4% (10·2 to 95·3) 2 (2 to 2) 4·7% (1·4 to 8·4) 9 (7 to 12) 46·0% (10·7 to 96·7)
Marshall Islands 0 (0 to 0) 0·9% (–27·8 to 29·8) 1 (1 to 2) 4·7% (0·9 to 8·2) 4 (3 to 6) 1·1% (–25·3 to 28·8)
Northern Mariana
Islands 0 (0 to 0) 43·9% (2·4 to 97·0) 3 (3 to 4) 5·5% (2·1 to 9·2) 8 (6 to 11) 30·4% (–6·9 to 78·5)
Papua New Guinea 8 (5 to 12) –1·3% (–22·4 to 30·4) 135 (118 to 156) 6·9% (3·2 to 10·7) 290 (203 to 424) –2·6% (–23·6 to 27·6)
Samoa 0 (0 to 1) –7·6% (–26·6 to 19·1) 5 (4 to 5) 5·8% (2·4 to 9·4) 10 (7 to 17) –6·6% (–25·4 to 19·0)
Solomon Islands 1 (1 to 1) 6·6% (–17·0 to 44·9) 11 (9 to 13) 5·4% (1·6 to 8·9) 27 (21 to 40) 9·5% (–15·2 to 49·2)
Tonga 0 (0 to 0) –1·4% (–25·5 to 29·2) 3 (2 to 3) 5·4% (2·2 to 9·1) 6 (5 to 8) 0·1% (–22·7 to 30·8)
Vanuatu 0 (0 to 1) 14·3% (–15·7 to 52·6) 6 (5 to 6) 5·3% (1·7 to 8·9) 15 (12 to 23) 17·2% (–13·3 to 56·3)
North Africa and
Middle East 1139 (964 to 1276) 5·7% (–23·6 to 24·5) 13 291 (11 746 to 15 182) 3·1% (1·7 to 4·4) 45 475 (38 290 to 51 031) –14·3% (–40·1 to 9·3) Afghanistan 37 (21 to 59) 31·8% (4·2 to 71·9) 517 (444 to 603) 3·2% (–0·8 to 7·0) 1689 (945 to 2676) 22·7% (–3·3 to 59·7) Algeria 60 (51 to 70) 6·9% (–16·4 to 32·5) 943 (832 to 1 079) 2·9% (–1·4 to 7·0) 2332 (1961 to 2736) –8·6% (–31·9 to 16·7) Bahrain 1 (1 to 2) –7·6% (–31·9 to 21·7) 36 (31 to 42) 4·1% (0·4 to 8·3) 60 (47 to 76) –10·5% (–32·2 to 17·0) Egypt 168 (102 to 217) 29·6% (–1·6 to 62·3) 1908 (1682 to 2185) 7·1% (3·0 to 11·6) 6211 (3881 to 7959) 7·4% (–16·1 to 33·7) Iran 106 (86 to 129) 84·9% (19·8 to 175·5) 2012 (1781 to 2283) 7·3% (3·3 to 11·7) 3839 (3181 to 4608) 58·6% (9·7 to 120·1) Iraq 36 (28 to 46) 25·3% (–13·8 to 72·9) 782 (676 to 907) 3·6% (–0·2 to 7·5) 1684 (1287 to 2256) 17·1% (–16·8 to 60·1) Jordan 9 (7 to 11) 39·2% (–18·7 to 106·4) 174 (153 to 200) 4·5% (0·5 to 9·0) 431 (338 to 530) 42·3% (–11·0 to 99·7) Kuwait 5 (4 to 7) –21·0% (–43·4 to 10·9) 116 (102 to 134) –0·3% (–4·2 to 3·9) 263 (198 to 346) –29·3% (–47·6 to –1·7) Lebanon 8 (5 to 11) –27·7% (–65·6 to 8·0) 159 (140 to 179) 3·2% (–1·0 to 7·2) 273 (182 to 360) –32·4% (–66·2 to 0·9) Libya 15 (8 to 20) 40·9% (–4·5 to 84·2) 150 (132 to 172) –3·8% (–7·5 to 0·2) 560 (317 to 731) 22·3% (–11·8 to 59·6) Morocco 47 (38 to 55) 42·2% (13·6 to 72·3) 783 (690 to 896) 5·1% (1·3 to 9·1) 1733 (1418 to 2051) 21·6% (–2·6 to 50·1) Oman 5 (3 to 7) 75·1% (0·5 to 271·7) 108 (94 to 125) 7·2% (3·4 to 11·2) 203 (142 to 279) 43·3% (–10·6 to 156·2) Palestine 4 (3 to 5) 9·5% (–19·2 to 44·7) 102 (88 to 118) 3·0% (–0·7 to 7·2) 179 (153 to 214) –16·4% (–39·9 to 17·6) Qatar 2 (1 to 3) –3·9% (–37·6 to 48·3) 62 (53 to 71) 4·4% (0·1 to 8·9) 92 (67 to 122) –10·0% (–39·0 to 32·9) Saudi Arabia 42 (32 to 51) 88·1% (10·5 to 197·3) 854 (717 to 1 022) 7·1% (5·1 to 9·1) 1683 (1305 to 1997) 48·2% (–8·7 to 114·8) Sudan 39 (25 to 51) 34·0% (8·6 to 64·6) 618 (540 to 719) 6·9% (2·8 to 10·8) 1882 (1092 to 2694) 21·6% (–8·3 to 64·1) Syria 19 (15 to 23) 23·4% (–21·5 to 75·4) 413 (361 to 477) 4·0% (–0·1 to 8·3) 741 (627 to 894) 5·6% (–34·4 to 44·3) Tunisia 19 (14 to 23) 15·6% (–22·2 to 54·7) 298 (263 to 339) 5·1% (0·8 to 8·8) 669 (530 to 820) –3·1% (–38·2 to 27·2) Turkey 470 (392 to 566) –18·9% (–52·2 to 16·3) 2554 (2274 to 2864) –1·5% (–5·7 to 2·6) 18 887 (15 336 to 23 603) –36·1% (–64·3 to 16·7) United Arab Emirates 26 (14 to 37) 67·0% (–4·0 to 170·1) 266 (231 to 306) 1·7% (–1·9 to 6·0) 1082 (614 to 1552) 49·8% (–12·2 to 139·8) Yemen 21 (15 to 29) 40·1% (–0·3 to 100·8) 420 (365 to 483) 5·1% (1·0 to 9·1) 982 (665 to 1356) 20·8% (–13·6 to 68·4) South Asia 2711 (2231 to 3277) 48·9% (18·0 to 76·6) 32 104 (27 566 to 37 755) 14·2% (12·8 to 15·7) 95 154 (80 575 to 109 736) 35·7% (12·3 to 55·2) Bangladesh 146 (104 to 240) –25·6% (–46·2 to 4·4) 2851 (2501 to 3272) 8·6% (5·0 to 12·5) 5726 (4307 to 8582) –29·6% (–49·4 to 6·8) Bhutan 1 (1 to 2) 30·2% (–8·1 to 75·0) 15 (14 to 18) 11·8% (7·7 to 15·7) 40 (31 to 57) 11·7% (–21·8 to 54·5) India 2309 (1894 to 2726) 56·9% (21·4 to 86·5) 25 276 (21 450 to 30 120) 16·1% (14·6 to 17·6) 79 261 (66 554 to 90 980) 44·0% (15·8 to 65·0) Nepal 33 (23 to 57) 45·8% (4·8 to 125·7) 514 (449 to 592) 8·1% (4·4 to 12·7) 1177 (848 to 1929) 25·4% (–9·3 to 104·3) Pakistan 223 (175 to 311) 66·4% (18·0 to 133·3) 3448 (3020 to 3988) 7·0% (3·3 to 10·8) 8950 (7142 to 12 333) 48·5% (11·2 to 95·9) Southern sub-Saharan Africa 73 (67 to 79) 31·4% (6·3 to 55·4) 1114 (957 to 1317) 4·7% (3·4 to 6·2) 2617 (2391 to 2838) 23·4% (2·6 to 43·5) Botswana 2 (1 to 3) 42·5% (–33·1 to 133·9) 31 (27 to 36) 6·6% (3·1 to 10·1) 80 (37 to 119) 41·8% (–32·3 to 129·7) Lesotho 2 (1 to 3) 108·8% (0·0 to 214·2) 26 (22 to 30) 6·5% (2·7 to 10·2) 63 (44 to 89) 106·2% (2·0 to 206·7) Namibia 2 (1 to 2) 10·7% (–30·6 to 58·7) 32 (28 to 37) 4·8% (1·2 to 8·1) 63 (43 to 88) 9·0% (–29·8 to 51·3) South Africa 55 (50 to 59) 29·3% (1·9 to 49·7) 841 (711 to 1 003) 5·9% (4·4 to 7·5) 1932 (1769 to 2108) 19·8% (–2·6 to 37·4) Swaziland 1 (0 to 1) 30·0% (–19·4 to 101·8) 16 (14 to 19) 5·0% (1·5 to 8·8) 31 (20 to 45) 31·6% (–15·9 to 97·2) Zimbabwe 12 (9 to 15) 38·2% (–4·2 to 153·8) 168 (145 to 197) –1·4% (–4·7 to 1·7) 449 (356 to 574) 33·2% (–5·8 to 126·9) Western sub-Saharan Africa 273 (220 to 330) 16·6% (–8·0 to 36·8) 4075 (3541 to 4754) 4·5% (2·7 to 6·1) 13 364 (8976 to 16 996) 7·8% (–17·8 to 28·8)
Deaths Prevalence DALYs
2016 counts Percentage change in age-standardised rates, 1990–2016
2016 counts Percentage change in age-standardised rates, 1990–2016
2016 counts Percentage change in
age-standardised rates, 1990–2016 (Continued from previous page)
Benin 8 (6 to 10) 22·9% (–8·6 to 63·8) 114 (99 to 133) 3·4% (0·0 to 7·3) 336 (276 to 424) 8·3% (–22·5 to 43·6) Burkina Faso 11 (9 to 14) 23·8% (–7·4 to 73·5) 175 (152 to 205) 5·1% (1·8 to 8·5) 545 (417 to 731) 17·2% (–11·8 to 61·9) Cameroon 22 (15 to 28) 40·0% (–0·5 to 82·3) 235 (203 to 274) 1·5% (–1·5 to 4·5) 1004 (594 to 1407) 37·8% (–0·7 to 79·4) Cape Verde 0 (0 to 1) 71·8% (18·9 to 124·7) 8 (7 to 9) 8·2% (4·5 to 11·9) 18 (15 to 21) 53·1% (15·3 to 95·7) Chad 8 (6 to 11) 11·7% (–14·0 to 39·4) 140 (121 to 164) 5·2% (2·0 to 8·4) 438 (265 to 636) 10·7% (–14·9 to 39·2) Côte d’Ivoire 23 (18 to 28) 24·2% (–7·1 to 58·9) 230 (201 to 270) 1·4% (–1·9 to 4·7) 951 (681 to 1197) 20·4% (–10·5 to 53·3) The Gambia 1 (1 to 1) 5·1% (–16·9 to 30·9) 21 (18 to 25) 1·3% (–2·1 to 4·4) 51 (41 to 65) –1·0% (–20·9 to 21·5) Ghana 31 (24 to 40) 53·6% (17·4 to 147·2) 309 (269 to 357) 6·2% (2·8 to 9·8) 1186 (924 to 1531) 42·8% (8·0 to 119·1) Guinea 9 (7 to 12) 29·8% (–12·3 to 87·6) 126 (109 to 146) 0·9% (–2·4 to 4·2) 380 (296 to 546) 11·8% (–26·7 to 62·7) Guinea-Bissau 2 (1 to 2) 18·2% (–11·2 to 67·0) 19 (16 to 22) 2·0% (–1·4 to 5·2) 71 (54 to 97) 9·8% (–15·2 to 52·2) Liberia 3 (2 to 3) 5·6% (–28·2 to 35·1) 43 (37 to 51) 0·4% (–2·6 to 3·8) 107 (87 to 137) –10·1% (–42·0 to 17·3) Mali 8 (6 to 12) –5·7% (–34·7 to 40·1) 178 (154 to 209) 6·2% (3·1 to 9·4) 430 (327 to 594) –13·0% (–39·8 to 33·2) Mauritania 3 (2 to 4) –6·1% (–32·3 to 24·6) 51 (44 to 59) 3·3% (0·0 to 6·7) 125 (80 to 166) –3·9% (–29·6 to 27·0) Niger 9 (7 to 14) –5·0% (–35·3 to 51·5) 190 (165 to 223) 1·8% (–1·1 to 4·7) 450 (340 to 649) –19·5% (–47·5 to 37·1) Nigeria 112 (67 to 152) 4·3% (–34·5 to 38·5) 1936 (1687 to 2255) 6·0% (2·3 to 9·3) 6316 (3210 to 9266) –1·8% (–39·0 to 32·5) São Tomé and
Príncipe 0 (0 to 0) 26·8% (–13·4 to 162·6) 2 (2 to 2) 2·8% (–0·4 to 6·2) 5 (3 to 9) 9·3% (–26·0 to 110·0) Senegal 12 (9 to 14) 16·8% (–6·2 to 46·3) 164 (141 to 190) 2·1% (–1·3 to 5·5) 485 (398 to 592) 8·4% (–14·4 to 36·4) Sierra Leone 5 (3 to 6) 13·6% (–12·8 to 49·5) 62 (54 to 73) 2·8% (–0·2 to 6·0) 223 (133 to 317) –2·0% (–27·7 to 29·1) Togo 6 (4 to 8) 19·7% (–21·1 to 60·8) 73 (63 to 85) 1·1% (–2·6 to 4·4) 245 (154 to 337) 13·2% (–26·2 to 47·8) Eastern sub-Saharan Africa 131 (104 to 214) 6·7% (–18·4 to 36·3) 3762 (3258 to 4423) 3·6% (2·5 to 4·8) 6471 (5350 to 9325) –6·4% (–29·3 to 29·7) Burundi 4 (3 to 7) –20·9% (–41·5 to 13·8) 98 (84 to 115) 0·7% (–2·7 to 3·8) 208 (140 to 342) –23·5% (–43·3 to 14·4) Comoros 0 (0 to 1) –3·8% (–29·9 to 25·9) 9 (7 to 10) –0·1% (–3·3 to 3·4) 15 (11 to 22) –11·2% (–34·9 to 18·1) Djibouti 0 (0 to 1) 23·6% (–15·4 to 87·1) 11 (10 to 13) –0·1% (–3·2 to 2·7) 23 (16 to 33) 2·5% (–30·9 to 45·0) Eritrea 2 (1 to 3) 17·2% (–18·3 to 66·2) 55 (47 to 64) 3·8% (0·0 to 7·6) 93 (71 to 139) 10·4% (–20·0 to 49·9) Ethiopia 31 (22 to 61) –8·5% (–40·0 to 54·1) 987 (857 to 1153) 3·9% (0·6 to 7·2) 1375 (1012 to 2365) –18·5% (–48·2 to 44·2) Kenya 15 (12 to 21) 44·15% (3·2 to 85·8) 515 (422 to 628) 3·1% (2·2 to 4·0) 731 (593 to 925) 25·0% (–2·5 to 49·1) Madagascar 8 (5 to 14) –4·6% (–35·0 to 30·4) 272 (236 to 316) 0·4% (–2·7 to 3·7) 405 (294 to 595) –12·2% (–40·5 to 16·5) Malawi 6 (4 to 11) 15·2% (–23·8 to 73·4) 164 (142 to 193) 2·1% (–1·0 to 5·4) 329 (226 to 515) –9·8% (–41·6 to 49·5) Mozambique 10 (6 to 19) –0·4% (–29·7 to 32·4) 284 (246 to 333) 7·1% (3·8 to 10·7) 501 (348 to 787) –12·3% (–39·0 to 23·6) Rwanda 3 (2 to 8) 6·2% (–40·9 to 67·3) 110 (95 to 129) 2·9% (–0·2 to 6·3) 174 (102 to 388) –2·2% (–41·2 to 56·6) Somalia 3 (2 to 6) –5·6% (–28·9 to 25·6) 93 (80 to 108) 0·1% (–3·2 to 3·4) 157 (108 to 270) –16·1% (–39·1 to 16·3) South Sudan 4 (2 to 7) –1·5% (–26·8 to 31·7) 131 (114 to 153) 0·6% (–2·2 to 3·6) 198 (127 to 332) –16·5% (–39·5 to 18·7) Tanzania 23 (16 to 40) 11·4% (–12·3 to 43·6) 527 (455 to 615) 4·0% (0·7 to 7·4) 1170 (858 to 1765) –3·4% (–28·3 to 28·0) Uganda 11 (8 to 21) 17·3% (–43·2 to 112·1) 342 (294 to 407) 5·9% (2·4 to 9·3) 628 (443 to 1040) 6·8% (–48·6 to 78·1) Zambia 10 (7 to 14) 54·2% (3·8 to 123·4) 162 (140 to 190) 3·3% (–0·1 to 7·0) 465 (318 to 666) 15·0% (–23·2 to 70·1) Central sub-Saharan Africa 40 (29 to 65) –0·5% (–16·0 to 19·5) 1086 (943 to 1273) 0·8% (–1·3 to 2·9) 2007 (1483 to 2934) –8·8% (–28·2 to 17·1) Angola 9 (6 to 16) 18·6% (–22·7 to 81·6) 263 (228 to 308) 5·0% (1·8 to 8·4) 497 (339 to 788) 9·3% (–24·8 to 69·3) Central African Republic 2 (2 to 4) 5·3% (–20·1 to 36·6) 44 (38 to 52) –0·6% (–3·9 to 2·7) 103 (67 to 159) –0·2% (–25·6 to 32·0) Congo (Brazzaville) 3 (2 to 4) –9·9% (–37·5 to 20·3) 48 (41 to 55) 3·2% (–0·1 to 6·9) 115 (80 to 161) –11·6% (–38·5 to 16·6) Democratic Republic of the Congo 24 (16 to 43) –4·5% (–23·2 to 14·4) 702 (606 to 823) –1·1% (–4·2 to 1·7) 1222 (826 to 1861) –14·5% (–36·8 to 13·5) Equatorial Guinea 0 (0 to 1) 0·3% (–43·4 to 75·5) 9 (8 to 11) 24·6% (19·9 to 29·5) 20 (13 to 31) –14·9% (–51·6 to 58·0) Gabon 1 (1 to 2) 10·1% (–22·4 to 51·3) 21 (18 to 24) 2·0% (–1·5 to 5·7) 50 (37 to 66) 3·4% (–27·8 to 41·2)
95% uncertainty intervals are in parentheses. DALYs=disability-adjusted life-years. SDI=Socio-demographic Index.
was in western sub-Saharan Africa (0·36, 0·31 to 0·41),
followed by southern sub-Saharan Africa (0·37; 0·32
to 0·43), central Asia (0·39; 0·34 to 0·44), central
Saharan Africa (0·39; 0·33 to 0·44), and eastern
sub-Saharan Africa (0·39; 0·34 to 0·45). Prevalence was
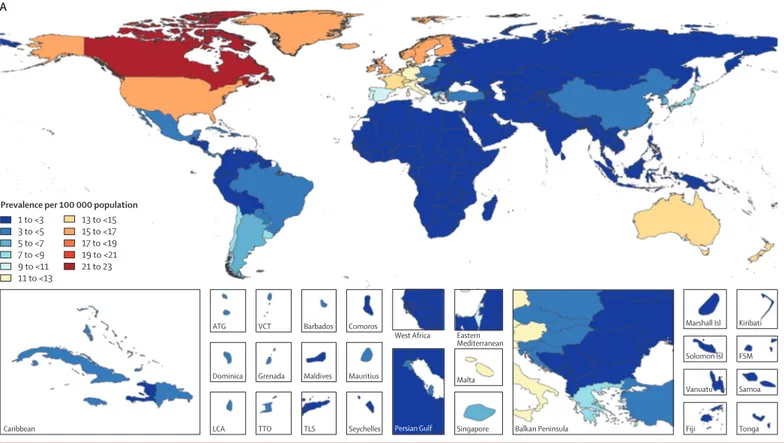
higher in males than females at all ages (figure 2), with
the peak of prevalence for males at age 85–89 years, and
for females at age 80–84 years. The male to female ratio
of age-standardised prevalence was 1·22 (1·19 to 1·24)
in 1990 and 1·25 (1·23 to 1·28) in 2016.
The YLL rate curve peaked in the group aged 0–1 year
and again in the group aged 70–74 years (figure 3). YLD
rates showed a steady increase to a plateau at age
80–84 years (figure 3). The YLD rates were much lower
than the YLL rates, reflecting the high case fatality of
motor neuron disease.
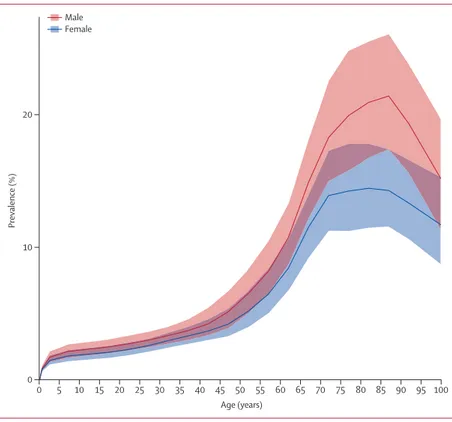
The expected age-standardised DALY rates increas ed
with SDI (figure 4), from about five per 100 000 population
in countries with a very low SDI to about 30 per
100 000 population in countries with a high SDI. The
change in DALYs as SDI increased
was greatest at high
SDIs. The rates in high-income North America, western
Europe, and Australasia were higher than expected
based on their SDI levels. By contrast, the
age-standardised DALY rates in the high-income Asia Pacific
region were lower than expected based on its SDI. None
of the 84 risk factors analysed in GBD 2016 were shown
to have sufficient evidence of association with motor
neuron disease incidence or deaths.
Discussion
More than half of global deaths and close to half of all
prevalent cases of motor neuron diseases occurred in
three high-income regions: North America, western
Europe, and Australasia. Motor neuron disease cases
and deaths were far fewer in other parts of the world.
Globally, from 1990 to 2016, the all-age prevalence
increased more than the age-standardised prevalence,
indicating that the largest part of the global prevalence
increase was due to ageing.
The geographical differences in age-standardised
incidences might be partly due to more accurate case
ascertainment and diagnosis of motor neuron disease
in high SDI countries compared with countries with
low and middle SDIs. For example, a significant
geographical difference in motor neuron disease
prevalence was observed in the USA and western Europe
between regions with different levels of quality of access
to health-care systems.
10However, high SDI countries in
the Asia Pacific region, where an accurate diagnosis of
motor neuron disease is more probable than in low SDI
countries,
had a lower incidence than high SDI
A
Persian Gulf Caribbean LCA Dominica ATG TTO Grenada VCT TLS Maldives Barbados Seychelles Mauritius ComorosWest Africa Eastern
Mediterranean
Malta
Singapore Balkan Peninsula Tonga
Samoa FSM Fiji Solomon Isl Marshall Isl Vanuatu Kiribati 1 to <3 3 to <5 5 to <7 7 to <9 9 to <11 11 to <13 13 to <15 15 to <17 17 to <19 19 to <21 21 to 23
Prevalence per 100 000 population
Figure 1: Age-standardised prevalence of motor neuron disease per 100 000 population by location for both sexes, 2016
countries in western Europe and North America. This
geographical heterogeneity suggests that the differences
in the prevalence and incidence of motor neuron disease
might be due to ethnicities and ancestries, and that the
apparent relation ship with SDI might be spurious. In a
2017 study in which subcontinents were considered
as surrogates of ancestries, a higher prevalence of
amyotrophic lateral sclerosis was reported in Europe,
the USA, and New Zealand than in east Asia.
8The increase in age-standardised incidence of motor
neuron diseases in the high SDI regions during the study
period might, in part, be due to improved diagnosis,
whereas the increase in age-standardised prevalence is
probably due to improved survival. In particular,
non-invasive ventilation can prolong survival
21and has been
increasingly included in the usual practice of
multi-disciplinary motor neuron disease centres. The
im-provement of quality and reduction of time to certainty
of amyotrophic lateral sclerosis diagnosis might also
appear to increase the duration of disease.
22Additional
contributing factors could include an increase in the
public awareness of amyotrophic lateral sclerosis
(in-cluding that generated by major clinical trials launch ed
since the early 1990s in Europe and the USA), and
increased awareness that progressive weakness is not a
normal part of ageing.
We found that the prevalence of motor neuron disease
increases particularly after age 50 years, with a peak at
around age 85 years, followed by a rapid decline in
males, while in females the curve is flat between age
70 and 85 years, followed by a decline (figure 2). The
rapid decline in the oldest age group (ie, ≥85 years)
could be due to poor ascertainment because of more
complex clinical features or comorbidities, competing
mortality from other causes (eg, cardiovascular disease,
dementia), or both. Older people are less frequently
referred to tertiary neurological care
11and are less likely
to get a correct diagnosis than are younger patients.
Another factor that might play a part in the observed
decline in the prevalence of motor neuron disease in the
older population relates to different clinical expression
of the disease, with a greater case fatality in this age
group (eg, more frequent bulbar motor neuron disease
cases).
11,23Our findings suggest that the prevalence of motor
neuron disease is consistently higher in males than
females across all age groups, with no changes in the
male to female ratio between 1990 and 2016. The ratio is
similar to that in studies from European registries,
although in those studies incidence of amyotrophic
lateral sclerosis in females increased over time.
10The
reported change in sex ratio of amyotrophic lateral
sclerosis in the earlier study
11has been attributed to
changes of exposure for females to possible
environ-mental factors, such as smoking. In GBD, however, the
evidence for an association of smoking with all motor
neuron disease was considered insufficient.
210 5 10 15 20 25 30 35 40 45 50 55 60 65 70 75 80 85 90 95 100 0 10 20 Prevalence (%) Age (years) Male Female
Figure 2: Global prevalence of motor neuron diseases by age and sex, 2016
Prevalence is expressed as the percentage of the population that is affected by the disease. Shaded areas show 95% uncertainty intervals. Values are plotted at the midpoint of 5-year age categories.
0 5 10 15 20 25 30 35 40 45 50 55 60 65 70 75 80 85 90 95 100 0
20 40
YLL and
YLD rate (per 100
000 population)
Age (years) YLDs
YLLs
Figure 3: Global years lived with disability (YLDs) and years of life lost (YLLs) rates per 100 000 population due to motor neuron diseases by age, 2016
Previously reported prevalence per 100 000 population
for amyotrophic lateral sclerosis (5·40 in Europe,
3·40 in the USA, and 2·34 in Asia)
7are lower than the
GBD 2016 estimates of overall motor neuron disease
prevalence per 100 000 population (10·00 in Europe,
19·37 in the USA, and 3·13 in Asia), as expected,
because
we included additional motor neuron diseases.
This study explored motor neuron diseases in all age
groups. About 14% of cases were younger than age
20 years, an approximate estimate of the genetic forms
with early clinical onset. The inclusion of spinal
muscular atrophy, including all its clinical and genetic
phenotypes, has had an effect on DALYs, with the
presence of a peak in the first year of life in addition to
the second peak in people aged 70 years and older due to
amyotrophic lateral sclerosis. However, the inclusion of
spinal muscular atrophy and other motor neuron
diseases of early life has not produced a substantial
change in the age prevalence curve compared with
studies including only amyotrophic lateral sclerosis.
Incidence and prevalence of motor neuron disease in
early childhood (ie, spinal muscular atrophy and
hereditary spastic paraplegia) seems to be lower in
GBD 2016 estimates than previous estimates. For
example, a prevalence of approximately one to two
per 100
000 population and incidence of one in
10 000 livebirths per year have been estimated with
spinal muscular atrophy type I (60% of cases).
24A
previous report in England, Finland, Norway, and
Hungary estimated a birth incidence of spinal muscular
atrophy of ten per 100 000 livebirths.
25A larger survey,
17done in 2015, which took data from 27 population-based
studies from Europe, Middle East, North America, Asia,
South America, Africa, and Australia, reported a similar
range, from 5·1 to 16·6 cases per 100 000 livebirths. We
found an incidence of 1·9 per 100 000 person-years in
the group aged 28 days to 1 year, indicating a relevant
risk and burden in the first year of life (see the
GBD 2016 online results tool). Age-specific incidence
in this age group
varied notably among locations:
from 0·9 (sub-Saharan Africa) to 13·1 (Australia) per
100 000 person-years. The prevalence of spinal muscular
atrophy is established, as for other genetic diseases of
early years of life, by several factors, including family
size of the proband, the availability of genetic
counselling, prenatal diagnosis with genetic testing,
and access to and willingness to have pregnancy
termination. Additionally, spinal muscular atrophy
frequency seems higher in white populations compared
with other ethnic groups, similar to amyotrophic lateral
sclerosis.
26,27Several limitations of the study should be considered.
First, given the diagnostic challenges of motor neuron
diseases, some categories of motor neuron disease are
probably still underdiagnosed, especially in older people
and ethnic
minority groups.
28Although the criteria for
amyotrophic lateral sclerosis
diagnosis in adults
changed several times over the study period,
29we did
not detect a systematic bias between data based on
El Escorial criteria and data based on alternative case
definitions. Second, data are scarce from large parts of
the world, including sub-Saharan Africa, most of
Latin America, eastern Europe, and south and central
Asia. Despite the fact that the Asian population
constitutes more than 50% of the world population, few
epidemiological studies of motor neuron diseases
have been done outside Europe and North America.
30The data indicate a difference in the prevalence and
incidence of motor neuron disease, with lower estimates
in Asia, Latin America, and Africa, as compared with
the rest of the world. This difference might, at least in
part, reflect missed diagnosis because of the absence of
appropriate diagnostic instru
ments. Third, mortality
rate estimations were based on data classified using
ICD-9 and ICD-10. Although both versions of the ICD
are highly congruent in the field of motor neuron
disease, we cannot exclude an influence of the
classification evolution, even if unlikely. As prevalence
is related to incidence and disease duration, we
should consider that variation in prognosis between
geographical area, especially due to variation in care,
might explain part of the prevalence variation. For
example, trache ostomy is done in about 30% of Japanese
Global
High-income Asia Pacific High-income North America Western Europe Australasia Andean Latin America Tropical Latin America Central Latin America Southern Latin America Caribbean Central Europe Eastern Europe Central Asia
North Africa and Middle East South Asia
Southeast Asia East Asia Oceania
Western sub-Saharan Africa Eastern sub-Saharan Africa Central sub-Saharan Africa Southern sub-Saharan Africa
0 0·25 0·50 0·75 0 10 20 30 40 50 Age-standardised DA LY rate (per 100 000 population) Socio-demographic Index
Figure 4: Age-standardised disability-adjusted-life-year (DALY) rates for motor neuron diseases by 21 Global Burden of Disease regions by Socio-demographic Index (SDI), 1990–2016
The black line represents expected values based on SDI from a regression of all location data over the entire 1990 to 2016 estimation period.