Assessment of Long Run Impact of a Growth Pole in Melfi, Basilicata, Italy. GUSTAV SCHACHTER CENTER FOR EUROPEAN ECONOMIC STUDIES NORTHEASTERN UNIVERSITY Room 301 Lake, BOSTON MA O2115 USA
TEL: 617 373 2886 FAX 617 373 3640 EMAIL:
[email protected]And
CARMELINA BEVILAQUA University of Reggio Calabria Reggio Calabria, Italy Tel 39 89 239801 [email protected] AbstractIn this paper we estimate the long run regional impact of the establishment of a large industrial estate in Melfi, in the region of Basilicata, the most underdeveloped area of southern Italy. In a previos paper (AISRe Piacenza 1999) we asessed the short run impact of establishing a large industrial complex in a underdeveloped area. Using input output techniques the paper reported the results of a simulation for the construction period. In this paper we attempt to assess the long run impact of the investments outlays between 1980 and 1995 for the period 1985-1998 on the region of Basilicata.
Half a century ago Francois Perroux among others advanced the idea of growth poles to prime economic development. Soon after Albert O. Hirshman advanced the concept of unbalanced growth. Gustav Schachter has empirically analyzed some outcome in the Italian Mezzogiorno using input-output techmiques in 1968 and again at the I-O Meetings in New Yrok in 1998.
The characteristics of a growth pole as represented by the Melfi industrial estate is that resources are spatially concentrated and private entrepreneurs internalize externalities provided by: (1) the public sector infrastructure and incentives, and (2) linkages derived from spatial concentration of productive activities. The validity of a growth pole can be verified by identifying the spatial spread effect of activities within the pole to the surrounding region.
Here we follow the same methodology as we presented in a paper at the Intenational Input-Output meetings in New York in 1998. We use input output techniques to verify the impact on output and employment of the investments taking place in the estate in the long run. Since most of the capital goods are supplied from outside the area , we do not find a large impact in the short run besides the multiplier effects of the construction industry. Theoretically, in the long run, the impact may be more substantial because of the creation of new permanent jobs. While our simulated scenario for 1985-1998 shows a 12% non-agricultural employment growth , the reality is that in this
sector emplyment declined by 12%. It appears that the expected externalities derived from growth poles were just not there because of weak linkages.
Key words: Italian Mezzogiorno
Growth poles Externalities
Input-output technique Economic Development
Unbalanced growth Linkages
1. Introduction
Since 1950 Italian development policies for the South were characterized by a central process of economic and financial aid under an umbrella of “extraordinary intervention” (intervento straordinario). One policy instrument used to attain this goal was the creation of industrial poles located in strategic areas of the South. The administration of the poles was assigned to a public body in the form of Consortia which have the task to menage the pole and assign fiscal and financial aid. The organization instrument is a territorial plan that specifies public backing and financing for the needed infrastructure.
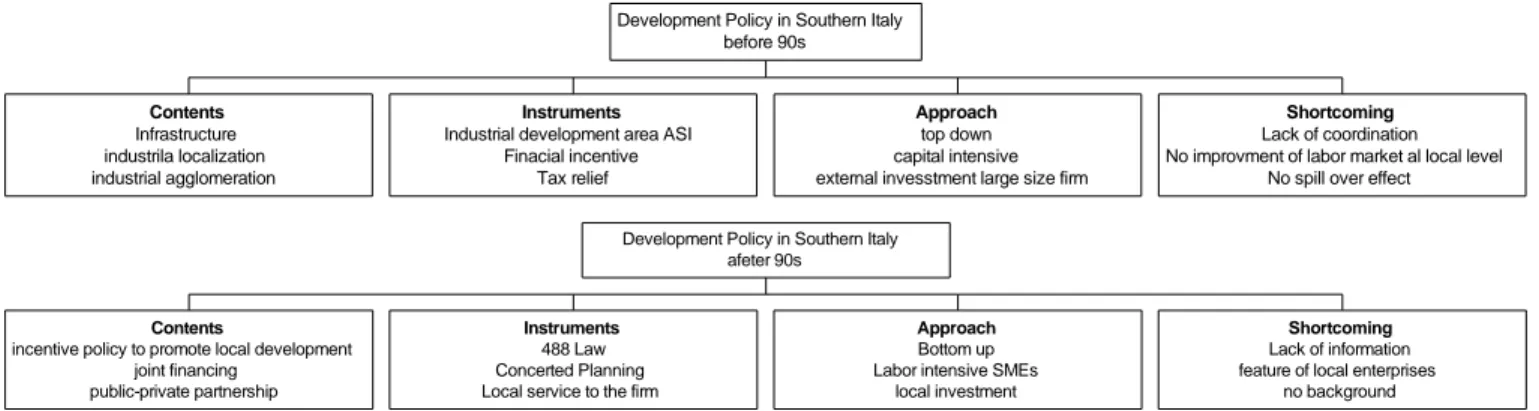
Initially, interest in investing in growth poles originated with big companies both internally from northern Italy and from abroad. However, many companies located in these growth poles had a very short life span lasting only through the incentives period; in addition no substantial spill over effect took place. By late 1980’s and early 1990’s the “extraordinary intervention” was transformed a few times to find more efficient ways to accelerate economic development in the South.
The financial aid increased steadily for forty years but started diminishing between 1989 and 1994 (see Figure 1). The new industrial policy is based on the 488 Law formulated in 1992 and implemented in 1996. Law 488 is addressed to Italian regions grouped by objectives, according with the European Union scheme. The European Union’s regional objectives included in the Law are 1, 2 and 5b. The percentage of financial aid differs among regions located in different objective areas, from 65% (EU objective 1) to 20% (EU objective 5b). The law establishes subsidies to those firms, which can provide substantial investment. Generally these firms seek lower net subsidy with high-expected productivity. Law 488 aims to obtain better results when supported
by local initiative induced by widespread information and services. In this context a new tool of development policy has been formulated, it is called Concerted Planning (programmazione negoziata).
Concerted Planning has been operative since 1993. It consists of the following policy instruments
Institutional Program Agreement (accordi istituzionali di programma). The objective is to formulate a strategic planning at the regional level. The Region offers mutual collaboration to single municipalities or groups of them to identify financial resources and to define administrative measures to reach the planned outcomes.
Planning Contracts (contratti di programma). The objective is to draw up agreements between the public administration and private firms to promote economic activity at the local level.
Area Contracts (contratti d’area). The objective is to define an operative agreement between the public administration and industrial entrepreneurs to implement measures apt to accelerate development (new localization and new employment). Generally, these kinds of agreed actions are supposed to be carried out either in regions with a high unemployment rate, or in areas with declining industries, that is, in areas covered by the European Union objective 1 such as Basilicata.
Territorial Pacts (Patti territoriali). The objective is to promote local development through an agreement between local public administration, social partners and private bodies apt to carry out development programs.
2. The FIAT Initiative
FIAT Auto is a large Italian company known at the national and the international levels. The company has chosen an industrial development area in Basilicata region to locate a new plant according to the innovative concepts of cooperation between the public and private sectors, namely the area contracts. The initiative is being subsidized (23% on the total investment) according to the agreement drawn up with the Industrial Consortium of Potenza. The industrial consortium is a public body defined by legislation in force since the 1950s. Its scope is to manage and organize the industrial development, making the territory attractive for private would be investors.
In this context one of the most difficult objectives has been the creation of an industrial network for industrial development areas in the South. The definition and location of industrial development areas (ASI, area di sviluppo industriale) is another task of the Consortium. Figure 3 shows the percentage of industrial development areas. The introduction of a mono functional area in the Southern territory has caused a development gap between the urban context and the industrial complex. The reason may be the absence of planning action, which would have coordinated the economic and the urban issues.
At first glance the FIAT initiative seems to follow the same directions of the extraordinary intervention. The plant occupies almost one thousand hectares of the entire industrial are of Potenza; this consists of eight industrial nuclei, among them the town of Melfi where the plant is located. Therefore the plant size seems to follow old development policies. The innovation should be in the production model that would make the plant much more integrated with the local productive system.
The FIAT investment impact has been analyzed according to two private and public contributions. The public and private changes in output represent the production increases due to Fiat and state investments. It is easy to foresee deep changes in
Basilicata’s territorial system to respond to the productive needs of the FIAT installation. The opening of the region to the Rest of Italy is through the service sector, as well through basic industrial supplies. However, the greatest effect remains limited to local production.
The Fiat’s installation in Melfi’s area represents, undeniably, a strong impulse for change, not only for the economic structure but also for Basilicata’s territorial provincial and regional organization. The increase in production in some economic sectors, and the effect of the allocation of new resources primes a ”modernization” process of the productive regional network. This modernization process concerns, of course, new development forms, more directed to the local one, and new technologies answering to the dictates of environment supportability. In the year 1996-1997 in fact, Melfi San Nicola’s area, limited particularly to the FIAT installation, has been considered as sample area for self-monitoring and getting the optimum of the nets concerning the environmental clearance strategies and impact valuation (Cuomo et all 1996).
A problem that underlined by FIAT operators and by local administrations is that of adequate residence, especially to reduce commuting time to and from work. The scarce availability of residential areas near the installation raised questions of opportunity cost and the necessary resources needed for its realization. On the contrary, the realization of a linear city connected to the urban centers is a better answer to the innovative criteria that is connected with the location of industrial centers.
The policy decision of the linear city, contrary to the realization of a satellite city near the plant, indicates a tendency towards evolution of development policies in the form of coordination between urban planing and economic programs, often eluded in previous initiatives of regional development. In this context, the need to increase the receptive capacity of the urban system in relation to the physical rotor and economic product from FIAT should be given greater attention. That is, one needs to solve infrastructure problems that have always put Basilicata in a forced isolation. The new orientation of urban geography considers the network the development element of the
territorial systems, overcoming the official relations that characterized cities in the 50’s and 60’s. We could conclude that public investment in infrastructure could help the introduction of FIAT in Basilicata’s economy, but at the same time would operate as flywheel in regional development, with repercussions also in other southern regions.
3. The Territorial Context
The region of Basilicata consists of two provinces, Potenza and Matera. Historically, the region has been considered, together with Calabria, the most depressed area in the South. There are, in particular, two reasons. The region has a peculiar geographic position: surrounded by Campania, Puglia and Calabria with a coastal area of a few kilometers at the Tyrenian sea. The second reason is that the region lacks infrastructure due to the difficult land morphology. In part, these elements made the region isolated and backward with respect the other southern regions.
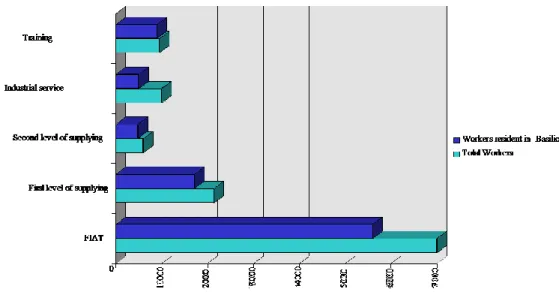
In the early ‘1990s the region witnessed an increase in economic activity and an opportunity to come out of isolation. This coincides with the opening of a FIAT plant at Melfi (Potenza). It employs seven thousand workers, of whom 700, are white collars, 1800 skilled and 4500 unskilled workers. About eighty percent of employment originates within the province. The needed local supplies for the plant created additional estimated 1500 jobs. There are three supply levels: the first, called wall side supply, consists of firms where production is completely devoted to the FIAT plant; the second level supplies FIAT with more than half of its production; the third level, called industrial service supply, consists of the services needed with reference to the plant. Figure 4 shows the employment creation at different levels of supply.
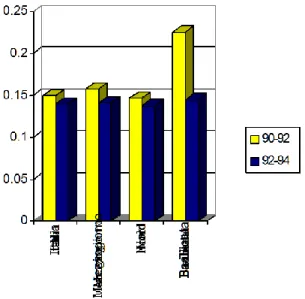
Macroeconomic variables, such as GDP, productivity and the unemployment rate, still offer a dismal picture. The productivity indicator for the region is not only far below the North, but also, with respect to the South. (Fig.5). Nevertheless, the region has performed well from 1990 to 1994 with a growth rate even higher than the North (Fig. 6). The industrial structure is based on a weak economic base. By contrast the traditional
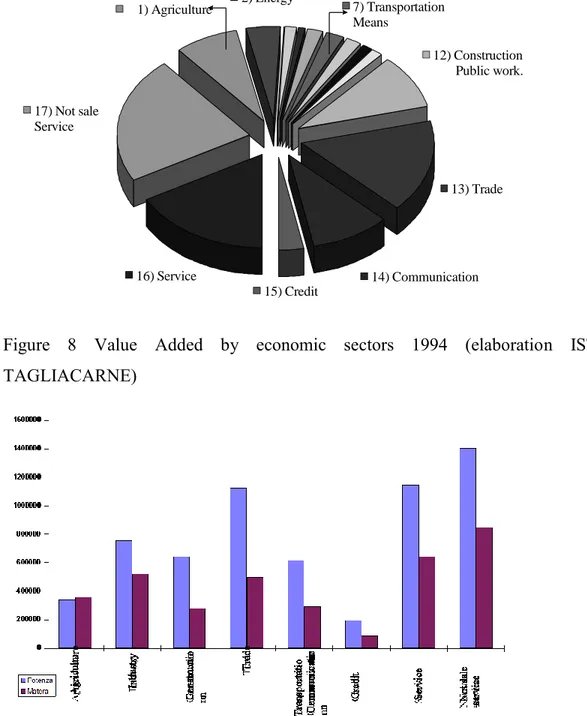
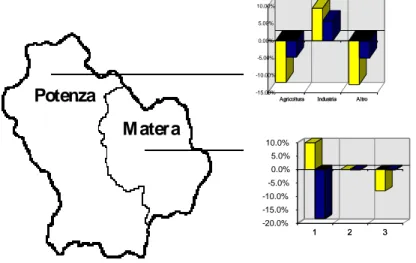
sectors, such as public administration and small trade, are strong. (Fig. 7).Also, the two provinces are at a different level of development, favoring Potenza versus Matera (Figs. 8 and 9).
As expected, sectoral employment changed by the middle nineties due to the FIAT installation, with a substantial increase in the transportation sector (Fig. 10), even though, in absolute terms, the economic sector with higher levels of employment are still public administration and small trade. The employment variation among the two provinces shows different behavior (Fig. 11). The employment increase in Potenza derives not only from the FIAT installation, but also from a structure better adopted for industrial development and innovation. The labor market may receive from the FIAT installation a propulsive change because of the plant’s needs. A process of training and increased mobility may guarantee the local propulsive development. Of course, the creation of local enterprises depends also upon local demand and the new industrial mode even though because of productivity differences, public subsidies will have to continue in the undetermined future.
The labor supply is weak in terms of skills. Latest published data (CENSIS 1989) show a low educational level for the region with respect the rest of Italy and the South. There is a high dropout rate (64%) and little willingness to participate in training programs. Within this scope, the region, in agreement with FIAT, defined training programs to satisfy some of FIAT’s needs and also for potential new enterprises.
4. Impact Evaluation
As mentioned above, Basilicata is one of the poorest regions in southern Italy. It is generally believed that public intervention at whatever level of implementation would improve the current situation. The objective is to derive long term lasting effects on the locality and the region’s income and employment. Thus the FIAT investment venture has
to be evaluated not only in the short term when the area is affected by the construction process, but for the long run when FIAT is using its productive capacity at its fullest
The methodological approach for this kind of evaluation is based on Input-Output techniques. The I/O model allows the analysis of the interrelations and their degree of linkages within the productive system to assess the effects of the investment as a generator of structural change. The administrative level chosen for the evaluation is the region. The aim is to point out how the FIAT investment venture affects the economic structure of the region. The impact evaluation seeks to determine not only the investment effect on the local productive structure, but also on the entire nation.
We rely on input output tables for 1992 and 1994 constructed by us for this purpose. To evaluate the impact of investments within the region and for the rest of Italy we use a multiregional input-output system. This system consists of four 17x17 interconnected matrices: the Basilicata, the rest of Italy, a diagonal matrix of flows from the Rest of Italy to Basilicata, and another diagonal matrix of flows from Basilicata to the Rest of Italy. We base our analysis on an input output tale of 1992. Yet investments outlays took place many years before. Therefore we can verify investments of FIAT and other private and public entities for the 15-year period and assess the situation at the end of 1994. The impact evaluation concerns, indeed, the regional economic structure change in 1994 due to investments over 15 years.
5. The Model
The project design distinguishes between the short run construction period and the long run operational period. Over the short run, it estimates the requirement of output and employment needed to supply inputs for capital goods demanded. That is, during the construction period, certain levels of output and employment are connected with gross investment outlays. In the long run, productive capacity is affected by additional investment and additional permanent jobs are created in the industries where investment takes place and in those sectors that supply inputs to the affected industries.
The exogenous variables are investment by sector. Forecasting investment is risky because of uncertainties connected with technological change, tastes, and international markets. Replacement investment is autonomous in terms of output and is related to the available stock and capital-output ratios needed to maintain the productive system at its status quo level. Induced investment is responsive to expected output, availability of loanable funds, cost of capital funds, and previous investment. For the short run, we used investments in the construction period by sector of origin since the output and employment are impacted in the capital goods production. For the long run, we use investments by destination that will impact output and employment in relation to the productivity of labor and capital.
THE SHORT RUN OUTPUT FORECASTING MODEL
The short run model to assess the impact of output changes is specified as follows: X I t t t 1 t (I A )
(1) Where:Xt = Output impact of change in investment expenditures at time t; It = change in investment expenditures at time t;
= Block diagonal bridge matrix to transform investment expenditures from type of purchases to investment by sector of origin.
For the short run the demand vector; Y, is composed of private and public
investment, I, in Basilicata. Note that here only additional investment for constructions period, I is considered. Investment is reported and/or forecasted by sector of destination, that is, according to the sector, which will utilize this investment. Since the model is demand-oriented, investment by sector of destination is transformed into investment by sector of origin with the help of a block diagonal bridge matrix .
The inverse, (I A)1 is the result of a TRIO that aggregates the MRIO (Multiregional Input-Output) at twenty regions into Basilicata (S) and the Rest of Italy (N). The latest MRIO was constructed at forty four branches for the year
1985 and was completed in the year 1990 (Schachter, 1991) based on the national input-output table at ninety-two branches for 1985 completed in 1990 (ISTAT, 1990c) and the 1988 national table at 44 branches (ISTAT 1993) The TRIO used here is at 17 sectors and is specified in equations (2)-(11) based a reconstructed TRIO for 1992 (Bevilacqua, Hellman and Schachter 1999). Equilibrium conditions are: Xi X T Y N
ij NN ij NS i N j j i = 1,..17 (2) XiS
X
T Y ij SS ij SN i S j j i = 1,..17 (3)Equation 2 and 3 define a table of four interconnected submatrices, two for the domestic flows (X) and two for the interregional flows (T). The direct requirements are specified for internal flows in terms of the technical coefficients aij: a X X ij NN ij NN j N i = 1,...,n (4a) a X X ij SS ij SS j S i = 1,...,n (4b)
The interregional flows are specified in terms of the interregional coefficients:
t T X ij NS ij NS j S i = 1,...,n (5a) t T X ij SN ij SN j N i = 1,...,n (5b)
The payments to factors vj are given by the share of total sectoral resources:
v V X j N j N j N i = 1,...,n (6a)
v V X j S j S j S i = 1,...,n (6b)
The imports are specified as a the share of total sectoral resources too:
m M X j N j N j N i = 1,...,n (7a) m M X j S j S j S i = 1,...,n (7b)
Therefore the equilibrium conditions require:
aijNN t v m j ijNS Nj Nj j
1 i = 1,...,n (8a) aijSS t v m j ij SN j S j S j
1 i = 1,...,n (8b)Finally we recall that the final demand is defined as:
YN CN IN GN SS(EN MN) (9a) YS CS IS GSSS (ESMS) (9b) where for the Rest of Italy:
YN = Vector of Final Demand ; CN = Vector of Fixed Investment ;
GN = Vector of Public Expenditure;
SN = Vector of Inventories Change ; EN = Vector of Export ;
MN = Vector of Imports ;
Similar definitions hold for Basilicata
The type of bi-regional model used here does not distinguish between internal and interregional coefficients and can be written as:
Xi a X Y N ij N ij N ij N j
i = 1,...,n (10a) XiS a X Y ij S ij S ij S j
i = 1,...,n (10b)where:
aijN aijNNtijSN
i = 1,...,n (11a)
aijS aijSStijNS
i = 1,...,n (11b)
or in standard matrix notation:
X = X A + Y (12)
where X (XN
|XS) , Y (YN| YS) and A is the matrix of the intra- and interregional coefficients. Our first objective is to estimate the impact on the sectoral output in Basilicata (XS
) and in the Rest of Italy(XN
) for a change in demand in the Basilicata (YS
). Solving (12) gives the desired result. For our empirical work YN
= 0, therefor YS
is the only exogenous variable, representing private and public investment, I.
For the short run, sectoral investment in Basilicata, IS
, creates a demand for capital goods by sector or destination, Id, to be supplied by various sectors. Thus, for the short run the final demand, Y, reflects the derived demand associated with changes investment .
THE LONG RUN OUTPUT FORECASTING MODEL
Over the long run, there is a close relationship between sectoral
investment outlays and changes in output or capacity. If we assume that change in output (economic growth), g, is a function of the amount of investment and its
productivity or the marginal capital output ratio , then:
g I
(13)
Therefore, we hypothesize that:
ZIS
ItS 1
t1 n
Where Z may be considered an investment which impacts capacity.
The accumulated investment over the period will affect the sectoral capacity requirement according to the sectoral capital productivity ratio, . The resulting additional sectoral output requirement, equivalent to the increase in capacity is an additional "demand" on the economy. Therefore, ZS
becomes part of YS
and, using the (I a)1 inverse, we estimate the ensuing sectoral impact.
XI YI S
(I a)1 (15a)
or, from (15a):
XI IdS
t 1 n
(I a)1 (15b)EMPLOYMENT FORECAST MODEL
Once the forecasted sectoral output is estimated, additional labor input requirements are forecasted as a linear relationship with output. However, additional labor input requirements may be satisfied either by an increase in employment or by an increase in labor productivity. So, to assess the net employment requirement we must forecast a cumulative productivity adjustment
(1 ) for each sector in each region over the period between 1988 and 2003
where is the forecasted accumulated productivity change.
Li ,t kiXi,t(1 i) t
t
i = 1,...,n (16) where:Li = change in sectoral labor input requirement; ki Li
Xi = sectoral labor/output ratio in 1985, specified for the Rest of Italy as ki
N
and similarly for Basilicata. To pass from sectoral employment requirements to occupational requirements we adopt the following matrix notation:
Lt Xtk(1 ) t
t
(17) where Lt (Lt N | Lt S), k is the diagonal matrix of the labor output ratio and the
diagonal matrix of the labor productivity change.
6. Results
The impact analysis produced some expected and prima facia strange results. The total 30,813 billion lire (US$ 15 billion) private and public investments outlays from 1980 to 1994 should have added 2,999 billion lire (US$ 1.5 billion) extra production in Basilicata and 839 billion lire (US$ 500 million) in the Rest of Italy . Basilicata ‘s economy moved the same way as the nation. At current prices it doubled its production at a higher cost since labor productivity is much lower. The average marginal capital output ratio is about 7.5. and labor productivity is about 70 per cent that of the nation’s (see Table 5). True enough, FIAT made a difference but only marginally so. M Fifty percent of investments were channeled in private and public services. Seventeen percent in agriculture and only seven percent in durable goods (including chemical) manufacturing industries. The investment in manufacturing is still at a higher rate than in previous decades and could increase productivity.
The labor market changes are due to changes in the structure of the economy. Table 18 shows some interesting characteristics over a short 14 year (1985-1998) period. Agricultural employment decreased by a half but the slack was not taken by non-agricultural employment , this decreased by twenty per cent. While the population remained stable at some 600 thousand, labor force participation decreased from 41 per cent to 35 percent , the lowest participation rate in Italy. No wonder, the unemployment rates increased from 14 to 18 percent over the period.
While there has been a construction short run impact on output and labor, the long run permanent impact is much lower that the expectations mostly
because little was done for integrating the area in terms of planning residential location and transportation in the area. Our model shows that with a economic structure of 1988, as translated in our 1992 input-output table, the 30 thousand billion lire over 15 years would create 27 thousand new jobs of which 9 thousand in agriculture. The reality agricultural sector shed 30 thousand jobs over this period and non-agricultural employment declined by 20 thousand.
This does not mean that the growth pole created by and around FIAT is at fault – just that results from a key industry with parts supplied mostly from other parts of the country cannot have a large spread effect if not accompanied by expected policies to create externalities that can be internalized by the growth pole. These externalities consist of infrastructure provided by the public sector and encouragement to complementary business to settle at the location A static model of the type used here cannot capture all the aspects of a fast changing structure of the economy. It can however show what could be the results in a well-managed growth pole.
Appendix A
Figure 1: Public expenditures in the Southern Italy (Billions of lire)
Figure 2: Development policy evolution
Contents Infrastructure industrila localization industrial agglomeration
Instruments Industrial development area ASI
Finacial incentive Tax relief
Approach top down capital intensive external invesstment large size firm
Shortcoming Lack of coordination No improvment of labor market al local level
No spill over effect Development Policy in Southern Italy
before 90s
Contents
incentive policy to promote local development joint financing
public-private partnership
Instruments
488 Law Concerted Planning Local service to the firm
Approach
Bottom up Labor intensive SMEs
local investment
Shortcoming
Lack of information feature of local enterprises
no background Development Policy in Southern Italy
afeter 90s
Figure 4: Creation of employment
Figure 5: Productivity (thousand lire per worker)
1985 1990 1992 1994
Italy 35,824 56,186 64,563 73,600
South 29,830 46,946 54,346 62,028
North 38,399 60,122 68,932 78,429
Figure 7: GDP Composition (elaboration of ISTAT data)
1) Agriculture 2) Energy 7) Transportation
Means 12) Construction Public work. 13) Trade 14) Communication 15) Credit 16) Service 17) Not sale Service
Figure 8 Value Added by economic sectors 1994 (elaboration ISTITUTO TAGLIACARNE)
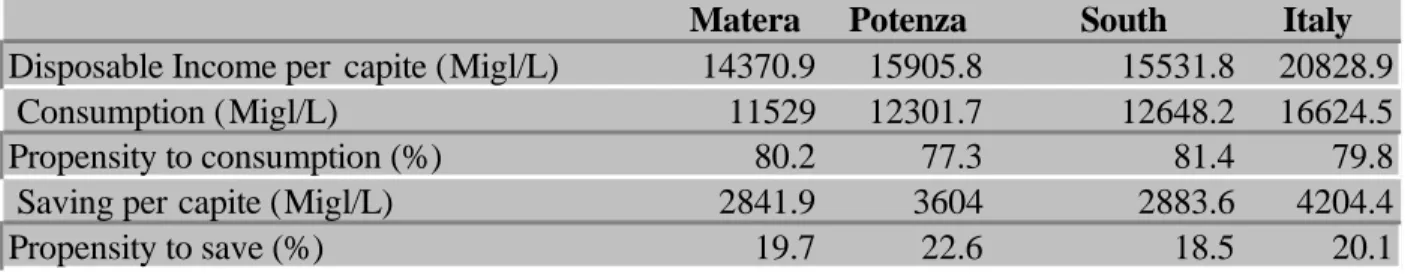
Figure 9 Socioeconomic indicators (1992)
Matera Potenza South Italy
Disposable Income per capite (Migl/L) 14370.9 15905.8 15531.8 20828.9
Consumption (Migl/L) 11529 12301.7 12648.2 16624.5
Propensity to consumption (%) 80.2 77.3 81.4 79.8
Saving per capite (Migl/L) 2841.9 3604 2883.6 4204.4
Propensity to save (%) 19.7 22.6 18.5 20.1
Figure 10: Unit labor variation (1992-1994)
1 2 3 4 5 6 7 8 9 10 11 12 13 14 15 16 17 -100.0% -50.0% 0.0% 50.0% 100.0% 150.0% 200.0% 1 2 3 4 5 6 7 8 9 10 11 12 13 14 15 16 17 1 Agriculture; 2 Energy; 3 Metallic industries
4 Non metallic mineral industries; 5 Chemicals & pharmaceutical 6 Metal products except machinery
7 Auto vehicles and other transportation equipment; 8 Food and beverage;
9 Textile &clothing;
10 Wood, rubber and manufacturing products n.e.c. 11 Paper;
12 Construction; 13 Trade;
14 Transportation and communication; 15 Credit, insurance;
Figure 11: Employment Variation 92-93 94-95
Agricoltura Industria Altro -15.00% -10.00% -5.00% 0.00% 5.00% 10.00%
Agricoltura Industria Altro
1 2 3 -20.0% -15.0% -10.0% -5.0% 0.0% 5.0% 10.0% 1 2 3 Potenza M atera
Figure 12: Transformation of investment from destination to origin
FIAT Public Aid Total FIAT Public Aid Total
1. Agriculture; 0 0 0 2.800 779 3.579
2. Energy; 0 0 0 0 0 0
3. Metal industries 0 0 0 8.443 2.349 10.792
4. Non metallic Mineral Industries; 0 0 0 18.488 5.143 23.631
5. Chemicals & Pharmaceutical 0 0 0 0 0 0
6. Metal Products Except Machinery 0 0 0 797.809 221.936 1.019.744
7. Autovehicles and other transportation equipment; 4.817.000 1.340.000 6.157.000 229.308 63.789 293.098
8. Food and beverage; 0 0 0 0 0 0
9. Textile & Clothing; 0 0 0 2.779 773 3.552
10. Wood, Rubber and Manufacturing products N.E.C.; 0 0 0 0 0 0
11. Paper; 0 0 0 44.838 12.473 57.311
12. Construction; 0 0 0 3.368.199 936.970 4.305.169
13. Trade; 0 0 0 175.451 48.807 224.258
14. Transportation and communication; 0 0 0 36.639 10.192 46.831
15. Credit, insurance; 0 0 0 0 0 0
16. Services; 0 0 0 132.246 36.788 169.034
17. Public Services. 0 0 0 0 0 0
Totale 4.817.000 1.340.000 6.157.000 4.817.000 1.340.000 6.157.000
Destination Origin
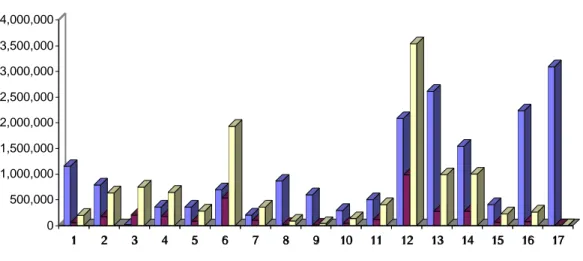
Figure 13 The result of short run evaluation impact at regional level
1 2 3 4 5 6 7 8 9 10 11 12 13 14 15 16 17 0 500,000 1,000,000 1,500,000 2,000,000 2,500,000 3,000,000 3,500,000 4,000,000 1 2 3 4 5 6 7 8 9 10 11 12 13 14 15 16 17 Xj DXj public DXj private
Table 14
Forecasted Labor Productivity, 1985 - 2000
Aggregat ed Groups
MRIO
Sectors Sectors Annual Rate of Growth 1980-1987 Accumulated Compensatory Growth 1985 - 2000
North South North South
1 1,20 Agriculture 0.0426 0.0387 0.0647 0.2325 2 2-6 Energy 0.0210 0.0225 0.8425 0.7553 3 7 Metal Ind. 0.0250 0.0250 0.5517 0.6442 4 8 Non Metal Ind. 0.0200 0.0164 0.6589 0.7236 5 9 Chemicals 0.0590 0.0484 -0.3637 -0.0319 6 10-13 Mechanical 0.0150 0.0114 0.7498 0.8147 7 14-15 Vehicles 0.0330 0.0281 0.3712 0.5460 8 16-19 Food 0.0150 0.0134 0.7487 0.7790 9 21-22 Textiles 0.0180 0.0120 0.6897 0.8041 10 23,25-26 Mfg. n.c.e. 0.0280 0.0185 0.4861 0.6835 11 24 Paper 0.0270 0.0249 0.4941 0.5538 12 27 Construction 0.0017 0.0014 0.9744 0.9788 13 28-30 Trade, etc. 0.0000 0.0000 1.0000 1.0000 14 31-34 Transport. 0.0210 0.0214 0.7575 0.8023 15 35 Credit, Ins. 0.0034 0.0034 0.9478 0.9478 16 36-40 Services 0.0000 0.0000 1.0000 1.0000 17 41-44 Government 0.0000 0.0000 1.0000 1.0000 Table 15
Marginal Capital-Output Ratios (ßi) By Sector
Number Sector 1/ß ß
1 Agriculture 0.1115 9
2 Fossil Fuels 0.0374 27
3 Coke 0.0823 12
4 Petroleum 0.0668 15
5 Electricity, Gas, Water 0.1508 9
6 Nuclear Fuels 0.0662 15
7 Ferrous and Non-Ferrous Minerals 0.0658 15
8 Products from Non-Metallic Minerals 0.1948 5
9 Other Metal Products 0.0159 63
10-13 Mechanical 0.2425 4
16 Meat Products 0.0820 12
17 Dairy Products 0.0870 11
18 Other Food Products 0.0999 10
19 Beverages 0.1707 6
20 Tobacco 0.1740 6
21 Textiles and Clothing 0.1211 8
22 Leather and Leather Products 0.1106 9
23 Wood and Wood Products 0.1750 6
24 Paper 0.0770 13
25 Rubber 0.1804 6
26 Manufactured Products, not classified 0.2519 4
27 Construction 0.0364 27
28 Scrap 0.1575 6
29 Trade 0.1749 6
30 Hotels and Restaurants 0.1244 8
31 Land Transportation 0.0724 14
32 Sea and Air Transportation 0.0380 26
33 Related Transport Activities 0.0393 25
34 Communication 0.0816 12
35 Finance and Insurance 0.2008 5
36-40 Services 0.0321 31
41-45 Government 0.0717 14
Aggregated Groups MRIO Sectors Capital/output ratio 1 8 1,20 2 9 2-6 3 15 7 4 5 8 5 63 9 6 4 10-13 7 7 14-15 8 11 16-19 9 8 21-22 10 6 23,25-26 11 13 24 12 27 27 13 7 28-30 14 14 31-34 15 5 35 16 31 36-40 17 14 41-44
Table 16
Investment Impact on Output 1988 base
Basilicata Rest of Italy Sectors dx (million Lire) dx (million lire)
Agriculture 989810.7 166694.7 1156505.4
Energy 682224.3 138969.2 821193.5
Metal Ind. 49231.8 89010.2 138242.0
Non Metal Ind. 104118.3 23407.9 127526.2
Chemicals 67977.4 69145.8 137123.2 Mechanical 217096.9 84254.6 301351.5 Vehicles 143608.8 4264.3 147873.1 Food 154488.8 32807.2 187296.1 Textiles 37187.8 13813.6 51001.4 Paper 58993.6 29401.4 88395.1 Mfg. n.c.e. 70566.2 24816.5 95382.8 Construction 95733.6 18656.7 114390.3 Trade, etc. 150114.0 102883.6 252997.6 Transport. 331220.6 59806.0 391026.6 Credit, Ins. 131630.4 64532.9 196163.2 Services 337988.7 82556.7 420545.4 Government 367198.2 785.8 367984.1 2999379.4 839112.6 3838491.9
Table 17
Investment Impact on Employment, Basilicata
Based on 1988 structure
Sectors Total Empl. New Empl. %DL
Agriculture 45000 9,022 20%
Energy 2300 1,506 65%
Metal Ind. 100 210 210%
Non Metal Ind. 2200 459 21%
Chemicals 1300 -8 -1% Mechanical 3700 948 26% Vehicles 1000 378 38% Food 3500 489 14% Textiles 2800 139 5% Paper 700 78 11% Mfg. n.c.e. 3000 288 10% Construction 26900 1,211 5% Trade, etc. 33700 1,938 6% Transport. 10000 1,720 17% Credit, Ins. 1800 554 31% Services 21200 3,213 15% Government 45700 5,440 12% Total 204900 27,584 13% Non agricultural Employment 159900 18562 12% 12%
Table 18
Basilicata Labor Market (ooo)
1985 1988 1992 1994 1995 1996 1998 %D 1985/98 Employmen t 214 198 193 178 174 172 172 0.80 agr.l.f. 61 44 35 32 29 27 28 0.46 Non Agr. Emp. 163 154 158 143 145 145 144 0.88 Unemploym ent 36 54 56 35 38 38 39 1.08 Total labor 250 252 249 213 212 210 212 0.85 Unepl Rate 0.14 0.21 0.22 0.16 0.18 0.18 0.18 1.28
work age 186 195 18-Jul 226 227 228 225 1.21
nonwork age
172 168 166 166 163 153 156 0.91
total 358 363 364 392 390 381 381 1.06 population 608 615 613 605 602 591 603 0.99
Source: Elaboration on Confindustria (2000)
Appendix B
DATABASE FOR MODEL IMPLEMENTATION
The TRIO Leontief Inverse This 34x34 matrix (see Figure II) is an aggregation, of the 20-region, 44-sector multi-regional input-output system for 1985 (Schachter, 1991) as applied to the national 1988 table at 44 sectors (ISTAT 1993). The interregional flows have been estimated using location quotient techniques. The destination-origin investment matrices (µ) for Basilicata are based on the national ISTAT (1990d) destination-origin investment matrices.
Employment Vector for 17 sectors , 2 regions for 1992-1998 from ISTAT (1999) and Confindustria (2000).
Projected Employment depends on changes in output per worker across the 17 sectors . We assume that for the manufacturing sectors labor productivity will increase at about the same rate of the 1980's and 1990’s. For Italy as a whole, we used a study completed by NOMISMA (1981). To differentiate between Rest of Italy and Basilicata, we approximated the relationship to the value added per worker of the 1980’s (SVIMEZ, 1991). Estimated annual productivity growth is 2.5% between 1970-1985 and 1.6% for 1980-1985, values which are similar to other sources(PROSPERETTI AND URGA 1989). In our study, the estimated productivity change mirrors the DRI/BLS forecasts (about 50% growth of productivity between 1985 and 2000) for manufacturing but productivity improvement in other sectors is forecasted to be much smaller. Indeed, for trade and services we assumed no growth in productivity. The assumed sectoral labor productivity appears in Table 14.
Formally, the sectoral compensatory productivity cumulative change for Basilicata has been calculated as:
l V /L V /L V /L V /L j S j S j S j I j I j S j S j I j I ( )[( )/( )] [( )/( )] p 1 2000 1985 (18) where: p t (1
X LtI/ Nt)15 (19)Therefore, employment projections for year 2000 are considered as: L**j,2000 lj,2 000 L*j,2000
where L*j,2000 represents the unadjusted sectoral employment requirement
projection and L**j,2000 the productivity adjusted sectoral employment requirement.
Capital-Output Ratio The capital-output ratio vector, ßi, was estimated based on 1980-1987 (ISTAT, 1990) and 1970-1984 (ISTAT, 1986a) value added and investment for the South (as a proxy for Basilicata) and 1960-1985 output and investment for Italy (ISTAT, 1987a) using a two-year lag. Thus, generally:
j t t t t I I X X ( ) ( ) 1 2 3 2 (21)
Table `15 shows the estimated values for IS. Note that manufacturing
has a much higher capital productivity than other sectors. The large ß for construction, transportation and services could be explained by unreported output.
Bibliography
Bevilacqua, Carmelina, Daryl Hellman and Gustav Schachter (1999)
“The Short Run Impact of the Establishment of an Automotive Growth
Pole in Basilicata,” Paper, AISR Meetings Piacenza.
BLS, US. DEPARTMENT OF LABOR, (1988), BLS Bulletin, Bureau of Labor Statistics, "Employment Projections for 1995", Number 2197.
BLS, US DEPARTMENT OF LABOR, (1989), Underlying Data for Indexes of Output
Per Hour, Hourly Compensation, and Unit Labor Cost in Manufacturing, Twelve Industrial Countries, 1950-1988 and Unit Labor Cost in Korea and Taiwan, 1970-1988,
Washington, August 3, 1989 and updated November 2, 1989, and May 7, 1990. (Unpublished data).
Borlenghi E. Ed. (1995) L’Italia del 2000. La Fiat a Melfi e
il futuro del Mezzogiorno. FORMEZ, Roma.
CAPUTI P. G.(1997) Lo studio preliminare per la sistemazione di Melfi e del suo territorio in F. Forte e L. Fusco Girard Principi teorici e prassi operativa nella pianificazione urbanistica, Maggioli Editore. Roma.
Cersosimo D. (1994) Viaggio a Melfi. La Fiat oltre il
fordismo. Donzelli, Roma.
CILIENTO P. (1986) Breve storia di Melfi. – Libreria, Rionero
in Vulture. 1986
Colombo L.(!988) Fabbrica città territorio. DPST Collana di Studi di Urbanistica, Napoli.
Confindustria (2000) Indicatori economici provinciali SIPI, Roma.
Consorzio ASI Potenza - Contratto d’area per le aree industriali ex art. 32 Legge 219/81. Documento.
Cuomo, Macchiato, Ragosta, Santangelo (1996) “Monitoring-modeling Dynamical Approach to Evaluate the Environmental Impact of the Atmospheric Emissions in an Industrial area of Southern Italy” SETAC-Europe VII Annual Meeting, Stirling. EUNIT “Research Note: The Automotive Filiere - Industrial
Reorganisation and Spatial Embedding” sito internet
http://www.newcastel.ac.uk/ ÷ncurd/eunit/auto.htm
FIAT (1996) Relazioni esterne e comunicazione, progetto ecologia – Fiat per un mondo migliore, Torino.
Fiocco L. “L’effetto kanban nell’organizzazione del lavoro alla FIAT di Melfi” sito internet http://services.csi.it/ ÷chaos/Fiocco.htm
Hirschman A.O. (1958) The Strategy of Economic Development New Haven Yale University Press.
IASM, FINFOR INSUD (1982) Indagine conoscitiva di base per
un progetto di forestazione produttiva nell’area colpita dal terremoto del 23/11/1980. Grapho, Roma.
IASM (1987) Aree attrezzate e servizi reali per lo sviluppo
delle piccole imprese. Franco Angeli, Milano.
ISTAT (1986a), Annuario di contabilita nazionale 1986, Volumes 1 and 2, Rome.
ISTAT (1986b), Censimenti 1971 1981, and `1991.
ISTAT (1987a), Annuario di contabilita nazionale 1960-1985, Volume 15, Rome.
ISTAT (1987b), “Tavola intersettoriale dell'economia italiana 1987”, Collana
d'informazione 1987, 22, Rome.
ISTAT (1990a), Conti regionali (on IBM Diskette), Rome.
ISTAT (1990b), "Conti economici regionali 1980-1987," Collana d'informazione, Number 21, Rome.
ISTAT (1990d), "Matrice di trasformazione per 1985", Mimeo. ISTAT (1993), "L'intedipendenze settoriali per 1988"' diskette, Rome.
ISTAT (1996) Conti Economici Regionali 1980-1994, Rome
Istituto Tagliacarne (1991), Il redditto prodotto in Italia - datti regionali e
provinciali , Milano.
Istituto Tagliacarne (1996) Monitor provinciale anno
1991-1995. Roma.
NOMISMA (1987), “La produttivita dell'economia italiana,” Il Sole-24 Ore, Milan.
Paelnich, J. (1959) "Posiblisme et poles de croissance: phenomenes de prestige et de propagation dans le cadre de l'industrialisation nederlandaise," Economie appliquee, Vol. xii nos. 1-2, pp. 186-197.
Perroux F.(1966) L’economia del XX secolo. Edizioni di Comunità, 1966.
Perroux F. (1955) “Note sur la notion de croissance” Economie appliquee pp.307-320.
SchachterG. (1989) Economic Theory and Input-Output Analysis in Lucio Bianco and
Agostino Labella Input Output, Franco Angeli, Milano, 1-32.
Schachter, Gustav (1968), Sviluppo per la polarizzazione indotta nell'Italia meridionale," Rivista internazionale di scienze economiche e commerciali , Vol. 15, no.
3, pp. 268-294.
Schachter Gustav (1991), The 1985 MRIO, diskette, CEES, Boston, Massachusetts.
Schachter, Gustav and Franco Pilloton (1983) Input-Output Italia : a
Multiregional System 1959-1965-1969-1972 Casa del
libro.Roma.
Schachter, Gustav, Tullio Gregori and Levanto Schachter (1998) “Growth Poles Revisited’” Presented at the Input-Output International Conference, New York
SVIMEZ (1993) L’industrializzazione del Mezzogiorno : La FIAT a Melfi. Il Mulino Bologna.
SVIMEZ (1994.1995,1996) Rapporto 1994 1995 1996 sull’economia del Mezzogiorn, il Mulino Bologna.