Socially Responsible Investments and their
Anticyclical Attitude during Financial Turmoil
Evidence from the Brexit shock
Helen Chiappini1 and Gianfranco A. Vento2
Abstract
In recent years, many studies investigate whether Socially Responsible Investments (SRIs) outperform traditional investments. After the 2008 financial crisis another research question emerged: are SRIs able to overcome market downturns? This stream of literature investigates many different geographies and financial crises; however, to the best of our knowledge, no study has investigated SRIs reaction to the United Kingdom European Union Membership Referendum (Brexit).
The aim of this paper is to analyze SRIs prices reaction to the Brexit referendum on June 23, 2016. We assessed whether there was a difference: a) with SRIs price reaction to the Lehman Brothers bankruptcy; b) compared to various sectors and the geographical residence of companies.
Findings show that SRI reacted more negatively than non-SRI to Brexit, while they reacted better to Lehman shock. Thus, this paper contributes to the existing literature showing that SRIs have anticyclical power especially during the most severe financial crisis, like the Lehman turmoil.
JEL classification numbers: G11; G15
Keywords Socially responsible investments, SRIs, Financial crises, Brexit,
portfolio diversification, event study
1 Sapienza University of Rome. Italy 2 Regent’s University London, UK
Article Info: Received: September 19, 2017. Revised : October 16, 2017
1 Introduction
Socially responsible investments (SRIs) aim to obtain a financial return and screen investments according to some non-financial criteria. ‘Unlike conventional types of investment SRIs apply a set of investment screens to select or exclude assets based on ecological, social, corporate governance or ethical criteria, and often engages in the local communities and in shareholder activism to further corporate strategies towards the above aims’ (Renneboog et al., 2008, p. 1723).
Based on this definition, we can distinguish investment strategies focused on negative screens and positive screens. Using the negative screens, company stocks are excluded from SRIs portfolios when they operate in controversial industries, like alcohol, tobacco, military and fossil fuel. When a positive screen is used, assets are selected according to their high CSR standards (Renneboog et al., 2008), i.e. due to their employee or environmental protection policies. The positive screens can be combined with the best in class approach. Thus, companies are ranked according to their Corporate Social Responsibility (CSR) positive performance and the selection of portfolio companies is based on “the best” CSR performance.
Another type of screen focuses on specific environmental, governance and social criteria. Companies are screened using both negative and positive strategies. This is known as “third generation of screens” (Renneboog, 2008). The shareholder activism – considered the fourth generation of screens - consists of the shareholders dialogue with the company management or the influence of company strategies through voting at annual meetings.
For some organizations - like the European Sustainable Investment Forum (Eurosif, 2016) - socially responsible strategies include the selection of companies due to their measurable (or measured) social and environmental impact. Thus, this could be considered a fifth generation of screening. However, many practitioners and scholars (i.e. Freireich and Fulton, 2009; Social Impact Investment Taskforce, 2014; Höchstädter and Scheck, 2015) refer to this approach as a separate type of investment: the social impact investments (SIIs).
The SRIs market is growing and the Global Sustainable Investment Alliance (GSIA, 2016) declared that SRIs assets worldwide have increased by 25 percent since 2014 and accounted for $22.89 trillion in early 2016. In Europe, SRIs assets under management are estimated at $12,04 trillion (GSIA, 2016).
Literature has been concentrated on the investigation of SRIs ability to outperform conventional investments for many years. The rationale behind this stream of literature is linked to the selection process of SRIs. Limitations in investment decision-making can reduce the investment opportunities which in turn can lead to poor diversification and risk-adjusted performance (Miralles-Quirós and Miralles-Quirós, 2017).
The financial crises occurred from 2000 - the dot-com crisis, the global financial crisis and the sovereign debt crisis - suggested a need for testing SRIs reaction to
crises and market shocks. The idea confirmed by empirical evidence was that SRIs can have an insurance power during market turmoil (Becchetti et al., 2015) encouraging their inclusion in investment portfolios.
Recently, European countries and consequently European markets have been exposed to the United Kingdom European Union Membership Referendum (known as Brexit). After the vote on June 24 in 2016 markets reacted with financial turmoil: ‘FTSE 100 slumped 8.7 per cent on opening before trimming losses to 4.3 per cent. [..] The Euro Stoxx bank index fell 17 per cent, back to levels last seen at the depths of the Eurozone debt crisis in August 2012. […] Spain’s Ibex index tumbled 12.35 per cent, its largest decline since launching in 1992’ (Parker et al., 2016)
Instead of some research focused on stocks reaction to Brexit (i.e. Schiereck et al., 2016), no research focused on SRIs reaction to this market shock. Thus, we would like to fill this gap of literature.
The aim of this paper is to analyze SRIs prices reaction to the Brexit referendum on June 23, 2016. We assessed whether there was a difference: a) with SRIs price reaction to the Lehman Brothers bankruptcy; b) compared to various sectors and the geographical residence of companies.
SRIs are captured from stocks listed in MSCI Europe ESG index, while the comparative sample include stocks listed in the traditional MSCI Europe index. Thus, SRI and SR companies are used as synonymous.
The methodology applied is the event study.
The paper is structured as follows. In section two we discussed the literature on SRIs performance during financial crises. In section three we describe data and methodology and in section four we present results of the empirical analysis. Finally, section five concludes.
2 Literature Review
The 2007 global financial crisis has revealed a new research area for SRIs: the investigation of SRIs tolerance to market turmoil. Studies have been conducted focusing on many geographical areas and different financial crises. The most investigated crisis is the global financial crisis (2007-2009); however the European sovereign debt crisis (2011) and the dot-com crisis (2000-2002) have also been considered among the most significant market crises. The analyses have been conducted in terms of companies or in terms of aggregated portfolios (funds or funds of funds or financial indexes).
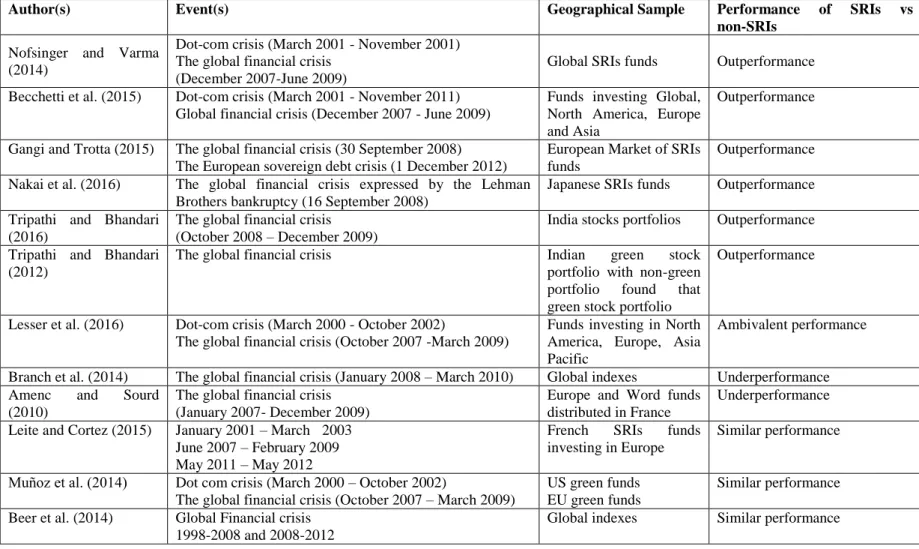
Table 1 synthetizes literature of SRIs performance in times of market turmoil. SRIs performance during financial crises reveals their prevalent anticyclical power. Nofsinger and Varma (2014) investigated SRIs funds and non-SRIs funds during crisis and non-crisis periods, focusing on the dot-com and on the global financial
crisis. SRIs funds outperformed non-SRIs during periods of market turmoil. This
by funds using negative screening.
Becchetti et al. (2015) analyzed a large sample of socially responsible funds - composed by more than 22000 funds - investing globally, in North America, Europe and Asia, from January 1992 to April 2012. SRIs outperformed traditional investments during the global financial crisis, however, in the large period considered there were many ‘switches in dominance’ between the two groups of investments. The authors concluded that SRIs ‘may be conceived as an insurance which protects against an ethical risk factor whose risk accumulated in market booms (where ethical investors pay a premium in terms of lower returns) and produces its negative consequences in financial crises where ethical investors cash their insurance indemnity (i.e. earn a portfolio return which is superior to that of none-ethical investors)’ (Becchetti et al., 2015, p. 2560).
Gangi and Trotta (2015) investigated the European SRIs funds reaction to both the 2008 and 2011 financial crises. According to this study, SRIs performed better showing less volatility than other funds during the adverse phases of the market. However, ‘they result as a refuge fund for investors’ especially ‘when the effects of the crisis are very broad and strongly negative’ (p. 391) like during the Lehman crisis. When crisis ‘has a more limited epicenter or its effects are not exhausted’ like in the sovereign debt crisis, traditional funds outperform SRIs.
Other more focused studies analyzed the Japanese and the Indian market of SRIs funds during the 2007 financial crisis. Nakai et al. (2016) applied the event study methodology and used the bankruptcy of Lehman Brothers as the ‘momentums event’. They found that SRIs funds better react to the Lehman Brothers bankruptcy than other traditional funds.
Tripathi and Bhandari (2016) compared SRIs stock portfolios against non-SRIs portfolios in the Indian context. In terms of risk-adjusted measures SRIs outperformed non-SRIs portfolio. Moreover, Tripathi and Bhandari (2012) compared Indian green stock portfolios with non-green portfolios and found that green stock portfolios represent a good investment in times of crisis. In fact, in the pre-crisis period (2004-2007) green investments underperformed non-green investments, while in the period from 2007 to 2009 green investment considerably outperformed non-green stocks portfolio and the relative market.
Ambivalent results have been discovered by Lesser et al. (2016). They show that
socially responsible funds investing worldwide do not represent a refuge investment in years of crisis, while funds domiciled in North America have an countercyclical power. They attribute the positive result to the stock-picking managerial capability of fund managers in North America.
Other studies do not empirically support the SRIs capability of offering abnormal return in times of turmoil. Branch et al. (2014) created a social fund of funds and a control fund of funds with no SRIs investments. The social fund of fund underperformed the other fund-of-fund control portfolio and the market index during the global financial crisis. However, the social portfolio was less volatile both than the control portfolio and the market. Amenc and Sourd (2010) employed a four factors model - that includes Fama-French factors and a factor that
measures variations in the price of oil - in order to study SRIs funds available for French investors (even though they are registered in Europe or in extra-European countries) against other funds. The study showed that SRIs do not outperform other investment funds.
Leite and Cortez (2015) focusing on French funds investing in Europe during the three crises occurred from 2001 to 2011 empirically demonstrated similarity between performance of conventional and non-conventional (SRIs) funds. Muñoz et al. (2004) analyzed a specific type of SRIs funds - and the green funds - during market downturns and found that both US and EU green funds do not show significant differences in terms of performance of its peers. However, US green funds perform better during non-crisis periods. Beer et al. (2014) investigated global SRIs and non-SRIs indexes and found similar performance during the global financial crisis. However, the performance was better when the financial and health care sectors were not considered.
Table 1 – Summary of SRIs contribution analyzing crises
Author(s) Event(s) Geographical Sample Performance of SRIs vs
non-SRIs
Nofsinger and Varma (2014)
Dot-com crisis (March 2001 - November 2001) The global financial crisis
(December 2007-June 2009)
Global SRIs funds Outperformance
Becchetti et al. (2015) Dot-com crisis (March 2001 - November 2011) Global financial crisis (December 2007 - June 2009)
Funds investing Global, North America, Europe and Asia
Outperformance
Gangi and Trotta (2015) The global financial crisis (30 September 2008) The European sovereign debt crisis (1 December 2012)
European Market of SRIs funds
Outperformance
Nakai et al. (2016) The global financial crisis expressed by the Lehman Brothers bankruptcy (16 September 2008)
Japanese SRIs funds Outperformance
Tripathi and Bhandari (2016)
The global financial crisis (October 2008 – December 2009)
India stocks portfolios Outperformance
Tripathi and Bhandari (2012)
The global financial crisis Indian green stock portfolio with non-green portfolio found that green stock portfolio
Outperformance
Lesser et al. (2016) Dot-com crisis (March 2000 - October 2002)
The global financial crisis (October 2007 -March 2009)
Funds investing in North America, Europe, Asia Pacific
Ambivalent performance
Branch et al. (2014) The global financial crisis (January 2008 – March 2010) Global indexes Underperformance Amenc and Sourd
(2010)
The global financial crisis (January 2007- December 2009)
Europe and Word funds distributed in France
Underperformance
Leite and Cortez (2015) January 2001 – March 2003 June 2007 – February 2009 May 2011 – May 2012
French SRIs funds investing in Europe
Similar performance
Muñoz et al. (2014) Dot com crisis (March 2000 – October 2002)
The global financial crisis (October 2007 – March 2009)
US green funds EU green funds
Similar performance
Beer et al. (2014) Global Financial crisis 1998-2008 and 2008-2012
3 Methodology and Data
3.1 Methodology
The methodology hereby applied is the event study. Since the Fama et al. (1969) model, the event study has been used: a) to test the market efficiency (Fama, 1991) that is the market capability to incorporate relevant information in stock prices; b) securities price reaction to some specific announcements, under Fama’s (1991) hypothesis regarding market efficiency (Binder, 1998).
The relevant events in this investigation are the Brexit vote on June 23, 2016 and the Lehman bankruptcy. We define the day zero (t=0) as the day of the announcement of the Brexit vote (June 24, 2016) and the Lehman Brothers bankruptcy (September 15, 2008).
In order to assess and monitor stocks reaction, we consider event windows: [0;0] and [0;1].
To test the effect of the Brexit and the Lehman bankruptcy announcement on SRIs and non-SRIs stocks we estimated the abnormal returns (AR) by adopting the market model.
AR for any company i at time t are calculated as:
(1) Where:
Rit is the return of the company i at the time t
is the expected return given the market model (2)
(2) Where:
αi is the intercept of stock i
βi is the systematic risk of stock i
Rmt is the average return of the proxy market that is the MSCI Europe
α and β has been determined in an estimation period of 120 trading days prior to the event period.
AR are estimated for any day in the event window. To estimate the cumulative effect within the event window, we calculate the cumulative abnormal return (CARi) for any company i.
(3)
Where t=n is the last day of event window.
To test the Brexit and Lehman Brothers effect on the sample of companies, we estimated the Cumulative average abnormal return (CAAR):
(4) Where N is the number of companies.
The cross-sectional t-test was employed in order to estimate the significance of CAAR.
To quantify the return within the event window, we used the average cumulative return (ACR).
(5)
(6) Where
is the cumulative return in the selected event window for the firm i 3.2 Data
We analyze SRIs and non-SRIs companies. In order to select the sample of SRIs companies we choose to analyze SRIs companies included in the MSCI Europe
ESG Leaders Index, and non-SRIs companies listed in the MSCI Europe3. The
number of SRIs and non-SRIs companies are listed in Table 2.
The sample was also divided to assess differences among non-financial and financial companies and the UK and non-UK companies (useful only for the Brexit analysis). Thus, the number of financial SRIs and non-SRIs companies are listed in Table 3, while the number of SRIs and non-SRIs companies located in the UK and non-UK countries are included in Table 4.
3
Constituencies of these indexes are publically shared by MSCI and are available at
4 Findings
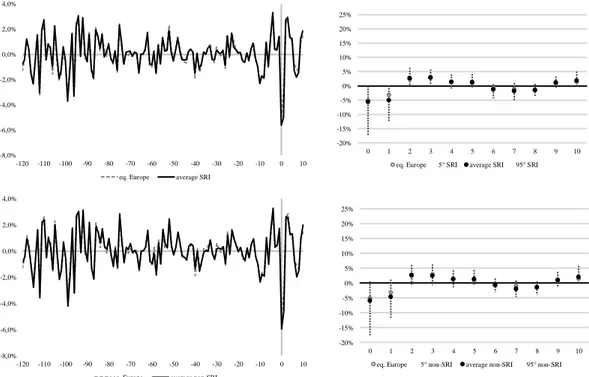
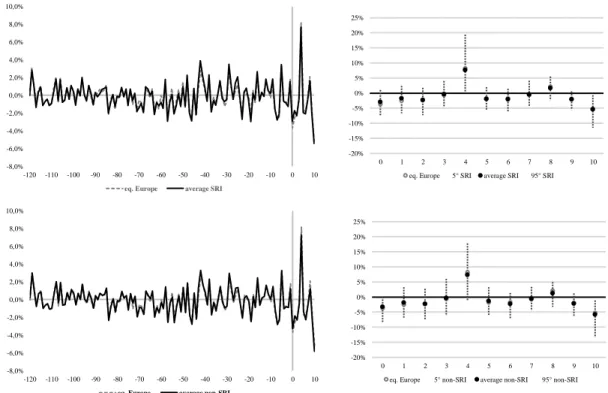
Figure 1 and Figure 2 describe the average returns of SRIs and non-SRIs, comparing them with the market, from 120 days prior to Brexit and the Lehman announcement to 10 days after the events. Brexit had on average a substantial impact on the day of the announcement and on the day after (Figure 1), while Lehman bankruptcy had a significant effect on average performance for more days (Figure 2). Moreover, during the Brexit turmoil the dispersion of returns was broader than during the Lehman shock (Figure 1 and Figure 2).
-8,0% -6,0% -4,0% -2,0% 0,0% 2,0% 4,0% -120 -110 -100 -90 -80 -70 -60 -50 -40 -30 -20 -10 0 10 eq. Europe average SRI
-8,0% -6,0% -4,0% -2,0% 0,0% 2,0% 4,0% -120 -110 -100 -90 -80 -70 -60 -50 -40 -30 -20 -10 0 10 eq. Europe average non-SRI
-20% -15% -10% -5% 0% 5% 10% 15% 20% 25% 0 1 2 3 4 5 6 7 8 9 10
eq. Europe 5° SRI average SRI 95° SRI
-20% -15% -10% -5% 0% 5% 10% 15% 20% 25% 0 1 2 3 4 5 6 7 8 9 10
eq. Europe 5° non-SRI average non-SRI 95° non-SRI
-8,0% -6,0% -4,0% -2,0% 0,0% 2,0% 4,0% 6,0% 8,0% 10,0% -120 -110 -100 -90 -80 -70 -60 -50 -40 -30 -20 -10 0 10
eq. Europe average SRI
-8,0% -6,0% -4,0% -2,0% 0,0% 2,0% 4,0% 6,0% 8,0% 10,0% -120 -110 -100 -90 -80 -70 -60 -50 -40 -30 -20 -10 0 10 eq. Europe average non-SRI
-20% -15% -10% -5% 0% 5% 10% 15% 20% 25% 0 1 2 3 4 5 6 7 8 9 10
eq. Europe 5° SRI average SRI 95° SRI
-20% -15% -10% -5% 0% 5% 10% 15% 20% 25% 0 1 2 3 4 5 6 7 8 9 10
eq. Europe 5° non-SRI average non-SRI 95° non-SRI
Figure 2: SRIs and non-SRIs during Lehman shock
Table 2 shows results from the event study for SRIs and non-SRIs companies during the Brexit turmoil. In terms of ACR, there are no particular differences between SRIs and non-SRIs in the event windows [0;0] and [0;1]. In terms of CAAR, SRIs stocks obtained much more negative CAAR than non-SRIs in the day of the Brexit announcement and the day after (Table 2). CAAR is significant at 99% in the event window [0;1] both for SRIs and non-SRIs, while non-SRIs CAAR in the event window [0;0] is significant at 95%.
Table 3 analyzes results of the Lehman Brothers shock on SRIs and non-SRIs. Findings show that SRIs performed better than non-SRIs, even though it obtained negative ACR. Furthermore, the event study analysis shows significant and higher positive abnormal returns for SRIs.
Table 2: Brexit effects on SRIs and non-SRIs n. Event window [0;0] Event window [0;1]
ACR % CAAR % ACR % CAAR % SRIs 224 -0.685 -0.685** -10.683 -2.681***
t-value -1.967 -5.405
Non-SRIs 220 -0.576 -0.568** -10.586 -1.838***
t-value -1.760 -3.785
Significance code: *** 0.01; ** 0.05; * 0.1
Table 3: Lehman effects on SRIs and non-SRIs
n.
Event window [0;0]
Event window [0;1]
ACR% CAAR% ACR% CAAR% SRIs 208 -2.909 1.054*** -4,628 2.013***
t-value 6,081 6.312
Non-SRIs 195 -3.297 0.436*** -5,132 1.109***
t-value 2.560 3.028
Significance code: *** 0.01; ** 0.05; * 0.1
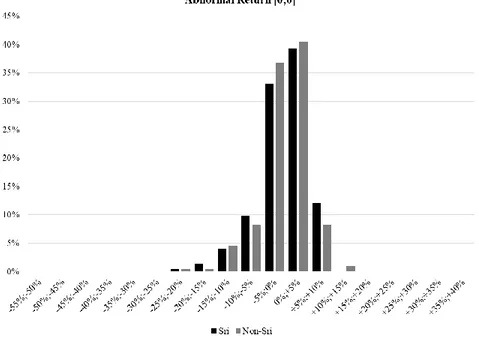
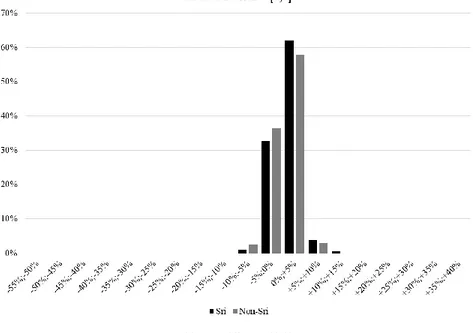
Figure 3 and Figure 4 show dispersion of CAAR in the Brexit and Lehman events by event windows.
Even though the percentage of SRIs that obtained CAAR between 0-5% are higher than non-SRIs (more than 30% versus 25% of non-SRIs), the distribution of abnormal returns for SRIs shows a fat negative tail and thin positive tail (Figure 3).
The Lehman shock in the event window [0;1] showed that approximately 50% of SRIs obtained CAAR between 0 and 5%, and more than 20% of SRIs showed CAAR between 5-10%, while more than 40% of non-SRIs obtained CAAR between 0 and 5% and 15% of non-SRIs obtained CAAR between 5-10% (Figure 4). Similar patterns are confirmed in the event window [0;0].
Figure 4: Dispersion of CAAR during the Lehman shock
Regarding the Brexit event, non-financial SR companies underperformed non-financial non-SRIs companies in the event window [0;1], but not in the event window [0;0] (Table 4). The CAAR of non-financial SR companies was less than CAAR of non-SR and non-financial companies.
The Brexit shock affected the full sample of SRIs more than non-financial SRIs (Table 2 and Table 4).
summarized in Table 5. SR non-financial companies obtained better ACR than non-SRIs. Moreover, SRIs obtained higher and positive significant abnormal return than non-SRIs in any event window.
Table 4: Brexit effects on non-financial companies
n. [0;0] [0;1]
ACR% CAAR% ACR% CAAR%
Non-financial SRIs 184 -4.756 -0.238 -9.368 -2.063*** t-value -0.657 -3.769 Non-financial non-SRIs 177 -4.783 0.294 -8.880 -0.644* t-value 0.906 -1.299 Significance code: *** 0.01; ** 0.05; * 0.1
Table 5: Lehman effects on non-financial companies
n. [0;0] [0;1]
ACR% CAAR% ACR% CAAR%
Non-financial SRIs 170 -2.328 1.328*** -3.541 2.586*** t-value 7.079 8.294 Non-financial non-SRIs 158 -2.881 0.483*** -4.364 1.255*** t-value 2,612 3,226 Significance code: *** 0.01; ** 0.05; * 0.1
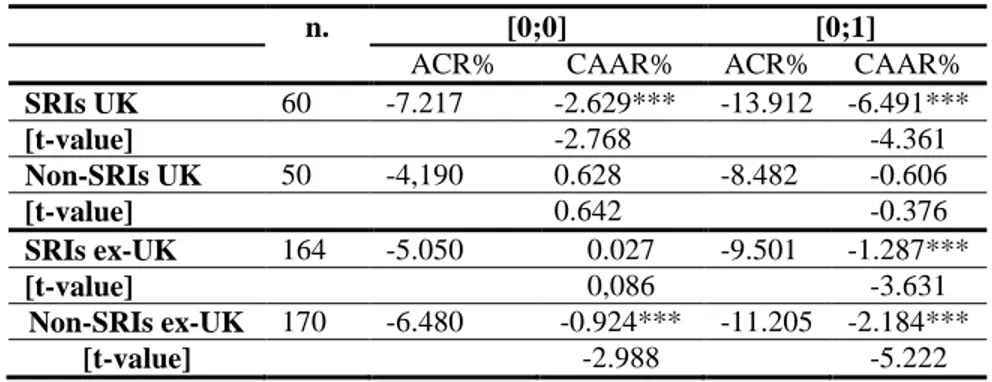
Table 6 resumes effects of Brexit on SRIs located within or outside the UK. SR UK companies underperformed non-SR companies resident in the UK in a significant way. In the event window [0;0] and [0;1] they lost more than non-SR companies (-7.2% versus -4.19% and -13.91% versus -8.48%). SR companies located in the UK obtained negative significant CAAR in any event window, while non-SR companies resident in the UK obtained non-significant CAAR. Moreover, SR companies not resident in the UK performed better than non-SR companies (-5.05% versus -6.48% and -9.5% versus -11.2%). SR companies obtained less negative CAAR than non-SR companies in any event window. Last, with the exception of event window [0;0] CAAR are significant at 99% level.
Table 6: Brexit effects on UK and non-UK SRIs and non SRIs
n. [0;0] [0;1]
ACR% CAAR% ACR% CAAR%
SRIs UK 60 -7.217 -2.629*** -13.912 -6.491*** [t-value] -2.768 -4.361 Non-SRIs UK 50 -4,190 0.628 -8.482 -0.606 [t-value] 0.642 -0.376 SRIs ex-UK 164 -5.050 0.027 -9.501 -1.287*** [t-value] 0,086 -3.631 Non-SRIs ex-UK 170 -6.480 -0.924*** -11.205 -2.184*** [t-value] -2.988 -5.222 Significance code: *** 0.01; ** 0.05; * 0.1
5 Conclusion
The aim of this paper was to conduct an event study to assess SRIs price reaction to financial turmoil. The analysis focused on Brexit and Lehman crisis.
During the Brexit shock SRIs obtained similar performance of non-SRI; however, CAAR of SRI was more negative than CAAR of non-SRI. By contrast, during the Lehman turmoil SRIs obtained highest significant CAAR than non-SRI. Thus, SRI reacted more negatively than non-SRI to Brexit, while they reacted better to Lehman shock.
The analysis carried out demonstrates that SRIs can represent an anticyclical investment during severe financial turmoil, like the Lehman Brothers bankruptcy. This is evident both looking to the full sample of SRI and to the sample of non-financial companies.
This result confirms findings obtained by Gangi and Trotta (2015) analyzing SRI and traditional funds during Lehman and sovereign debt crises.
Furthermore, SR companies resident in the UK, in contrast with SRIs resident abroad, obtained higher negative abnormal returns.
Further research can investigate whether ESG ratings affect SRIs reaction to financial turmoil, assessing whether highest ESG ratings are associated to better reaction to financial crises.
References
[1] N. Amenc, L. Sourd, “The performance of Socially Responsible Investment and Sustainable Development in France: an update after the Financial Crisis”,
EDHEC Risk Institute, France, 2010.
http://www.edhec-risk.com/edhec_publications/all_publications/RISKReview .2010-09-13.4027/attachments/EDHEC-Risk_Position_Paper_SRIS.pdf
[2] F. .M Beer, J.P Estes, C. Deshayes, “The performance of the faith and ethical investment products: a comparison before and after the 2008 meltdown”, Financial Services Review, vol. 23, 2014, pp. 151-167.
[3] L. Becchetti, R. Ciciretti, A. Dalò, S. Herzel, “Socially responsible and conventional funds: performance comparison and the global financial crisis”, Applied Economics. vol. 47 n. 25, 2015, pp. 2541-2562.
[4] Binder, J. J., “The Event Study Methodology Since 1969”, Review of Quantitative Finance and Accounting, vol. 11, 1998, pp. 111–137.
[5] B. Branch, A. Ma, H. Shafa, R. Shaw, “Socially responsible mutual funds in the era of financial turmoil”, International Journal of Business, Accounting and Finance, vol. 8, n. 1, 2014, pp.24-34.
[6] Eurosif, “European SRIs Study”. 2016, Brussels.
[7] E. Fama, “Efficient Capital Markets: II”, The journal of finance, vol. 46, n. 5, 1991, pp. 1575-1617.
[8] E. Fama, L. Fisher, M. C. Jensen, R. Roll, “The adjustment of stock prices to new information”, International Economic Review, vol. 10, n. 1, 1969, pp. 1-21.
[9] J. Freireich, K. Fulton, “Investing for social and environmental impact”,
Cambridge, MA., 2009.
http://monitorinstitute.com/downloads/what-we-think/impact-investing/Impa ct_Investing.pdf.
[10] F. Gangi, C. Trotta, “The ethical finance as a response to the financial crises: an empirical survey of European SRFs performance”, Journal of Management and Governance, vol. 19, 2015, pp. 371-394.
[11] GSIA, “Global sustainable investment review”, 2016.
http://www.gsi-alliance.org/wp-content/uploads/2017/03/GSIR_Review2016. F.pdf
[12] A.K. Höchstädter, B. Scheck, “What’s in a name: an analysis of impact investing understanding by academics and practitioners”, Journal of Business Ethics, vol. 132, n. 2, 2015, pp. 449-475.
[13] P. Leite, M. Cortez, “Performance of European Socially Responsible Funds during market crisis: evidence from France”, International review of financial analysis, vol. 40, 2015, pp. 132 – 141.
[14] K. Lesser, F. Röβle, C. Walkshäusl, “International socially responsible funds: financial performance and managerial skills during crisis and non-crisis markets”, Problem and Perspectives in Management, vol. 14 n. 3, 2016, pp. 461-472.
[15] M. Miralles-Quirós, J. Miralles-Quirós, “Improving diversification opportunities for socially responsible investors”, Journal of Business Ethics, vol. 140, n. 2, 2017, pp. 339–351.
[16] F. Muñoz, M. Vargas, I. Marco, “Environmental Mutual Funds: Financial Performance and Managerial Abilities”, Journal of Business Ethics, vol. 124 n. 4, 2014, pp. 551–569.
[17] M. Nakai, Y. Keiko, T. Kenji, “Can SRIs funds better resist global financial crisis? Evidence from Japan”, International Review of Financial Analysis, vol. 48, 2016, pp. 12 – 20.
[18] J. Nofsinger, A. Varma, "Socially responsible funds and market crises”, Journal of Banking & Finance, vol. 48, 2014, pp. 180-193.
[19] G. Parker, M. Mackenzie, B. Hall, “Britain turns its back on Europe”, Financial Times. June 24, 2016.
[20] L. Renneboog, J.T. Horst, C. Zhang, “Socially responsible investments: institutional aspects, performance and investor behavior”, Journal of Banking & Finance, vol. 32, 2008, pp. 1723-1742.
[21] Social Impact Investment Taskforce, “Impact investment: the invisible heart
of markets”, 2014, London. http://www.socialimpactinvestment.org/.
[22] D. Schiereck, F. Kiesel, S. Kolaric, “Brexit: (not) another Lehman moment for banks?”, Finance Research Letters, vol. 19, 2016, pp. 291-297.
[23] V. Tripathi, V. Bhandari, “Performance of socially responsible stock portfolios. The impact of global financial crisis”, Journal of Economics and Business Research, vol. 1, 2016, pp. 42-68.
[24] V. Tripathi, V. Bhandari, “Green is good in Indian Stock Market”, Colombo Business Journal, vol. 3, n. 2, 2012, pp. 27-45.
![Table 2: Brexit effects on SRIs and non-SRIs n. Event window [0;0] Event window [0;1]](https://thumb-eu.123doks.com/thumbv2/123dokorg/5024696.55641/11.813.176.636.142.280/table-brexit-effects-sris-event-window-event-window.webp)
