GEOPHYSICAL RESEARCH LETTERS, VOL. 27, NO. 21, PAGES 3445-3448, NOVEMBER 1, 2000
Lidar and SAGE II observations of Shishaldin volcano
aerosols
and lower stratospheric
transport.
Vincenzo
Rizi Fabrizio
Masci
©, Gianluca
Redaelli Piero
Di Carlo Marco
Iarlori Guido
Visconti and
Larry
W. Thomason
(3)
Abstract. During May 1999, data collected with two of University of L'Aquila lidar systems, Italy show an increase in the stratospheric aerosol content at altitudes between 15 and 18 km. Our initial hypothesis is that these aerosols originated from the Shishaldin (Alaska) volcanic eruption of 19 April 1999. SAGE II observations, taken between Julian day 100 and 180, at latitudes above 40øN, show several sightings that are good candidates for volcanic aerosols. A trajectory analysis shows that a few SAGE II measurements are in space and time compatible with the Shishaldin eruption, and the aerosol enhancements observed by L'Aquila lidars have been also sampled by SAGE II, later and in different locations.
Introduction.
The volcanic injection of SO., in the lower stratosphere is
responsible for the formation of H2SO 4 through the rapid
oxidation by OH radicals. Newly formed H2804 gas may nucleate to form new particles and/or condense onto pre- existing aerosol. These physical processes increase the number and the size of the stratospheric sulfate particles. The last large
perturbation to the stratospheric aerosol loading originated from the eruptions of Mt. Pinatubo in June 1991. Barnes and
Hofmann, 1997 and, recently Guzzi et al., 1999 suggest that by the end of 1996, the stratospheric aerosol load had decayed to
pre-eruption levels, reaching the lowest aerosol levels seen in the last 20 years. During low aerosol periods, minor volcanic eruptions may regionally perturb the stratospheric aerosol loading (Yue et al., 1994). These localized increases can be important for the estimation of the aerosol background level.
The observations of very low aerosol amounts are strongly
affected by instrument sensitivity and the local sampling of
moderate volcanic perturbations can be useful for setting upper
limits.
Shishaldin volcano (54.75øN 163.9øE, summit elevation 2857
m) is located near the center of Unimak Island in the eastern
Aleutians. Its recent eruptive period began in mid-February
1999, producing an ash cloud to at least 14 km a.s.l. on 19
April
2000.
In this
occasion
-0.2x10
'• tons
of SO2
was
injected
into the lower stratosphere (Bull. of the Global Volcanism Network, Smithsonian Institution). This work investigates the
(•)Dipartimento di Fisica, Universith degli Studi, L'Aquila, Italy. (2)Istituto Nazionale di Geofisica, L'Aquila, Italy.
(3)NASA Langley Research Center Hampton, VA, USA. Copyright 2000 by the American Geophysical Union.
Paper number 2000GL011515. 0094-8276/00/2000GL011515505.00
aerosol observations carried out in May 1999 by the University
of L'Aquila lidar systems and by SAGE I[ between April and
June 1999. In the cases studied here, we use trajectory analysis to correlate observations of enhanced aerosol by SAGE II data, lidar, and the time-spatial position of the initial volcanic
injection. Trajectory studies of volcanic clouds have been successfully performed in the past (e.g., Redae!li et al, 1998).
Using this approach, we show that the April 1999 Shishaldin
eruption appears to be consistent with the timing and the
location of the aerosol observations reported herein.
Lidar and SAGE II observations.
The lidar technique and the satellite remote sounding are widely used for stratospheric aerosol monitoring. The former
produces profiles that are highly resolved in altitude and time,
and the latter has a large geographical coverage. The lidar measures the aerosol back-scattering (ABS) ratio profiles (the
ratio between the total and molecular back-scattering coefficients), and the SAGE II data can be inverted for the
estimation of aerosol extinction profiles (McCormick, 1987). The lidars of University of L'Aquila (42.35øN, 13.38øE, 683m
a.s.l.) consist of a sodium lidar and an ozone DIAL. The first
of these systems detect the mesospheric sodium density
profiles, but also samples the lower stratosphere. The
transmitter is a dye-laser, which is tuned to Na D2 line. The receiver is a f/5 Cassegrain telescope (Di Carlo et al., 1998). The DIAL has been recently upgraded (Rizi et al., 2000). A
XeF (351nm) excimer laser is the transmitter, and the receiver
uses a ff10 Cassegrain telescope. Both lidar receivers are
coupled via a mechanical chopper, field lens and dichroic
mirrors to interference filters, photomultipliers and electronic
chains for photon-counting. The data acquisition is performed
with multi-channel scaler cards and the height resolution is of 300m. Two ABS profiles are measured at 589 and 351 nm, averaging the lidar returns for at least one hour. The error (1 c5 standard deviation) affecting these data ranges between 5% at
- 13 km and 10-15 % at -30 km.
The SAGE (Stratospheric Aerosol and Gas Experiment) II
instrument has seven radiometric channels centered at
wavelengths of 1.020, 0.94, 0.6, 0.525, 0.453, 0.448, and 0.385
gm. The scientific products are the aerosol extinction
coefficient profiles at four different wavelengths (Thomason
and Osborn, 1992), as well as ozone, NO 2 and water vapor
density profiles. For the purposes of this work we rely only on
the aerosol extinction at 1020 nm.
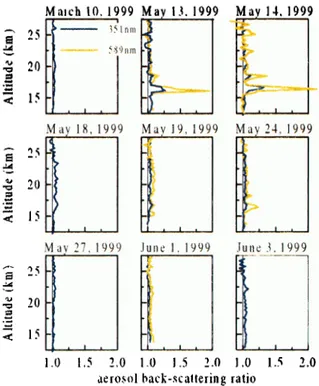
A collection of lidar observations is reported in Figure 1. On 13 May 1999, an increase of ABS occurred in the altitude range between 16 and 18 km. These layers were highly variable in the period between 13 May and 27 May, and disappear during the first days of June. The 351 and 589 nm ABS ratios increase to 1.25+0.06 and 2.1_+0.1, respectively.
3446 RIZI ET AL.' LIDAR/SAGE II OBSERVATIONS OF SHISHALDIN VOLCANO AEROSOLS Malch 10. 1999 13. 1999
• 25
35tnm
•' 20 < 15 I ' ! . 199 May 19, 1999 • 20 • 15a 27.
i; 9
• 20
I May 14, 1999 ,,, . ! . May 24. 1999 June 3. 1999 1.0 1.5 2.0 1.0 !.5 2.0 1.0 1.5 2.0aerosol back-scallering ratio
Figure 1. Aerosol back-scattering ratios at 351 and 589 nm in the period March - June 1999. 10 March, 18 May, 27 May and 3 June have measurements only in the UV channel. On 13 and 14 May, the primary aerosol layer is located around 17.5 km, corresponding to -475 K isentropic level.
The ABS coefficients integrated between 14 and 25 km (IABS) are reported in Figure 2, and the background levels are also indicated. The IABS, typical of a clean mid-latitude stratosphere (background), can be estimated assuming that the
ABS coefficient is simply related to the wavelength as -;k "•,
where
cz is the wavelength
exponent.
The reference
Volcanic
cloud
simulation.
background
IABS
values
are
those
given
by the
analysis
of The
trajectory
model
used
in this
study
to analyze
air parcel
Guzziet
al., 1999'
8.0+3.0
10
-s sr
'1 at 532
nm.
cz
ranges
motion
is isentropic
(Redaeili,
1997).
It can
calculate
between 1.0 and 2.0, as suggested by Barnes and Hofmann
1997.
In Figure 2, the increase of the stratospheric aerosol content (about 2-3 times the background levels) appears evident during
IE-3
IE-4
351 am a,
hM•ahlin major e•uPl•øn•
19Aprfi 1099
March I Apnl l May I June I July I
Figure 2. Integrated aerosol scattering coefficients (14-25
km) for the period March- June 1999. The uncertainty bars
represent Io standard deviation. The dashed areas indicate the
typical ranges of the integrated aerosol scattering values for a
clean
stratos.pshere
at northern
hemisphere
mid-latitudes:
between 9 10' and 20 10 -5 sr -• at 351 nm and between 5 10 -• and 8.0 10 -5 sr -• at 589 nm.
the second half of May. After about 2 weeks the aerosol loading decreases to the background conditions. This fast recovery could be the sign of an aerosol cloud of limited geographical extent or distributed in scattered spots.
Focusing on the lidar observations of 13, 14, 19, 24 May and 1 June, when the samplings were available at both wavelengths
and scaling the ABS coefficients as -;k -", it is possible to
evaluate the wavelength exponent between 351 and 589 nm. o•
is related to the aerosol size distribution and/or to the mean
size of the sampled particles: a large value of cz (>_3) suggests that the small particles are predominant, and a smaller a (between 2 and 0) might be generated by the presence of relatively larger aerosols. In the altitude regions corresponding to the most evident aerosol scattering increases (i.e., the layer between 15 and 17 km, on 13 May, or that measured on 24 May, between 15.5 and 17.5 kin), cz is about 1.5+1.0; elsewhere and for all the altitudes of I June profile, it ranges between 2.0 and 4.0. These rough estimations suggest the
presence of larger particles during May observations, while on
I June, the stratosphere was likely coming back to the background conditions' relatively fewer large particles in the sampled air mass.
Figure 3 shows a collection of the SAGE II extinction profiles at 1020 nm. The latitude/longitude aerosol distributions, as sampled by SAGE II in the northern hemisphere, show that there were several diffuse layers containing increased mass loading of stratospheric aerosols. These layers appeared at
high latitudes (>55"N), and they were well confined below 19
km, but at altitudes higher than the tropopause. Since these aerosol clouds occurred in late spring, they cannot be polar stratospheric clouds. SAGE II data were also available in the second half of April 1999, some measurements between 27
and 29 April (-75"N, -22()"E, at about 450 K level) seem to be
unambiguous observations of volcanic aerosol.
4,')[ ... •bl
.
t
,,."- 7; •; 7,; -•' ,,.' ,,.' ,..' 7-'
I I •21 I-II!11 Aerosol EXl •lt'[ ion
4'")1
...
- • '
1 t• T i• ' i •,'• io' it}- irf2" -1 lli2 • Bill Aerosol EXlUIclio•
Figures 3. SAGE II aerosol extinction profiles at 1020 nm. (a)
27 April 1999, (b) 28 April 1999, (c) 29 April 1999, and (d) 22
May 1999. The first three days are the earliest observations of Shishaldin aerosol at latitudes near 70"N. Panel (d) shows the
RIZI ET AL.: LIDAR/SAGE II OBSERVATIONS OF SHISHALDIN VOLCANO AEROSOLS 3447
backward and forward trajectories using global winds and temperature analyses. The effects the diabatic p!'ocesses are relatively small and can be neglected over the time intervals shorter than 1-2 weeks. Analyzed wind, pressure, and temperature fields used to calculate trajectories were obtained from the U.K. Meteorological Office (UKMO). The UKMO daily analyses (at 12:00 UTC) were provided by the British
Atmospheric Data Center (BADC), and contains fields on 18
pressure levels from 1000 hPa to 0.316 hPa on a 2.4"x3.75"
global grid.
The time intervals between Shishaldin eruption and the lidar samplings are too long to attempt a direct correlation between the two events by means of trajectory calculations. In this study, we have considered only the cross correlation between SAGE II observations and the injected cloud and between !idar
data and SAGE II.
The trajectory model has been initialized with a compact cylinder-like cloud covering a wide area over Shishaidin volcano. Parcels were released at the eruption time, corresponding to 20:00 UTC of 19 April 1999, and at every
subsequent hour. This simulated cloud contains hundreds of
parcels on several isentropic levels, separated by a potential temperature interval of 10 K (about 0.6 km in altitude) and extending from the tropopause to middle stratosphere. The
(b)
••k
i ?SN-•88E
•
ii '•5N-213E
-• iii 75N-238E\i11l
28.
1999
•_
. -.
I I I !!11! I __ I • • II•_111 ._..I_,_/...L_L.!IIII I t I !11!! 35 31') 25 21) 15! E-6 I [:.-5 I F-4 I E-3 I E-2
-I
1020nm Aerosol Extinction (kin i
35 (b)
•_ 30 •
- ii 75N-227E
• 25
'"•
t " .• , !• •
' '" • "•' -
1E-6 IE-5 IE-4 1E-3 IE-2
1020nm
Ae[osol
Extinction
(km
'1)
Figures 4. (a) Trajectory reconstruction for Shishaidin eruption vs. SAGE II observations. The shaded area represents the simulated cloud over Shishaldin volcano at eruption time and its position on 27 April, on 450 K isentropic surface. The location of SAGE II aerosol extinction above the background (see part (b) of this Figure), over the same isentropic surface
and for the same day, is also indicated. (b) The SAGE II extinction profiles at1020 nm measured on 27 April at 75"N. Red line: 227øE longitude (ii), black lines: adjacent profiles at 203"E (i) and 252øE (iii), corresponding to the boundaries of
the SAGE II area drawn in part (a). The primary aerosol layer,
in the 227"E profile, is located around 16.5 km, -450 K
isentropic level
Figures 5. (a) As in Figures 4(a) for 28 April 1999. (b) As in Figure 4(b) for 28 April; the locations of SAGE II observations
are 75"N and 213"E (ii in part (a), red line), 188"E and 238øE (black lines. i and iii).
trajectories of such air masses are calculated forward in time for a period of 2 weeks. Considering the evolution of each isentropic layer of the initial simulated cloud, and comparing their positions with SAGE II data, it is possible to select the group of parcels that best reproduces the cloud behavior as reported by satellite. After running a large number of test
cases, the best agreement was obtained for the 450 K surface
between tile initial position of the injected material and tile occurrence of high extinction values measured by SAGE II on
28 and 29 April 1999 (-16.5 kin; 75"N, 190-250"E). The
location of the material injected by the eruption, as reconstructed with the trajectories, and SAGE II data position are shown in Figures 4a and 5a.
SAGE II retrieval of high extinction values, relative to later period but still probably due to the material injected by Shishaldin, can be correlated with L'Aquila lidar data. Using the same initialization procedure described above, the trajectories of the different air masses tYrming the air column sampled over L'Aquila iidar site, have been followed for two weeks. In this case, the best agreement is obtained between lidar samplings of 13 and 14 May, and the SAGE II observations of 22 May (see Figures I and 6b), located at 475
K surface (-17.5 km), and about 58"N, 60-100"E. The
location of the air sampled by the lidar, as reconstructed with the trajectories, and SAGE II data position are shown in Figure
6a.
Discussion and conclusions.
Analysis of ABS profiles taken with the two lidar systems of University of L'Aquila in May 1999, reveals that there was an
3448 RIZI ET AL.' LIDAR/SAGE II OBSERVATIONS OF SHISHALDIN VOLCANO AEROSOLS
Figures 6. (a) Trajectory reconstruction for L'Aquila lidar (SLAQ) measurements rs. SAGE II observations. The shaded area indicate the air inasses over the !idar site (at 475 K isentropic level, where the lidar salnplings showed tile most evident aerosol illcrease). on 13 (red) and 14 May (blue), and
their positions on 22 May. The location of SAGE II measuren•ent taken on 22 May (see part (b) of this Figure), over the same isentropic surface, is also shown. (b) The SAGE
II extinction profiles atl()20 nln ineasured on 22 May, at
-58"N. Red line: 80"E longitude
(ii position
in part (a) of this
Figure). black lines: adjacent profiles at 56"E and 105"E,
corresponding to the boundaries of the SAGE II area drawn in
part a) (i and iii). The primary aerosol layer, in the 80"E
profile, is located around 17.5 kin,-475 K isentropic level.
increase of tile stratospheric aerosol content. Aerosol extinction profiles obtained by SAGE II in the period between April and June 1999 show sparse increases of aerosol
extinction at altitudes below 19 km and at latitude above 40øN.
These aerosol clouds may have originated from the Shishaldin volcanic eruption of 19 April 1999.
The reconstructed air mass trajectories show that SAGE II observations of an enhanced layer of aerosol on 28 and 29 April 1999 are compatible with the injection of volcanic
material over Shishaldin volcano on 19 April 1999. Layers of
enhanced aerosol observed by L'Aquila lidars on 13 and 14 May, 1999 were similarly sampled by SAGE II on 22 May
1999 at a similar altitude as the former set of observations.
Extended correlation between eruption and lidar measurements could not be performed using trajectories, due to the long time interval between the lidar measurements (May-June 1999) and the Shishaldin major eruption. However, the !idar data show that the lABS was at least twice the value of the background level, and the wavelength dependence of the scattering coefficients suggests the presence of larger, possibly volcanic,
particles.
Acknowledgments. The authors would like to thank Istituto
Nazionale di Geofisica for continued assistance and the British
Atmospheric Data Center for providing data. This work was partially supported by DGXIi of the European Commission under contract No.
EN V4-CT95-0090.
References.
Barnes, J., and D.J. Hofmann, Lidar measurements of stratospheric aerosol over Mauna Loa Observatory, Geophys. Res. Lett., 24,
1923-1926, 1997.
Di Carlo, P., V. Rizi, and G. V isconti, Lidar observation of mesospheric sodium over Italy, i! Ntun,o Cimento C, 5, 541-549,
1998.
Guzzi, D., M. Morandi, V. Santacesaria, L. Stefanutti, P. Agostihl, B. Liley, J.P. Wolff Four years of stratospheric aerosol measurements in the northern and southern hemispheres, Ge•q•hys. Res. Len., 26, _199-,__0_, 1999.
McCormick, M.P., SAGE II: an overview, Adv. Space Res., 7, 319-
326, ! 987.
Redatill G., Ph.D. Dissertation, Uni•'ersitv of L'Aquila, Itah', 1997.
Reda½!!i G., M. Schoeberl, A. J. Krueger, R. B. Rood, G. Visconti,
Tmjector 5 modelling of the Mr. Pinatubo SO: cloud, Proc. of Quadrennial Ozone Symposium, L'Aquila, Italy, edited by R.
B{[jkov and G. Visconti, 767-770, 1998.
Rizi, V., M. larlori, P. Di Carlo, G. Visconti, and G. Cinque, A combined Rayleigh-Raman !idar for measurements of tropospheric
water vapour and aerosol profiles, i! Nuovo Cimento C, 23, 53-64,
2000.
Thomason, L.W. and M.T. Osborn, Lidar conversion parameters derived from SAGE II extinction Measurements, Geophys. Res.
Lett., 19, 1655-1658, 1992.
Yue, G.K., R.E. Veiga, and Pi-H. Wang, SAGE II observations of a
previously unreported stratospheric volcanic aerosol cloud in the
Northern polar summer of 1990, Getq•hys. Res. Lett., 21,429-432,
1994.
P. Di Carlo, M. larlori, G. Redaeili, V. Rizi, G. Visconti, Dip. di Fisica, Univ. degli Studi, L'Aquila, Via Vetoio, Coppito, 67010 L'Aquila, Italy, vincenzo.rizi @ aquila.infix.it.
F. Masci, Istituto Nazionale di Geofisica, Castello Cinquecentesco,
67100, L'Aquila, Italy.
Larry W. Thomason, MS 475, NASA Langley Res. Center Hampton, VA 23681-0001, USA, l.w.thomason@ larc.nasa.gov.
(Received February 17, 2000; revised July 25, 2000; accepted August 1, 2000.)