The accessibility of European regions and airport network
20
0
0
Testo completo
(2) NOTE I Working Papers della Collana dei Quaderni del Dipartimento di Ingegneria Gestionale costituiscono un servizio atto a fornire la tempestiva divulgazione dei risultati dell’attività di ricerca, siano essi in forma provvisoria o definitiva. I Working Papers della Collana sono pubblicati nell’archivio istituzionale dell’Università degli studi di Bergamo (Aisberg): http://dspace-unibg.cilea.it/handle/10446/370..
(3) The accessibility of European regions and airport network Renato Redondiac, Paolo Malighettib and Stefano Palearib. a. Department of Mechanical Engineering, University of Brescia, Italy Department of Economics and Technology Management, University of Bergamo, Italy c Contact author: Department of Mechanical Engineering, University of Brescia, Viale Branze 38, 25123 Brescia, Italy; Phone (+39) 030 3715645; Fax (+39) 02 700529452; E-mail: [email protected] b. Abstract. The objective of this work is to evaluate the accessibility of European municipalities by ground and air transportation. We compute the quickest paths between any origin municipality and any destination municipality separated by more than 500 km. The total travel time includes three components: i) travel by car to reach the origin airport; ii) travel by air from the origin airport to the destination airport, including waiting times when no direct flight is available; and iii) travel by car from the destination airport to the municipality of destination. For each city, we calculate the average travel time to reach any other city in Europe, weighted by the populations of the destination cities. This statistic identifies which European regions are “remote” due to difficulties accessing the nearest airport and/or a limited offer of flights. Finally, based on the proportion of travel time spent reaching the origin airport and the extra ground travel time in routes that do not leave from the closest airport, we propose a general framework to evaluate policy options for improving the accessibility of remote regions. Key words: Accessibility; Remote regions; Airport Network..
(4) 1.. Introduction. Wegener et al. (2002) defined accessibility in terms of indicators that “describe the location of an area with respect to opportunities, activities or assets existing in other areas and in the area itself, where ‘area’ may be a region, a city or a corridor.” Evaluating the accessibility offered to citizens has always been an important issue for policy makers and regional governments, so a large body of literature has studied the relationship between accessibility and regional development (for example, Spiekermann and Wegener, 2006). The objective of this work is to study accessibility in terms of travel times between pairs of municipalities in Western Europe, taking into account both air and ground transportation. Previous studies on European intermodal accessibility have considered only NUTS2-3 regions (Lutter et al., 1992; Chatelus and Ulied, 1995; Wegener et al., 2000 and 2002; Spiekerman et al., 2002). This paper computes travel times in a much more detailed network with 76,498 distinct municipalities. Air transportation accounts for a significant portion of travel times between most pairs of municipalities. Burghouwt and Veldhuis (2006) employed air-side accessibility measures to evaluate the connectivity of European airports involved in the transatlantic market. Paleari et al. (2010) compared air-side accessibilities for Europe, US and China. Shaw (1993) and Shaw and Ivy (1994) studied the accessibility of the hub-and-spoke structure to US airline passengers. When computing travel times by air, this work employs a definition similar to that of Paleari et al. (2010): the total air travel time includes both flight times and waiting times spent in intermediate airports when no direct flight is available.. 2.
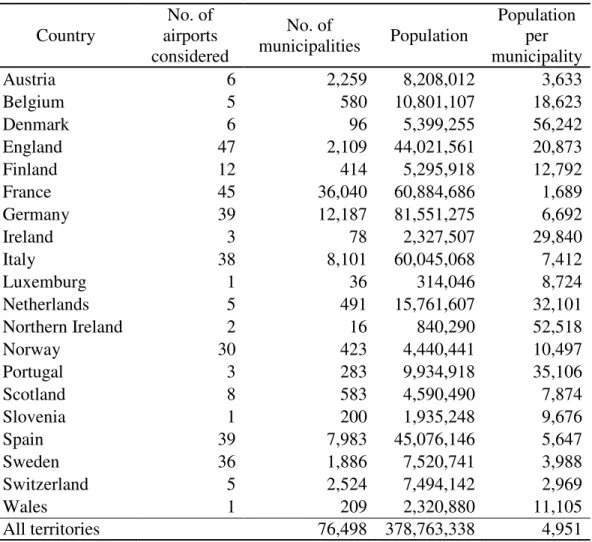
(5) The paper is organized as follows. The next section describes our methodology and dataset. Section 3 describes our empirical results on the overall accessibility of cities. In this section, we also identify remote regions and analyze the main components of travel times to and from such regions. Section 4 summarizes the main findings of the paper and describes how two statistics derived from travel times from remote regions can be used to find the optimal policy for improving accessibility. Section 5 concludes. 2.. Methodology and data. Table 1 shows the twenty Western European countries and territories covered by our analysis. Our dataset includes 76,498 different municipalities, with a total population of more than 378 million and an average population per municipality of about 5,000. This paper computes travel times for journeys between each pair of municipalities in the sample, including ground and air travel. The overall travel time to connect municipalities i and j, denoted ti,j, is separated into three components: 1). ti,o: travel time by car from the origin municipality (Mi) to the origin airport (Ao).. 2). to,d: travel time by air from the origin airport (Ao) to the destination airport (Ad).. If no direct flight is available between the origin and the destination airports, this component includes both flying times and waiting times in intermediate airports. To compute the minimum travel time to,d by air, we apply the methodology introduced by Malighetti et at. (2008). 3). td,j: travel time by car from the destination airport (Ad) to the destination. municipality (Mj). Before this analysis can begin, we need to link each municipality with the airports most likely to be employed by its population. We consider the two nearest airports for each. 3.
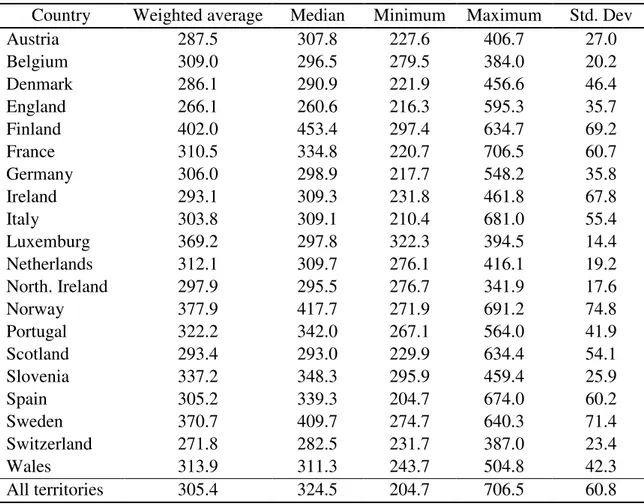
(6) municipality, in terms of travel times in 2010. We also include any other airports offering more than 50 routes (again, in 2010) within 200 km of the municipality. We do not consider travel times between pairs of municipalities whose distance is less than 500 km, since air travel is probably not necessary to complete the journey. Among all possible combinations of origin airport and destination airport for a given pair (i,j), we find those which give the minimum travel time ti,j= ti,o+ to,d+ td,j. In general, the most well-connected municipalities are close to airports linked by a direct flight. In contrast, remote municipalities often involve long travel times by car to reach the origin airport and/or an indirect flight to the destination airport. The accessibility index for a municipality, denoted ti, is defined as the populationweighted average travel time to all other municipalities: ni. ∑p ti =. j. ⋅ t ij. j=1 ni. ∑p. j. j=1. Here ni is the number of municipalities farther than 500 km from municipality i and pj is the population of municipality j. 3.. Empirical results. Table 2 reports our statistics on accessibility, grouping the municipalities by country or territory. The average accessibility index of a country depends on its geographical position with respect to the other countries. England is the most well-connected country in Western Europe, with the smallest weighted average travel time t. It is noteworthy that in terms of travel times, England is more accessible than countries that are. 4.
(7) geographically central such as Austria, Germany and Switzerland. As expected, the least connected countries are Finland, Norway and Sweden. Norway has the greatest variation in the weighted average travel times of individual municipalities, with a standard deviation of 74.8 minutes. Figure 1 shows the distribution of municipalities by accessibility index t. Almost 90% have a weighted average travel time less than 400 minutes. Given than the overall average is about 300 minutes (Table 2), the vast majority of municipalities have accessibility indexes not exceeding the average by more than 30-35%. However, the least connected municipalities have accessibility indexes exceeding 600 minutes, almost twice the average. Figure 2 shows the geographic distribution of the accessibility index. It shows that even municipalities located near the geographic center of Europe may have low accessibility. This phenomenon is more accentuated in France, where small airports tend to have just a few European connections. In Spain, low accessibility affects cities close to Portugal and those located midway between the seaside and Madrid. Table 3 aims to identify the remote territories. In particular, it shows the total populations of the least connected areas in each country, counting all municipalities with travel times above the 90%, 92.5%, 95%, 97.5% and 99% percentiles computed for the entire sample. Interestingly, Austria, Belgium, Luxemburg, Northern Ireland, Netherland and Switzerland do not have any municipality with an accessibility index above the 90% percentile. The countries with the largest populations in remote municipalities are the three Scandinavian countries (Sweden, Norway, and Finland) together with France, Spain, and Italy.. 5.
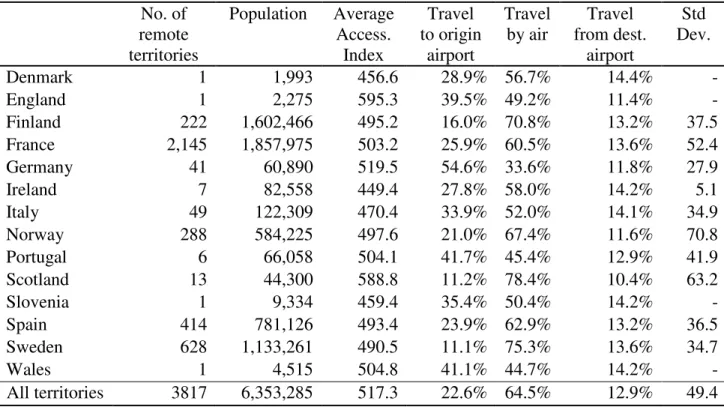
(8) The remainder of our analysis deals with those municipalities whose accessibility indexes are above the 95th percentile, meaning that their travel times are greater than 445.9 minutes. Henceforth, the term “remote territory” refers to one of these cities. The number of remote territories is 3,817, and their total population is more than 6 million. Following this definition, Austria, Belgium, Luxemburg, Netherland, Northern Ireland and Switzerland do not have any remote territories. In fact, from table 2 one would observe that their maximum accessibility indexes are lower than the limit of 445.9 minutes. In the following section we identify which variables are responsible for the long travel times of remote territories. 4.. Remote territories and policy implications. Table 4 shows statistics on travel times for remote territories. Interestingly, France comes first in terms of the total population in remote territories, followed by Finland and Sweden. All three countries have more than one million people living in their remote territories. Spain has about 780,000 people living in remote territories, and Norway has about 580,000. Table 4 also decomposes the travel times from remote territories into three components: i) travel to the origin airport, ii) travel by air, and iii) travel from the destination airport to the destination territory. (These components were defined in Section 2.) Long air travel times imply that the origin airports do not have direct flights to many destination airports, so travelers accumulate waiting time in intermediate airports. Long travel times to or from an airport indicate problems of geographical accessibility.. 6.
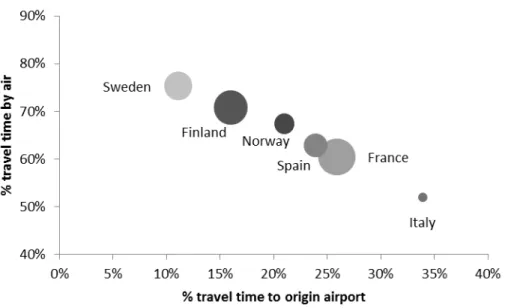
(9) For the six countries with the largest populations in remote territories, Figure 3 plots the percentage of travel time to the origin airport against the percentage of air travel time. For Sweden and Finland, the main factor contributing to long travel times is the quality of connections offered from origin airports. In Spain and France, on the other hand, the main problem is the excessive distance between remote territories and the most suitable origin airports. The division into land and air travel offers insight into the types of policy remedies that would be effective. When a country’s remote territories require long air travel times, their accessibility could be improved by increasing the origin airports’ offer of direct flights, especially to the major European airports (Redondi et al., 2010). However, this is not always the most effective policy. For example, it could be that an airport serving several remote territories is very small, with a very limited capacity. In this case, the bottleneck could be overcome by improving land-side accessibility to larger airports. When the main problem faced by remote territories is high travel times to reach origin airports, the most evident solution would be improving land-side infrastructure. For example, a government could improve existing roads or build new highways from remote regions to serve major airports. Another solution would be to create new airports to serve the remote regions. However, it could also be that the airports closest to remote territories are not often employed by the population, due to a low number of offered flights and destinations. If this is the case, travelers would sometimes drive to a farther airport with better connectivity. Thus, land travel times could also be reduced by increasing the connectivity of nearby airports.. 7.
(10) 4.1.. Statistical properties of remote regions. In order to better differentiate the policies required to improve the accessibility of remote regions, Table 5 provides detailed information regarding the land-side accessibility of origin airports in each country. The first column is the total population of remote territories in that country, and the second column is the average number of origin airports linked to each remote territory (see Section 2). From the methodology section, the minimum number of airports linked to each territory is two. The second and third columns describe the propensity of the population to use just one of the linked airports. The concentration is the value of the Herfindahl-Hirschman Index. A relatively high value of the concentration indicates that the remote territories tend to employ just one of their linked airports. The fourth column reports the percentage of the population that finds it quicker to travel to the closest airport, regardless of destination. Table 5 also reports the average travel time to reach the closest airport, and the average travel time to reach the linked airport or airports that are located farther away. In order to compare the connectivity of the closest airport with the connectivity of other potential origin airports, we define the following index: Cd=(1−%Pop)×∆TT Here %Pop is the percentage of the population that finds it quicker to employ the closest airport, reported in the 4th column of Table 5. ∆TT is the difference between the average travel time required to reach the closest airport and the average travel time to other airports, reported in the 5th and 6th columns of Table 5 respectively. We name Cd the “connectivity deficit” of the closest airport with respect to the other airports that serve the area. It measures the average time lost by a person living in one of. 8.
(11) the remote territories who has to use an airport farther from their community but with better connections than the closest airport. Among countries with a large population in remote territories, the connectivity deficit is highest for Italy, at 23.7 minutes. The value of this index is 20.4 minutes for Norway, and 14.4 minutes for Spain. The closest airports in these countries are not always employed as origin airports; on average, people living in these countries who require better connectivity will spend this much extra time travelling to reach farther airports. On the other hand, Finland has an index of 5.6 minutes while France has an index of merely 0.4 minutes. In these countries, the airports closest to remote regions are better equipped to serve their population. 4.2.. Policy implications. The connectivity deficit index allows us to distinguish between the possible causes of a large population in remote territories, as described at the beginning of Section 4. Based on this index and the percentage of total travel time spent reaching the origin airport, the following framework can point to the appropriate policy remedy. •. If the percentage of travel time to reach the origin airport is above average (see. Table 4), the priority is to reduce land-side travel time. o. If the connectivity deficit in the remote territories is below average (see Table 5),. it means that the airports are already well suited to serve the remote territories. To improve accessibility, the best policy is to improve roads and create new highways serving the airports. This is the case of France. o. If the connectivity deficit in the remote territories is above average (see Table 5),. the remote population is spending time traveling to airports that are farther away but. 9.
(12) have better connectivity. The priority of policy-makers should be to increase the closest airports’ offers of flights and destinations. The population will then choose the closest airport more often, and spend less time traveling by road. If the air service of the closest airports cannot be improved, the best policy is to improve land-side accessibility to larger but more distant airports. This is the case of Italy, Spain, and Portugal. It also applies to Germany, even though this country has a much lower population in remote territories. •. If the percentage of travel time by air is above average for remote territories (see. Table 4), the priority is to reduce air-side travel time. o. If the airports closest to remote territories have a below-average connectivity. deficit (see Table 5), it means they are already well placed to serve the remote population. The optimal policy is to increase the number of flights and destinations offered by the closest airports. If that is not possible, the government should improve both land- and air-side connectivity to larger airports farther away. This is the case of Finland. o. If the airports closest to remote territories have an above-average connectivity. deficit (see Table 5), it means that some of the population can shorten overall travel times by leaving from more distant airports. However, given that air travel time is already excessive, even the more distant origin airports do not have good air-side connections. The priority should be to increase the number of flights and destinations from those airports. An alternative policy is to improve the land-side accessibility of large airports in the remote region (those with the most extensive network of destinations). The risk of this policy is an increase in the time spent traveling to reach the origin airports. This is the case of Sweden.. 10.
(13) 5.. Conclusion. To the best of our knowledge, this work is the first to address the issue of accessibility in Western Europe at the municipality level. Our measure of accessibility is based all the overall travel times required to connect each pair of cities in the network, including ground travel to and from airports and waiting times between connecting flights when a direct flight is not available. The paper defines remote territories as municipalities whose average travel time to other cities is above the 95th percentile. Norway, France, Finland and Sweden suffer most from remoteness. We also propose a framework to evaluate the best policy options for alleviating travel times from remote territories. The first criterion is the average proportion of time spent traveling to an origin airport, and the second is the excess time spent in ground travel by those who need to leave from an airport that has better connections but is farther from their city. Based on these statistics, it is possible to determine whether improving landside infrastructure or increasing the number of routes offered by airports will have the greater impact on accessibility.. Acknowledgements We thank the participants of the 2011 ATRS conference in Sydney for their useful comments and suggestions. Any errors are our own.. 11.
(14) References. Burghouwt, G., Veldhuis J., 2006. The competitive position of hub airports in the Transatlantic market. Journal of Air Transportation, 11(1), 1071-30. Chatelus, G., Ulied, A., 1995. Union Territorial Strategies linked to the Transeuropean Transportation Networks, Final Report to DG VII, Paris/Barcelona, INRETSDEST/MCRIT, Lutter, H., Pütz, T., Spangenberg, M., 1992. Accessibility and Peripherality of Community Regions: The Role of Road, Long-Distance Railways and Airport Networks,. Report. to. the. European. Commission,. DG. XVI,. Bonn,. Bundesforschungsanstalt für Landeskunde und Raumordnung. Malighetti P., Paleari S., Redondi R., 2008. Connectivity of the European airport network: “self-help hubbing” and business implications. Journal of Air Transport Management, vol. 14; p. 53-65. Paleari S., Redondi R., Malighetti P., 2010. A comparative study of airport connectivity in China, Europe and US: which network provides the best service to passengers?. Transportation Research Part E – Logistics and Transportation, 46, 2, 198–210. Redondi R., Malighetti P., Paleari S., 2010. New routes and airport connectivity. Networks and Spatial Economics, DOI: 10.1007/s11067-010-9131-x. Shaw, S.-L., 1993. Hub structures of major US passenger airlines. Journal of Transport Geography, 1(1), 47-58. Shaw, S.-L., Ivy R.J., 1994. Airline mergers and their effects on network structure. Journal of Transport Geography, 2(4), 234-246. Spiekermann, K., Wegener, M., Copus, A., 2002. Review of Peripherality Indices and Identification of 'Baseline Indicator': Deliverable 1 of AsPIRE – Aspatial Peripherality, Innovation, and the Rural Economy. Dortmund/Aberdeen: S&W, IRPUD, SAC. Spiekermann K., Wegener M., 2006. Accessibility and Spatial Development in Europe. Scienze Regionali, 5, 15-46.. 12.
(15) Wegener, M., Eskelinnen, H., Fürst, F., Schürmann, C., Spiekermann, K., 2000. Indicators of Geographical Position. Final Report of the Working Group "Geographical Position" of the Study Programme on European Spatial Planning. Dortmund, IRPUD. Wegener M., Eskelinnen H., Fürst F., Schürmann C., Spiekermann K., 2002. Criteria for the Spatial Differentiation of the EU Territory: Geographical Position, Forschungen 102.2, Bundesamt für Bauwesen und Raumordnung, Bonn.. 13.
(16) List of Tables. Table 1. Countries, municipalities and populations covered by the analysis. Year 2010. No. of Population No. of Country airports Population per municipalities considered municipality Austria 6 2,259 8,208,012 3,633 Belgium 5 580 10,801,107 18,623 Denmark 6 96 5,399,255 56,242 England 47 2,109 44,021,561 20,873 Finland 12 414 5,295,918 12,792 France 45 36,040 60,884,686 1,689 Germany 39 12,187 81,551,275 6,692 Ireland 3 78 2,327,507 29,840 Italy 38 8,101 60,045,068 7,412 Luxemburg 1 36 314,046 8,724 Netherlands 5 491 15,761,607 32,101 Northern Ireland 2 16 840,290 52,518 Norway 30 423 4,440,441 10,497 Portugal 3 283 9,934,918 35,106 Scotland 8 583 4,590,490 7,874 Slovenia 1 200 1,935,248 9,676 Spain 39 7,983 45,076,146 5,647 Sweden 36 1,886 7,520,741 3,988 Switzerland 5 2,524 7,494,142 2,969 Wales 1 209 2,320,880 11,105 All territories 76,498 378,763,338 4,951. 14.
(17) Table 2. Accessibility statistics by country (in minutes). Median Minimum Country Weighted average Austria 287.5 307.8 227.6 Belgium 309.0 296.5 279.5 Denmark 286.1 290.9 221.9 England 266.1 260.6 216.3 Finland 402.0 453.4 297.4 France 310.5 334.8 220.7 Germany 306.0 298.9 217.7 Ireland 293.1 309.3 231.8 Italy 303.8 309.1 210.4 Luxemburg 369.2 297.8 322.3 Netherlands 312.1 309.7 276.1 North. Ireland 297.9 295.5 276.7 Norway 377.9 417.7 271.9 Portugal 322.2 342.0 267.1 Scotland 293.4 293.0 229.9 Slovenia 337.2 348.3 295.9 Spain 305.2 339.3 204.7 Sweden 370.7 409.7 274.7 Switzerland 271.8 282.5 231.7 Wales 313.9 311.3 243.7 All territories 305.4 324.5 204.7. Maximum 406.7 384.0 456.6 595.3 634.7 706.5 548.2 461.8 681.0 394.5 416.1 341.9 691.2 564.0 634.4 459.4 674.0 640.3 387.0 504.8 706.5. Table 3. Identification of remote territories. Population in Remote municipality Percentile 90.0% 92.5% 95.0% 97.5% Travel time limit 408.0 421.1 445.9 487.9 Denmark 2,089 1,993 1,993 England 40,022 5,999 2,275 2,275 Finland 2,386,398 2,218,248 1,602,466 876,529 France 3,908,435 3,132,755 1,857,975 992,279 Germany 211,778 82,304 60,890 55,650 Ireland 316,869 290,308 82,558 Italy 2,290,288 1,323,297 122,309 15,498 Norway 1,046,552 853,572 584,225 239,851 Portugal 471,728 291,870 66,058 29,721 Scotland 56,600 49,630 44,300 42,420 Slovenia 16,883 16,883 9,334 Spain 2,422,075 1,616,118 781,126 378,091 Sweden 2,396,662 2,028,237 1,133,261 575,144 Wales 64,831 49,737 4,515 4,515 Number of 7,634 5,725 3,817 1,909 territories Population 15,631,210 11,960,951 6,353,285 3,211,973. 15. Std. Dev 27.0 20.2 46.4 35.7 69.2 60.7 35.8 67.8 55.4 14.4 19.2 17.6 74.8 41.9 54.1 25.9 60.2 71.4 23.4 42.3 60.8. 99.0% 536.5 2,275 178,535 320,457 8,903 6,170 125,144 29,721 41,800 91,381 77,271 764 881,657.
(18) Table 4. Statistics on travel times for remote territories (travel times in minutes). No. of Population Average Travel Travel Travel remote Access. to origin by air from dest. territories Index airport airport Denmark 1 1,993 456.6 28.9% 56.7% 14.4% England 1 2,275 595.3 39.5% 49.2% 11.4% Finland 222 1,602,466 495.2 16.0% 70.8% 13.2% France 2,145 1,857,975 503.2 25.9% 60.5% 13.6% Germany 41 60,890 519.5 54.6% 33.6% 11.8% Ireland 7 82,558 449.4 27.8% 58.0% 14.2% Italy 49 122,309 470.4 33.9% 52.0% 14.1% Norway 288 584,225 497.6 21.0% 67.4% 11.6% Portugal 6 66,058 504.1 41.7% 45.4% 12.9% Scotland 13 44,300 588.8 11.2% 78.4% 10.4% Slovenia 1 9,334 459.4 35.4% 50.4% 14.2% Spain 414 781,126 493.4 23.9% 62.9% 13.2% Sweden 628 1,133,261 490.5 11.1% 75.3% 13.6% Wales 1 4,515 504.8 41.1% 44.7% 14.2% All territories 3817 6,353,285 517.3 22.6% 64.5% 12.9% Table 5. Statistics on land-side accessibility for remote territories (travel times in minutes). Populatio No. of No. of Concentr % pop. Travel Travel Connectivit . to time to n Territ. origin time y airport by origin closest other deficit of to the s airports airport closest airports the closest airport airport (Cd) Denmark 1,993 1 2.0 8,080 89.2% 124 201 8.3 England 2,275 1 3.0 8,824 0.0% 193 237 43.5 Finland 1,602,46 222 2.7 7,992 78.0% 74 99 5.6 6 France 1,857,97 2,145 1.9 8,217 84.8% 133 136 0.4 5 Germany 60,890 41 4.0 7,497 16.9% 119 319 166.2 Ireland 82,558 7 3.0 6,675 79.6% 109 191 16.8 Italy 122,309 49 3.9 4,667 40.6% 138 178 23.7 Norway 584,225 288 2.0 8,104 75.0% 63 145 20.4 Portugal 66,058 6 2.6 7,713 52.3% 201 227 12.7 Scotland 44,300 13 2.8 9,905 76.7% 77 85 1.9 Slovenia 9,334 1 1.0 10,000 100.0% 163 Spain 781,126 414 2.6 7,208 62.8% 105 144 14.4 Sweden 1,133,26 628 2.1 8,563 81.0% 44 101 10.9 1 Wales 4,515 1 2.0 5,790 30.1% 196 213 11.9 All 6,353,28 3,817 2.2 8,021 79.6% 114 141 6.9 territories 5. 16. Std Dev. 37.5 52.4 27.9 5.1 34.9 70.8 41.9 63.2 36.5 34.7 49.4.
(19) List of Figures. Figure 1.. Distribution of territories by accessibility index.. Figure 2.. Accessibility index by municipality. municipality. 17.
(20) Figure 3. Proportions of travel times in remote regions due to road travel and air travel .. 18.
(21)
Figura

+2
Documenti correlati
Here, to better understand the beginning of the process that leads to aberrant protein oligomerization, the solution secondary structure and residue-level dynamics of WT h-ANG and
Comparison of one- and 12-month outcomes of transcatheter aortic valve replacement in patients with severely ste- notic bicuspid versus tricuspid aortic valves (results from
According to the Endocrine Society‟s Clinical Guidelines for the diagnosis of Cushing‟s syndrome and the AACE/AAES Medical Guidelines for the Management of Adrenal
We frame our approach in terms of the work on affect by Maxine Sheets- Johnstone (2009a; 2009b; 2012) and Brian Massumi (2002; 2015), in order to (1) explicate the relation
A previous experimental study on the Portuguese population of Ascophyllum nodosum showed that high intensities of human trampling can negatively affect the mean abundance of
The positive effects of EMNCs’ tangible resources on the post-acquisition performance of target firms in developed economies are enhanced when EMNCs have experience in
