Limnol. Oceanogr., 47(5), 2002, 1514–1521
q 2002, by the American Society of Limnology and Oceanography, Inc.
Maximum rates of N
2fixation and primary production are out of phase in a developing
cyanobacterial bloom in the Baltic Sea
Abstract—Although N2-fixing cyanobacteria contribute
sig-nificantly to oceanic sequestration of atmospheric CO2, little
is known about how N2fixation and carbon fixation (primary
production) interact in natural populations of marine cyano-bacteria. In a developing cyanobacterial bloom in the Baltic Sea, rates of N2 fixation (acetylene reduction) showed both
diurnal and longer-term fluctuations. The latter reflected fluc-tuations in the nitrogen status of the cyanobacterial population and could be correlated with variations in the ratio of acetylene reduced to15N
2assimilated. The value of this ratio may
pro-vide useful information about the release of newly fixed nitro-gen by a cyanobacterial population. However, although the diurnal fluctuations in N2 fixation broadly paralleled diurnal
fluctuations in carbon fixation, the longer-term fluctuations in these two processes were out of phase.
Marine cyanobacteria make a major contribution to both the global carbon (Waterbury et al. 1979) and nitrogen (Ca-pone et al. 1997; Zehr et al. 2001) cycles. Indeed, the activity of N2-fixing marine cyanobacteria may be a key factor
in-fluencing the ability of the oceans to sequester atmospheric CO2 (Falkowski 1997). However, these organisms can also
have a negative effect on the environment. For example, every year, massive blooms of N2-fixing cyanobacteria occur
in the Baltic Sea (Kahru et al. 1994), and, when they decay, they can have a damaging effect on fish stocks and an ad-verse effect on the recreational use of the Baltic coastal zone (Edler et al. 1985; Sellner 1997). Herein we describe a de-tailed study made on a cyanobacterial bloom in the Baltic Sea during the summer of 1998 as part of the development of an integrated model that will enable us to predict how growth, primary productivity, N2fixation, and toxin
produc-tion might respond to a changing environment. Our findings shed new light on how rates of N2fixation and primary
pro-duction might fluctuate in a bloom of Baltic cyanobacteria, the extent to which these processes are coupled, and how these fluctuations may affect measurements of N2 fixation.
In addition, a rational explanation is proposed for the wide variations observed between estimates of N2fixation based
on acetylene reduction and on 15N
2 assimilation (Peterson
and Burris 1976; Montoya et al. 1996).
Methods—Sample station and water chemistry: The ex-periment was carried out between 6 and 11 July 1998 by following a drifting array with an attached sediment trap at 33 m. The study site was at 568189N, 198059E, southeast of the Swedish island of Gotland. The experimental measure-ments were made over three 24-h periods, starting respec-tively at 0400 h (local time) on 6 (day 1), 8 (day 3), and 10 (day 5) July. Analysis of the water for NO , NO , NH ,2 2 1
3 2 4
and dissolved inorganic P was performed as described by Grasshoff (1976), by use of samples collected in 5-liter
bot-tles connected to a conductivity, temperature, and depth ro-sette sampler (General Oceanics).
Sampling: During each experimental day, samples were collected by a vertical tow every 4 h from three different depths (0–7, 7–14, and 14–21 m) by use of a 100-mm Ap-stein plankton net fitted with a closing device (Hydrobios). This ensured that the large aggregates of N2-fixing
cyano-bacteria were collected but excluded the smaller unicellular cyanobacteria. Collected samples were suspended in 2 liters of filtered (Whatman GF/F, 47 mm) seawater. Aliquots were then removed for the various analyses described below. Where analyses were not performed immediately, samples were immediately frozen and remained frozen during trans-portation to the laboratory.
Analysis of cyanobacterial cells: Particulate organic car-bon (POC) and particulate organic nitrogen were measured on 50-ml samples by use of the improved methods of Sharp (1974), chlorophyll a as described by Barlow et al. (1997), and phycobiliproteins (PBP) as described by Bennett and Bogorad (1973). The intracellular ratio of glutamine to glu-tamate (GLN : GLU) was measured by analysis of 50 ml of cyanobacterial material that had been retained on a 20-mm filter and suspended in 1 ml of deionized water (Flynn 1988). For sodium dodecyl sulfate (SDS)/polyacrylamide gel elec-trophoresis (PAGE) and Western immunoblotting of the Fe protein of nitrogenase, 50-ml samples were collected on a 20-mm filter and suspended in 0.5 ml of 10 mM Tris-HCl buffer (pH 8.0) that contained 1 mM ethylene diaminete-traacetic acid and 25 g L21 SDS. The samples were then
boiled for 5 min and frozen for transportation to the labo-ratory. After thawing, 2-mercaptoethanol was added to 50 g L21and bromophenol blue to 0.1 mg L21. The samples were
then sonicated for 5 min (Reade et al. 1999), reboiled for 5 min, and centrifuged at 13,000 3 g for 2 min. SDS/PAGE and Western blot analysis were performed on the supernatant as described by Reade et al. (1999).
N2fixation: Acetylene reduction was measured on board
according to the method of Gallon et al. (1993) as described by Evans et al. (2000). Samples (2 ml) were incubated on deck in sealed 10-ml glass vials in an incubator that was maintained at the temperature of the surface water, either at the in situ photon flux density (achieved by use of natural illumination and neutral density filters) or under saturating illumination of 100mmol photons m22s21(provided by
Os-ram white fluorescent lights) during the period of assay. As-similation of 15N
2 was measured under identical conditions
with use of completely filled, sealed 250-ml Duran glass bottles, as described by Montoya et al. (1996). For mea-surement of the response of acetylene reduction to photon fluence rate, the continuous flow system described by Staal et al. (2001) was used.
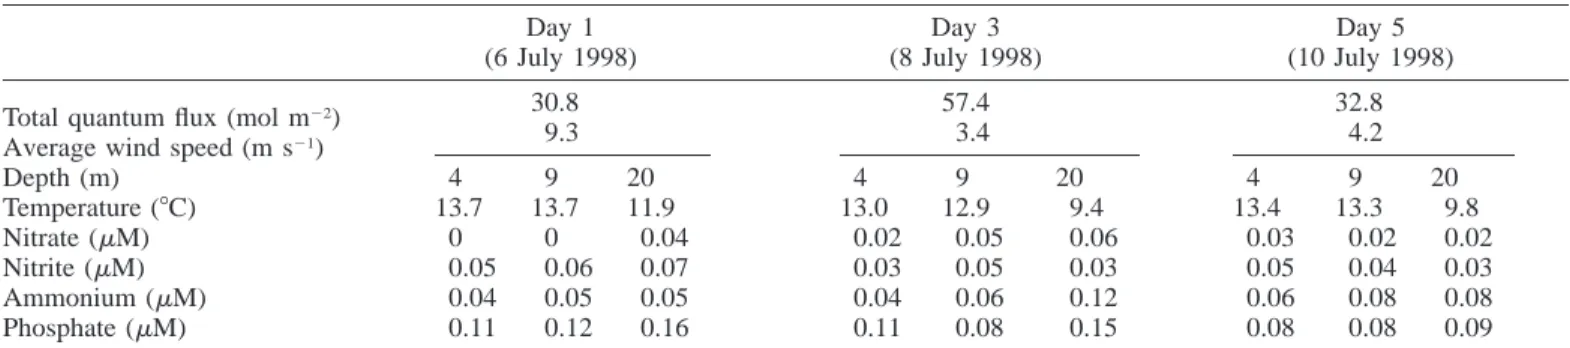
Table 1. Physical conditions and water chemistry at the sample site in the Baltic Sea. Day 1 (6 July 1998) Day 3 (8 July 1998) Day 5 (10 July 1998) Total quantum flux (mol m22)
Average wind speed (m s21)
30.8 9.3 57.4 3.4 32.8 4.2 Depth (m) Temperature (8C) Nitrate (mM) Nitrite (mM) Ammonium (mM) Phosphate (mM) 4 13.7 0 0.05 0.04 0.11 9 13.7 0 0.06 0.05 0.12 20 11.9 0.04 0.07 0.05 0.16 4 13.0 0.02 0.03 0.04 0.11 9 12.9 0.05 0.05 0.06 0.08 20 9.4 0.06 0.03 0.12 0.15 4 13.4 0.03 0.05 0.06 0.08 9 13.3 0.02 0.04 0.08 0.08 20 9.8 0.02 0.03 0.08 0.09
Table 2. Markers of cyanobacterial biomass in a cyanobacterial bloom in the Baltic Sea. Particulate organic carbon (POC), particulate organic nitrogen (PON), Chl a are expressed as mg m22and phycobiliproteins (PBP) asmg m22.
Depth (m) Day 1 POC PON Chl a PBP Day 3 POC PON Chl a PBP Day 5 POC PON Chl a PBP 0–7 7–14 14–21 11.2 8.37 5.71 1.70 1.32 0.96 1.45 0.59 0.41 36.7 16.7 16.3 14.1 6.32 3.88 2.37 1.07 0.74 1.53 0.78 0.22 51.2 31.6 14.8 22.9 8.36 3.88 3.91 1.47 0.70 2.41 0.84 0.43 88.9 22.6 14.6
4 h with 0.26 MBq (0.11 mmol) NaH14CO
3 in sealed
250-ml acid-washed polycarbonate Erlenmeyer flasks. The con-ditions of incubation were as described for acetylene reduc-tion. Primary production was then measured according to the method of Fitzwater et al. (1982).
Results and discussion—At the sample site, day length was;17.5 h, whereas the weather conditions were variable, being cloudy and stormy on day 1, sunny and breezy on day 3, and cloudy and breezy on day 5 (see Table 1). Above the thermocline, which occurred between 15 and 40 m below the surface, the water column had a temperature close to 138C throughout the experimental period. Despite the rough weather on day 1, there was no evidence that extensive mix-ing had occurred below 15 m. Moreover, the drift track was unaffected by surface weather conditions. The extinction co-efficient of the water column was 0.353, so that at 3.5 m (the average depth for the 0–7 m fraction), the prevailing irradiance was 65% of that at the surface. For depths of 10.5 (average depth for the 7–14 m fraction) and 17.5 (average depth for the 14–21 m fraction) m, the equivalent values were 7.5% and 0.9% of surface irradiance, respectively.
Nutrient analysis of the water (Grasshoff 1976) revealed that there were no substantial fluctuations in the concentra-tions of NO , NO , and NH (Table 1). Dissolved inorganic2 2 1
3 2 4
P was significant but not high. Some fluctuations were ob-served, but these were not consistent. The relative constancy of these nutrients supports the view that a single body of water had been followed throughout the experiment. The ra-tio of dissolved inorganic N to dissolved inorganic P was consistently,2. This value is well below the Redfield ratio of 16 and implies that growth of N2-fixing cyanobacteria
might be expected.
Biomass data (POC, Chl a, and PBP) all supported the view that most of the large cyanobacteria were in the upper 0–7 m of the water column (Table 2). There was a large
accumulation of material in the upper zone by the end of the experiment, as was confirmed visually by the accumulation of cyanobacteria at the water surface. It appeared, therefore, that the period of the experiment coincided with the for-mation of a surface cyanobacterial bloom. The biomass in the upper layer approximately doubled between day 1 and day 5. This increase was too great to be explained simply by upward drift of cyanobacteria from the deepest zone, which showed a decline of no more than 32% over the same period (Table 2). It seems most likely, therefore, that the increase in biomass largely reflected synthesis of new cells, although the possibility of lateral advection cannot definitely be excluded. This increase in cyanobacterial biomass was due mainly to an increase in the toxic heterocystous cya-nobacterium Nodularia spumigena (Barker et al. 1999). Be-tween days 1 and 5, the population of N. spumigena (56.6% of the cyanobacterial biovolume on day 1) and Anabaena sp. (1.4% of the cyanobacterial biovolume on day 1) in-creased by a factor of 4.7 and 3.9, respectively, whereas that of Aphanizomenon sp. (42.2% of the cyanobacterial biovol-ume on day 1) increased by a factor of only 1.5 (Congestri et al. 2000).
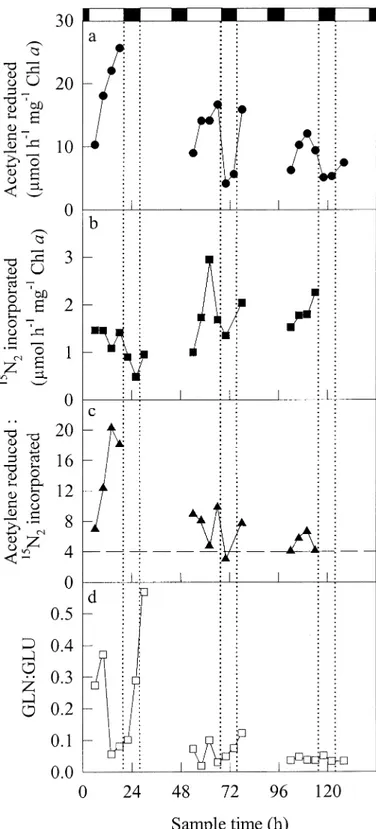
Under in situ conditions, the highest specific rates of N2
fixation, measured by use of the acetylene reduction tech-nique, were found in the upper 7 m of the water column, with peak activity occurring between 1200 and 2000 h each day (Fig. 1a). N2fixation was consistently low (although not
absent) during the hours of darkness. In cells sampled from depths of 7–14 m, rates of N2fixation were lower, but the
overall pattern of activity was similar to that in cells from the upper layer (Fig. 1c). Cells from the lowest depth (14– 21 m) showed the lowest nitrogenase activity per unit of Chl a and smaller fluctuations in activity (Fig. 1e). The fact that Baltic cyanobacteria exhibited nitrogenase activity during the dark period and also at depths where the prevailing level of illumination was low suggests that cells can sustain N2
Fig. 1. N2fixation (acetylene reduction) by cyanobacteria
sam-pled from a bloom in the Baltic Sea between 6 and 11 July 1998 (days 1–5). Samples were collected by vertical tows between (a, b) 0–7, (c, d) 7–14, and (e, f) 14–21 m, resuspended in filtered sea-water, and incubated (a, c, e) either at the in situ photon flux density or (b, d, f) under saturating illumination of 100mmol photons m22 s21during the period of assay. In panel a, solid circles show acet-ylene reduction in the absence of additions, and open circles show acetylene reduction in the presence of 0.1 mg ml21 chlorampheni-col, added at the start of each incubation. Zero time corresponds to 0000 h (local time) on 6 July 1998. The shaded areas and their associated dotted lines represent nighttime during the experimental period.
Table 3. Parameters relating to the response of acetylene reduc-tion to photon fluence rate for cyanobacteria sampled from a bloom in the Baltic Sea. Samples were collected from the depth ranges indicated on 9 July 1998 at 0400 h. Acetylene reduction was mea-sured over the irradiance range 0–877mmol m22s21. I
Krepresents
the irradiance at which rates of N2 fixation were 63.2% of
maxi-mum.
Parameter
Depth (m)
0–7 7–14 14–21
IK(mmol m22s21) 25.7 30.2 16.4
Maximum total rate of acetylene
re-duction (mmol h21mg21Chl a) 22.00 12.63 4.94 Rate of acetylene reduction in dark
(mmol h21mg21Chl a) 9.49 5.12 2.29
Fig. 2. Western immunoblot after SDS/PAGE of extracts of N. spumigena collected at 0–7 m from a bloom in the Baltic Sea on 6–7 July 1998 (day 1). Each sample contained 25 mg of protein, and the blot was developed by use of antisera to the Fe protein of nitrogenase from Rhodospirillum rubrum. The two forms of the Fe protein that reacted with the antisera had approximate Mrvalues of
38,500 (upper band) and 36,000 (lower band).
fixation, at least to a limited extent, by metabolic processes that operate in the dark.
Over and above the observed diurnal fluctuations, how-ever, rates of acetylene reduction per unit of Chl a were high on day 1 but declined during days 3 and 5. This was espe-cially obvious in cells sampled in the depth range 0–7 m.
For all sample depths, the specific rates of acetylene re-duction (normalized to Chl a) were maximal above a photon flux density of 100mmol m22s21. However, the value of I
K
varied with sample depth (Table 3). The maximum surface irradiance recorded during the experiment was 2,122 mmol m22s21, observed between 1254 and 1300 h on day 3. This
corresponds to 1,379mmol m22s21at 3.5 m, 159mmol m22
s21 at 10.5 m, and 19 mmol m22 s21 at 17.5 m, so, at least
down to 10.5 m, Baltic Sea cyanobacteria would receive sufficient illumination to support maximum rates of N2
fix-ation for at least part of the day. Nevertheless, in samples from deeper waters, the specific rates of nitrogenase activity, measured either under saturating illumination or in the dark, were always lower than the corresponding rates seen in
sam-ples from surface waters (Table 3). This was particularly apparent in cells sampled below the mixed layer but was also seen in the fraction from 7 to 14 m, which implies rapid adaptation to the intensity of illumination at the depth from which they were sampled. This behavior may reflect physi-ological differences between cyanobacteria at different depths, or it may be that a large part of the biomass (Chl a) collected from deeper waters does not contribute to N2
fix-ation.
Even when sampled cyanobacteria were incubated under saturating illumination at 100mmol photons m22s21during the period of assay, nitrogenase activity was often lower at night than during the day (Fig. 1b,d,f). This suggests that the amount of nitrogenase per unit of Chl a may vary during a 24-h cycle in these populations. In the case of the Fe pro-tein of nitrogenase, this was demonstrated directly by SDS/ PAGE coupled to immunoblotting, which showed that intra-cellular concentrations of this protein were highest in N. spu-migena during the morning and lower during the afternoon and evening, although the Fe protein never completely dis-appeared from cells even during the dark period (Fig. 2). Furthermore, 0.1 mg ml21 of chloramphenicol (an inhibitor
of protein synthesis) was more inhibitory to N2fixation
dur-ing the morndur-ing than at any other time (Fig. 1a), which im-plies that nitrogenase was being actively synthesized during
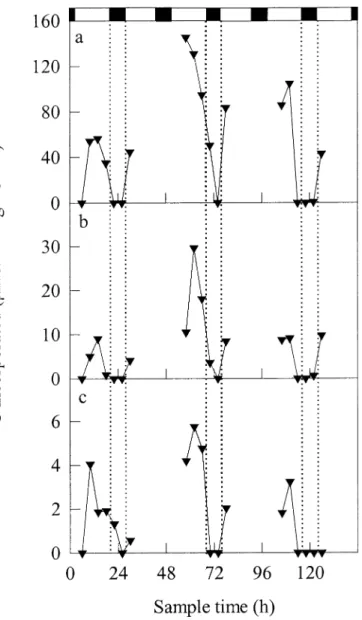
Fig. 3. Relationship between acetylene reduction and assimilation of 15N
2 in cyanobacteria sampled from a bloom in the Baltic Sea
between 6 and 11 July 1998 (days 1–5). Samples were collected at 0–7 m. Measurements of (a) acetylene reduction, (b) assimilation of15N
2, (c) the ratio of acetylene reduced to15N2incorporated, and
(d) intracellular GLN : GLU were all made at the in situ photon flux density. Zero time corresponds to 0000 h (local time) on 6 July 1998. The shaded areas and their associated dotted lines represent nighttime during the experimental period, whereas the horizontal dashed line in panel c represents the theoretical value (4 : 1) of the ratio between acetylene reduced and15N
2incorporated. this period. Significantly, however, the maximum rates of
nitrogenase activity, seen under illumination at 100 mmol photons m22 s21, did not appear to be much higher in
sam-ples from 0–7 m on day 1 than on days 3 and 5 (Fig. 1b). This implies that the lower activity seen during days 3 and 5 when cells were assayed under in situ conditions (Fig. 1a) reflected a relative decrease in the rate of N2fixation
inde-pendent of the amount of enzyme per cell. In contrast, how-ever, the smaller decline in activity seen in samples from deeper waters as the experiment progressed was observed both under in situ conditions and under saturating illumi-nation (Fig. 1c–f).
As in other cyanobacteria, the Fe protein of nitrogenase from N. spumigena could be resolved by SDS/PAGE into two forms of different Mr (Fig. 2). The larger form was
consistently less abundant than the smaller form, and there was no evidence that the relative concentrations of the two forms varied during the 24-h period of study. It would be premature, therefore, to suggest that the observed fluctua-tions in nitrogenase activity were related to any shift be-tween different forms of the Fe protein, as has been sug-gested for Anabaena variabilis (Ernst et al. 1990), Oscillatoria limosa (Villbrandt et al. 1992), and Trichodes-mium (Zehr et al. 1993).
Acetylene reduction is used universally as a means of measuring N2fixation (Turner and Gibson 1980). It relies on
the fact that nitrogenase is the only enzyme that reduces acetylene to ethylene. As was discussed by Montoya et al. (1996), the theoretical ratio between the rate of acetylene reduction and that of reduction of N2is 4 : 1. However, when
rates of acetylene reduction are compared directly with rates of N2 fixation determined from incorporation of
15N 2 into
cellular material, the ratio of acetylene reduced to 15N 2
in-corporated frequently deviates from this theoretical value (Peterson and Burris 1976; Turner and Gibson 1980). In this study, a natural population of Baltic cyanobacteria gave a high value for this ratio (up to 20 : 1) during day 1, although during days 3 and 5, the ratio declined toward its theoretical value of 4 (Fig. 3).
Measurement of N2fixation that uses 15N
2depends on the
analysis of 15N incorporated into cells. Any released 15N
would not be taken into account. Thus, if the population under investigation was releasing a portion of its newly fixed nitrogen, the 15N assay would underestimate the actual
amount of N2fixed. Measurement of nitrogenase activity by
acetylene reduction does not suffer from this disadvantage, so, under these circumstances, the measured ratio of acety-lene reduced to15N
2incorporated would become greater than
that theoretically expected. In support of such an explanation for the high value of this ratio during day 1 of the present study, there is evidence that, when fixing N2, cyanobacteria,
including N. spumigena (A. M. Evans unpubl. data), release nitrogenous material, notably as NH (Mulholland and Ca-1
4
pone 2001) and amino acids (Flynn and Gallon 1990; Glibert and Bronk 1994). The observation that Baltic cyanobacteria fix more N2than is needed to support their estimated rate of
growth (Larsson et al. 2001) suggests that they also release newly fixed nitrogen in situ. Thus, the high rate of nitroge-nase activity during day 1 (Fig. 1a) may well result in a large release of newly fixed nitrogen. In contrast, the release
Fig. 4. Primary production by cyanobacteria sampled from a bloom in the Baltic Sea between 6 and 11 July 1998 (days 1–5). Samples were collected from (a) 0–7, (b) 7–14, and (c) 14–21 m. Zero time corresponds to 0000 h (local time) on 6 July 1998. The shaded areas and their associated dotted lines represent nighttime during the experimental period.
of fixed nitrogen would be much lower during days 3 and 5. An underestimation of the true rate of N2fixation by the 15N
2 assay would therefore be much greater during day 1
than during days 3 and 5 and could explain the high ratios of acetylene reduced to15N
2incorporated seen during day 1.
To the best of our knowledge, this is the first demonstration that the ratio between acetylene reduction and 15N
2
incor-poration may vary with time in a specific natural population of cyanobacteria and also that this variation may have a physiological basis. These findings also suggest that, al-though 15N analysis accurately measures incorporation of 15N
2 into cellular material, measurements of acetylene
re-duction more truly reflect the gross rate of N2fixation.
The amino acids glutamate and glutamine constitute the primary link between N-metabolism and C-metabolism, and monitoring of the intracellular concentrations of glutamate and glutamine can provide a sensitive means of assessing the N-status of cells. The ratio of glutamine to glutamate (GLN : GLU) is higher in N-replete cells than in N-stressed cells (Flynn et al. 1989) and, in N2-fixing cyanobacteria,
re-sponds rapidly to changes in intracellular N-status. For ex-ample, the addition of 0.1 mM NH4Cl to N2-fixing cultures
of Gloeothece dramatically increased GLN : GLU within 1 h (Flynn and Gallon 1990). In the present study, the cyano-bacteria sampled at 0–7 m showed a clear difference in GLN : GLU between day 1 and days 3 and 5 (Fig. 3d). By the end of day 1, the population had become relatively N-replete, probably because of the high rates of N2fixation that
were observed during that day (Fig. 3a). This would also explain how cells might be able to release amino acids at that time and thereby the high values of the ratio of acetylene reduced to 15N incorporated seen during day 1 (Fig. 3c). In
addition, the dramatic decline in GLN : GLU that occurs be-tween 1000 and 1400 h on day 1 (Fig. 3d) correlates well with the peak value of the ratio of acetylene reduced to15N
incorporated (Fig. 3c) and might therefore reflect a release of newly fixed nitrogen that results from the high rates of nitrogenase activity (acetylene reduction) observed during the preceding few hours (Fig. 3a). During days 3 and 5, however, the cells appeared to be more N-stressed than dur-ing day 1.
The change in the ratio of acetylene reduced to 15N 2
in-corporated (Fig. 3c) reflects both a decrease in the rate of acetylene reduction (Fig. 1a) and an increase in the rate of
15N
2incorporated into the cells (Fig. 3b). Although the
for-mer probably reflects a decline in nitrogenase activity during the course of the experiment, the latter may be explained in terms of decreased release of newly fixed nitrogen. The de-cline in nitrogenase activity broadly parallels the increase in nitrogen stress implied by the changes in GLN : GLU (Fig. 3d), but whether increased N-stress is caused by, or causes, a decline in nitrogenase activity is not clear.
Specific rates of primary production (incorporation of NaH14CO
3) were greatest in the upper 7 m of the water
col-umn (Fig. 4), peaked around noon, and declined to zero at night. In this respect, primary production broadly paralleled the observed 24-h fluctuations in N2fixation. However, over
the longer term, it appeared that 14C incorporation behaved
differently from gross N2fixation, measured as acetylene
re-duction. In the case of the population at 0–7 m, this
differ-ence was especially apparent during day 1, when rates of acetylene reduction were high (Fig. 1a), whereas those of primary production were relatively low (Fig. 4a). This un-coupling between the two processes was much less apparent during the latter part of day 3 and during day 5, when the rates of acetylene reduction and 14C incorporation more
closely paralleled each other. During day 1, it appears that metabolic energy was used preferentially to support N2
fix-ation at the expense of primary production.
It should be noted, however, that, just as incorporation of
15N
2into cyanobacterial biomass can underestimate gross N2
fixation, so 14C-incorporation can underestimate the gross
rate of photosynthetic C fixation. Cyanobacteria release C-compounds such as glycolate (Renstro¨m-Kellner and Berg-man 1989) as well as N-compounds, and the release of
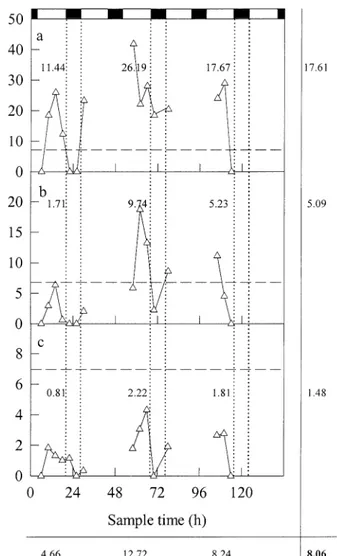
ami-Fig. 5. Ratio of incorporation of14C (primary production) to
in-corporation of15N in cyanobacteria sampled from a bloom in the
Baltic Sea between 6 and 11 July 1998 (days 1–5). Primary pro-duction and assimilation of15N
2were measured in samples collected
from (a) 0–7, (b) 7–14, and (c) 14–21 m (see Figs. 3 and 4 for details). Zero time corresponds to 0000 h (local time) on 6 July 1998. The shaded areas and their associated dotted lines represent nighttime during the experimental period, whereas the horizontal dashed lines represent the value of the Redfield ratio of C : N (6.9) for phytoplankton (Redfield 1958; Falkowski 2000). The numbers in the field show the average value for the ratio for that particular group of data, those to the right of the graph show the means for each sample depth, and those below the graph show the means for each experimental day. The overall mean value is shown at the bottom right corner.
no acids, for example, represents release of both C and N. Even so, however, the relative rates of C and N assimilation are not closely coupled. The ratio of incorporation of 14C
(primary production) to that of 15N varied from day to day
and with depth, being maximal during day 3 in the popu-lation at 0–7 m and minimal during day 1 in the popupopu-lation at 14–21 m (Fig. 5). At 8.06, the average value of the ratio at all sample times and at all depths throughout this exper-iment was reasonably close to the Redfield ratio of C : N for phytoplankton (6.9). Nevertheless, it is apparent that
cyano-bacterial blooms in the Baltic Sea oscillate between periods when N2fixation is favored over C assimilation (for
exam-ple, during day 1) and vice versa (during day 3). The high rates of 14C incorporation (relative to those of 15N
incorpo-ration) in the upper 0–7 m of the water column may, fur-thermore, result in an accumulation of carbon reserves that could be mobilized to support N2fixation in deeper waters
after a mixing event.
In the photic zone, nitrogenase activity in Baltic cyano-bacteria is higher during the day than at night, although it never falls to zero. This 24-h fluctuation is, as might be expected, much less apparent in samples from deeper water, where the light intensity experienced during the day is much lower. These fluctuations reflect, at least in part, fluctuations in the concentration of nitrogenase in the cyanobacterial cells, which implies a regulation of nitrogenase synthesis and/or degradation. However, superimposed on these 24-h fluctuations is a variation in nitrogenase activity that takes place over several days. Cyanobacteria sampled during day 1 were more active in N2fixation (acetylene reduction) and,
relatively, more N-replete than were cells sampled on days 3 and 5. This may be only one phase of an oscillating cycle between N-stress and N-repleteness during the development of a cyanobacterial bloom, or it could simply reflect the dif-ferent weather conditions prevailing during the experiment. Nevertheless, in blooms, N2 fixation may show long-term
fluctuations, with cyanobacteria therefore alternating be-tween N-repleteness (during which they may release fixed nitrogen) and N-starvation. As a consequence, the ratio of acetylene reduction to15N
2incorporation may also vary,
be-ing highest when cells are releasbe-ing more of their newly fixed N. Indeed, the variable value of this ratio, far from being a problem for ecophysiologists, may provide useful information about the physiological state of the population under study.
In addition, it appears that N2 fixation and primary
pro-duction are not always in phase during the formation of cy-anobacterial blooms in the Baltic Sea. In turn, this implies that these two processes are neither tightly coupled nor co-regulated.
J. R. Gallon,1A. M. Evans, and D. A. Jones
Biochemistry Research Group School of Biological Sciences University of Wales Swansea Singleton Park, Swansea SA2 8PP, United Kingdom
P. Albertano and R. Congestri Department of Biology
University of Rome ‘‘Tor Vergata,’’ Via della Ricerca Scientifica 00133 Rome, Italy
B. Bergman, K. Gundersen, and K. M. Orcutt Department of Botany
Stockholm University S-106 91 Stockholm, Sweden
K. von Bro¨ckel, P. Fritsche, M. Meyerho¨fer, K. Nachtigall, and U. Ohlendieck Institut fu¨r Meereskunde an der Universita¨t Kiel
Du¨sternbrooker Weg 20 D-24105 Kiel, Germany
S. te Lintel Hekkert Department of Molecular and Laser Physics
University of Nijmegen
NL-6525 ED Nijmegen, The Netherlands
K. Sivonen and S. Repka University of Helsinki
Department of Applied Chemistry and Microbiology P.O. Box 56
00014 University of Helsinki, Finland
L. J. Stal and M. Staal Netherlands Institute of Ecology—KNAW
Department of Marine Microbiology P.O. Box 140
NL-4400 AC Yerseke, The Netherlands
References
BARKER, G. L. A., P. K. HAYES, S. L. O’MAHONY, P. VACHARAPI
-YASOPHON, ANDA. E. WALSBY. 1999. A molecular and phe-notypic analysis of Nodularia (cyanobacteria) from the Baltic Sea. J. Phycol. 35: 931–937.
BARLOW, R. G., D. G. CUMMINGS,ANDS. W. GIBB. 1997. Improved resolution of mono- and divinyl chlorophylls a and b and ze-axanthin and lutein in phytoplankton extracts using reverse phase C-8 HPLC. Mar. Ecol. Prog. Ser. 161: 303–307. BENNETT, A.,AND L. BOGORAD. 1973. Complementary chromatic
adaptation in a filamentous blue-green alga. J. Cell Biol. 58: 419–435.
CAPONE, D. G., J. P. ZEHR, H. W. PAERL, B. BERGMAN,AND E. J. CARPENTER. 1997. Trichodesmium: A globally significant ma-rine cyanobacterium. Science 276: 1221–1229.
CONGESTRI, R., R. FEDERICI,ANDP. ALBERTANO. 2000. Evaluating biomass of Baltic filamentous cyanobacteria by image analysis. Aquat. Microbial Ecol. 22: 283–290.
EDLER, L., S. FERNO, M. G. LIND, R. LUNDBERG,ANDP. O. NILS
-SON. 1985. Mortality of dogs associated with a bloom of the cyanobacterium Nodularia spumigena in the Baltic Sea. Ophe-lia 24: 103–109.
ERNST, A., Y.-D. LIU, S. REICH, ANDP. BO¨ GER. 1990. Diurnal ni-trogenase modification in the cyanobacterium Anabaena var-iabilis. Bot. Acta 103: 183–189.
EVANS, A. M., J. R. GALLON, A. JONES, M. STAAL, L. J. STAL, M. VILLBRANDT, AND T. J. WALTON. 2000. Nitrogen fixation by Baltic cyanobacteria is adapted to the prevailing photon flux density. New Phytol. 147: 285–297.
FALKOWSKI, P. G. 1997. Evolution of the nitrogen cycle and its Acknowledgements
We gratefully acknowledge the crew of the R/V Alexander von Humboldt for their assistance at sea. This work was supported by the European Commission Environment RTD Programme DG XII (contract ENV4 CT97 0571) and forms part of the European Land-Ocean Interaction Studies (ELOISE) network. This is publication 2962 of NIOO-KNAW and ELOISE contribution 269/15.
influence on the biological sequestration of CO2in the ocean.
Nature 237: 272–275.
. 2000. Rationalizing elemental ratios in unicellular algae. J. Phycol. 36: 3–6.
FITZWATER, S. E., G. A. KRAMER,ANDJ. H. MARTIN. 1982. Metal
contamination and its effects on primary production measure-ments. Limnol. Oceanog. 27: 544–551.
FLYNN, K. J. 1988. Some practical aspects of measurements of
dis-solved free amino acids in natural waters and within microal-gae by the use of HPLC. Chem. Ecol. 3: 269–293.
, D. M. J. DICKSON,ANDO. A. AL-AMOUDI. 1989. The ratio
of glutamine : glutamate in microalgae: A biomarker for N-sta-tus suitable for use at natural cell densities. J. Plankton Res. 11: 165–170.
, ANDJ. R. GALLON. 1990. Changes in intracellular and
ex-tracellulara-amino acids in Gloeothece during N2fixation and following addition of ammonium. Arch. Microbiol. 153: 574– 579.
GALLON, J. R., D. M. PEDERSON,ANDG. D. SMITH. 1993. The effect
of temperature on the sensitivity of nitrogenase to oxygen in the cyanobacteria Anabaena cylindrica (Lemmermann) and Gloeothece (Na¨geli). New Phytol. 124: 251–257.
GLIBERT, P. M.,ANDD. A. BRONK. 1994. Release of dissolved
or-ganic nitrogen by marine diazotrophic cyanobacteria, Tricho-desmium spp. Appl. Environ. Microbiol. 60: 3996–4000. GRASSHOFF, K. [ED.]. 1976. Methods of seawater analysis. Verlag
Chemie.
KAHRU, M., U. HORSTMANN,ANDO. RUD. 1994. Satellite detection
of increased cyanobacterial blooms in the Baltic Sea: Natural fluctuation or ecosystem change? Ambio 23: 469–472. LARSSON, U., S. HAJDU, J. WALVE,ANDR. ELMGRAN. 2001. Baltic
Sea nitrogen fixation estimated from the summer increase in upper mixed layer total nitrogen. Limnol. Oceanogr. 46: 813– 820.
MONTOYA, J. P., M. VOSS, P. KAHLER,AND D. G. CAPONE. 1996.
A simple, high precision, high-sensitivity tracer assay for N2
fixation. Appl. Environ. Microbiol. 62: 986–993.
MULHOLLAND, M. R.,ANDD. G. CAPONE. 2001. Stoichiometry of
nitrogen utilization in cultured populations of Trichodesmium IMS101: Implications for growth. Limnol. Oceanogr. 46: 436– 443.
PETERSON, R. B.,ANDR. H. BURRIS. 1976. Conversion of acetylene
reduction rates to nitrogen fixation rates in natural populations of blue-green algae. Anal. Biochem. 73: 404–410.
READE, J. P. H., L. J. DOUGHERTY, L. J. ROGERS,ANDJ. R. GALLON.
1999. Synthesis and proteolytic degradation of nitrogenase in cultures of the unicellular cyanobacterium Gloeothece strain ATCC 27152. Microbiol. UK 145: 1749–1758.
REDFIELD, A. C. 1958. The biological control of chemical factors
in the environment. Am. Sci. 46: 206–221.
RENSTRO¨ M-KELLNER, E.,AND B. BERGMAN. 1989. Glycolate
me-tabolism in cyanobacteria. III. Nitrogen controls excretion and metabolism of glycolate in Anabaena cylindrica. Physiol. Plant. 77: 46–51.
SELLNER, K. G. 1997. Physiology, ecology and toxic properties of
marine cyanobacteria blooms. Limnol. Oceanogr. 42: 1089– 1104.
SHARP, J. H. 1974. Improved analysis for ‘‘particulate’’ organic
car-bon and nitrogen from seawater. Limnol. Oceanogr. 19: 984– 989.
STAAL, M., S. T. LINTEL-HEKKERT, F. HARREN,ANDL. STAL. 2001.
Nitrogenase activity in cyanobacteria measured by the acety-lene reduction assay: A comparison between batch incubation and on-line monitoring. Environ. Microbiol. 3: 343–351. TURNER, G. L.,ANDA. H. GIBSON. 1980. Measurement of nitrogen
[ed.], Methods for evaluating biological nitrogen fixation. John Wiley & Sons.
VILLBRANDT, M., L. J. STAL, B. BERGMAN,ANDW. E. KRUMBEIN. 1992. Immunolocalization and western blot analysis of nitro-genase in Oscillatoria limosa during a light-dark cycle. Bot. Acta 105: 90–96.
WATERBURY, J. B., S. W. WATSON, R. R. L. GUILLARD,ANDL. E. BRAND. 1979. Widespread occurrence of a unicellular marine, planktonic cyanobacterium. Nature 277: 293–294.
ZEHR, J. P.,AND OTHERS. 2001. Unicellular cyanobacteria fix N2in
the subtropical North Pacific Ocean. Nature 412: 635–638. , M. WYMAN, V. MILLER, L. DUGUAY,ANDD. G. CAPONE. 1993. Modification of the Fe protein of nitrogenase in natural populations of Trichodesmium thiebautii. Appl. Environ. Mi-crobiol. 59: 669–676.
Received: 31 August 2001 Amended: 25 April 2002 Accepted: 25 April 2002
Limnol. Oceanogr., 47(5), 2002, 1521–1524
q 2002, by the American Society of Limnology and Oceanography, Inc.
Preservation of amino acids from in situ–produced bacterial cell wall peptidoglycans in
northeastern Atlantic continental margin sediments
Abstract—In this study we present the results of total hy-drolysable amino acids (THAA) and amino acid D/L-enantio-mers in northeastern Atlantic continental margin sediments. There is increasing evidence that intrinsically labile amino ac-ids are present in old marine sediments as part of a refractory network of peptide-like material. We used amino acid enantio-mers to identify the contribution of amino acids from bacterial cell walls to THAA in organic matter ranging from relatively young to 18,000 yr old. The ratio of D/L-amino acids in-creased with depth in the sediment mixed layer. Application of a transport-racemization-degradation model excludes a sig-nificant production of D-amino acids by racemization and im-plies in situ bacterial production as the main source. Amino acids associated with a refractory pool of bacterial cell walls could account for approximately one third of the THAA deep-er in the sediments. We propose that in situ bactdeep-erial produc-tion and the primary flux of labile organic matter from the water column result in a small but highly reactive pool of amino acids in the surface mixed sediment only, whereas ami-no acids associated with refractory cell walls persist in marine sediments.
The contribution of amino acid-nitrogen to total nitrogen (%AA-N) as well as the spectrum of individual amino acids have been used as indicators of organic matter (OM) reac-tivity in marine sediments (Cowie and Hedges 1992; Grut-ters et al. 2001). Preferential enzymatic degradation of amino acids relative to bulk OM (Harvey et al. 1995) causes the %AA-N to decline from 75% to 90% in fresh plankton to 40% to 50% in OM in sinking aggregates and further to 10%–30% in sedimentary OM (Lee 1988). However, the sorption of OM to mineral surfaces is assumed to result in the preservation of these intrinsically labile compounds (Keil et al. 1994). Amino acids are known to be a major constit-uent of peptidoglycans, the main structural components of bacterial cell walls (Schleifer and Kandler 1972). It has been reported that peptidoglycans contribute significantly to dis-solved OM in the deep ocean (McCarthy et al. 1998). In addition, Parkes et al. (1993) proposed that with increasing depth in the sediments up to 16% of the total organic carbon (TOC) that cannot be accounted for by amino acids and
car-bohydrates (uncharacterized TOC) comes from dead bacte-rial biomass. They suggested that this bactebacte-rial ‘‘necromass’’ is relatively recalcitrant and perhaps contributes to OM pres-ervation. Therefore, we hypothesize that the in situ produc-tion of bacterial cell walls contributes to the preservaproduc-tion of amino acids in marine sediments. In addition, benthic pro-duction of peptidoglycan may be a source to suspended par-ticulate organic matter in the lower water column of the ocean (Bauer and Druffel 1998).
Materials and methods—Particulate matter was collected from sediment traps (Antia et al. 1999), situated 400 m above bottom, at water depths of 1,445 and 3,650 m across the Goban Spur northeastern Atlantic continental slope (49824.899N, 11831.429W to 49805.309N, 13826.189W). Sed-iment samples were taken from multicores and piston cores (representing ages of 7, 10, 18 kyr) at water depths of 651, 1,296, and 3,650 m (Lohse et al. 1998). Sediment trap sam-ples (pooled averages from individual cups covering a time span of 14 months) as well as sediment samples were ana-lyzed for total hydrolysable amino acids (THAA) and D/L enantiomers of aspartic acid, glutamic acid, serine, and ala-nine, the major peptidoglycan amino acids.
THAA were measured by reverse-phase high-performance liquid chromatography (HPLC) analysis, after liquid-phase hydrolysis (1108C for 24 h) and precolumn derivation with o-phtaldialdehyde (OPA) (Grutters et al. 2001). Amino acid enantiomers were analyzed by HPLC after vapor-phase hy-drolysis at 1508C for 3 h and precolumn derivation with OPA/N-acetyl-L-cysteine and ultraviolet-fluorescence detec-tion (Glavin et al. 1999). Prior to derivatizadetec-tion, hydrolysates were desalted by use of cation exchange resin (AG50W-X8, Bio-Rad) and the desalted extracts were stored in borate buffer (pH 9.4). Concentrations of the THAA and enantio-mers were calculated by comparison of the amino acid peak areas to those of a standard run in parallel. Very low levels of amino acids were detected in a blank carried through the same processing procedure as the sediment samples and were subtracted from the measured peak areas of the sam-ples. The precision of the THAA analysis, expressed as the