Alma Mater Studiorum – Università di Bologna
DOTTORATO DI RICERCA IN
Scienze della Terra, della Vita e dell’Ambiente
Ciclo 29
Settore Concorsuale di afferenza: 05/B1 Zoologia e Antropologia
Settore Scientifico disciplinare: BIO/05 Zoologia
TITOLO TESI
Differential gene expression of dorsal pictorial ornaments and pigmentation
in skates (Rajidae, Chondrichthyes)
Presentata da: Alice Ferrari
Coordinatore Dottorato
Relatore
Prof. Barbara Mantovani
Prof. Fausto Tinti
Co-Relatori
Prof. Walter Salzburger
Alessia Cariani, PhD
ABSTRACT
Approximately twenty years have passed since the beginning of concentrated investigations on the evolution and ecology of skates. The evidence generated thus far suggested that this monophyletic group have experienced multiple, parallel adaptive radiations at a regional scale, which contributed to the delineation of strong phylogeographical signal since the Cretaceous. This background represented the guiding light of the work described in this thesis, where two main themes were developed. The first one focused on the investigation of Raja miraletus L. species complex through the analysis of genetic variation derived from both mtDNA and nuDNA. The results presented herein assessed the presence of a restricted gene flow and different degree of divergence between the South African and Mediterranean samples, ascribing these patterns to oceanographic discontinuities. Despite the high species diversity characterising the Family, most Rajidae show a stable gross morphology and peculiar dorsal pigmentation patterns, which may have been implicated in cryptic speciation. Nonetheless, the adaptive value and the genetic basis of these traits remain poorly investigated. To fill this gap, this thesis also describes the application of RNA-sequencing technology on recently diverged skate species with sibling and sister phylogenetic relationships. Therefore, the second goal of this research consisted in investigating the molecular basis of pigmentation in five non-model species. To this end, the transcriptome profiling of different skin tissues was performed using the Illumina platform, whereas longer sequencing data were obtained from R. miraletus multiple organs using the Ion Torrent technology. After the assembly of a reference transcriptome and the mapping of Illumina reads, the Differential Gene Expression between skin tissues across species was performed, revealing the expression of transcripts mainly related to metabolic process and catalytic activity in which pigmentary genes appeared involved. This work could be considered the basis for future studies aiming to disentangle how pigmentary traits evolved in skates and other chondrichtyans, to evaluate whether the same or alternative traits have been used in parallel adaptations to similar environments and to understand if these traits follow species divergence or hybridisation.
TABLE OF CONTENTS Chapter 1. General introduction 3 1.1. Thesis objectives and overview 3 1.2. Species and cryptic diversity 5 1.3. Cryptic lineages in chondrichthyans 10 Chapter 2. The name game: when evolution hides behind unchanging morphology 13 2.1. Introduction 13 2.2. Materials and methods 16 2.2.1. Sampling 16 2.2.2. DNA isolation and PCR amplification 16 2.2.3. mtDNA COI sequence 16 2.2.4. Expressed Sequence Tag-linked microsatellite loci 17 2.2.5. Data analysis 17 2.3. Results 21 2.3.1. Genetic diversity 21 2.3.2. Population connectivity 3 2.4. Discussion and conclusions 8 Chapter 3. Retrieving skates’ skin transcripts by Illumina sequencing 15 3.1. Introduction 15 3.1.1. Skin structure in elasmobranchs 17 3.1.3. Pigmentary genes 22 3.2. Materials and methods 23 3.2.1. The development of a sampling protocol and experimental scheme 23 3.2.2. RNA isolation 25 3.2.2.1. RNA extraction using TRIzol® Reagent 25 3.2.2.2. RNA extraction using the Direct-zol™ RNA MiniPrep Kit 25 3.2.2.3. RNA extraction using the Maxwell® 16MDx Instrument 26 3.2.2.4. RNA extraction using the BeadBeater 26 3.2.2.5. Combining RNA isolation protocols 26 3.2.3. Library preparation and sequencing 27 3.2.4. Raw reads quality check 28 3.3. Results 30 3.4. Discussion 31 Chapter 4. Retrieving a reference transcriptome for Raja miraletus by Ion Torrent sequencing 33 4.1. Introduction 33 4.2. Materials and methods 35 4.2.1. Sampling 35 4.2.2. RNA isolation 35 4.2.3. Ion Torrent library preparation and sequencing 36 4.2.4. The assembly 37 4.2.5. Functional annotation of transcripts 38 4.3. Results 38 4.4. Discussion 44 Chapter 5. Differentially expressed genes in skate skin 47 5.1. Introduction 47 5.2. Materials and methods 49 5.2.1. Differential gene expression analysis 49 5.3. Results 50 59 5.4. Discussion and conclusion 65
References 67 Appendix I Appendix II Appendix III Appendix IV
Chapter 1. General introduction 1.1. Thesis objectives and overview This dissertation focuses on Rajidae (Chondrichthyes), a family of cartilaginous fish inhabiting the continental shelf and slope of oceans worldwide and whose evolutionary history is far from being fully elucidated. The goals of this PhD research can be divided in two main, although interconnected, themes. First, the detection of genetic diversity, phylogeographic patterns and population structure of Raja
miraletus L. complex aimed to highlight the cryptic evolution hidden under the differentiation of at
least three lineages inhabiting the Mediterranean Sea and off the Atlantic coast of Africa.
Second, this research aimed to identify the molecular basis underpinning skates’ pigmentation along with other genes connected to skin functions (i.e. collagen structures, metabolism, mucus production and immune response). Most of all, the work aimed to identify transcripts related to pigmentation, to perform the Differential Gene Expression (DGE) analysis of differently pigmented and non-pigmented skin and eventually compile a transcript catalogue for this tissue. The surplus value of this research was adding a tile to the genomic resources currently available for five non-model species and lastly, opening the door to the investigation on the evolution of pigmentary genes and their patterns of adaptation to specific ecological conditions (e.g. as an effect of convergence or the repeated evolution of similar phenotypes serving the same ecological function in two or more taxa). Specific research tasks and questions were separately addressed in each chapter. Chapter 1 begins with a brief introduction to the species concept and the undertones assumed within this thesis, putting in the spotlight those taxa which are hidden under the same nominal species and highly contribute to enrich the biodiversity inventory. Chapter 1 thus focuses on cryptic speciation in bony fish and chondrichthyans, reporting the most interesting and significant cases. In Chapter 2 the case of the brown skate Raja miraletus is described as an additional evidence of cryptic evolution within a species complex. The genetic variability and differentiation between different geographical populations was investigated at the mitochondrial and nuclear DNA level. The existence of at least three different lineages was discussed, supporting the identification of the South African brown skate as a resurrected species, Raja ocellifera, included in the nominal Raja miraletus
since 1967.
Chapter 3 illustrated the path leading to the Illumina sequencing of different skin tissues belonging to five different species of genus Raja, which are phylogenetically related by sibling and sister relationships and display different dorsal patterning, ascribable to their adaptation to the benthic life.
Chapter 4 focused on the production of long sequencing reads for the reconstruction of a draft transcriptome for R. miraletus, from the sampling phase to the library preparation and Ion Torrent sequencing. The transcriptome has been then used during the mapping of the Illumina reads obtained from skin tissues, to lastly perform the Differential Expression analysis (DE), as described in chapter 5.
Chapter 5 introduced to the main critical points and issues especially related to RNA-seq data analysis. Details about the methods chosen are discussed. This final section includes the main results of DE analysis between different skin tissues across five target species and provides a first overview on the functional role of the identified genes. Finally, suggestions are given for future experiments that can validate and expand on the knowledge presented here. In fact, results of this work could be considered the starting point for a deeper and wider exploration of chondrichthyan pigmentary genes.
1.2. Species and cryptic diversity While reading ‘How many species are there on Earth?’ today, the 3 to 5 million species estimated in 1988 (May 1988) appear far from the most recent biodiversity inventory, where about 8.7 million eukaryotic species are predicted to be inhabiting the planet. It has also been appraised that 86% of terrestrial and 91% of marine species have not been described yet (Mora et al. 2011). How long should it take to fill this gap in our knowledge and how should we proceed in those under-sampled regions characterized by high species richness or simply not physically reachable? While answering these questions, Mora et al. (2011) raised an interesting paradox: considering 6,200 species described per year, 24.8 new species described per taxonomist and assuming that these values, together with the current rate of extinction, will remain constant in time and among taxa, characterizing new species may take as long as 1,200 years and the industry of 303,000 taxonomists, meaning that many species will become extinct before we would know they walked the earth or ‘swam the oceans’ (Mora et al.2011). Nonetheless, it is plausible that this filling-the-gap-issue would be simplified if considering the integration of DNA-based technologies to traditional taxonomy (Cariani et al. 2017; Landi et al. 2014; Costa et al. 2012).
In general, underestimating diversity and overestimating species ranges are the main obstacles to the compilation of a comprehensive biodiversity inventory, especially if build on ‘taxonomic lumping’, i.e. the practice of combining morphologically similar forms from different geographic regions under a single species name. As a matter of fact, this procedure could concern subspecies, geographic forms, morphotypes, and other nominally intraspecific taxa that have been recognized on the basis of divergence in particular traits (Funk & Omland, 2003). According to Funk & Omland (2003), the monophyletic origin of one or more intraspecific taxa within a nominal species could be a symptom of genetic isolation of these taxa from other ‘conspecifics’. Therefore, when reproductive isolation is placed between distinct but sympatric clades, we are likely in front of different species, but when distinct clades are also geographically separated, then the evidence of reproductive compatibility is not fully ascertainable and the decision of whether to recognize them as separate species becomes more difficult. The two centuries-debate about the definition of species is still open and contributes to a forced, but necessary, categorization of what we simply consider as the fundamental taxonomic unit of classification (Leliaert et al. 2014; De Queiroz 2007; Brookfield 2002). Reaching the species essence on its whole has always involved in some degree both biologist and philosophers (Hull 1965; Sobert,
2008; Claridge et al. 1997), who questioned on species ontological status as natural kinds, individuals or sets of organisms or focused on membership and explanatory requirements described by the puzzling Relational Essentialism (Malpas, J. ‘Donald Davidson’, The Stanford Encyclopaedia of Philosophy, 2012). The choice of species concept when describing biodiversity is fundamental for our knowledge of diversity and distribution and affects our understanding of species evolutionary history. The Morphological Species Concept (MSC) is certainly the oldest theory defining species according to their phenotypic differences (Cracraft 1983), although not the most accurate as described later. In this thesis, the species denotation should be then interpreted mainly according to the Phylogenetic (PSC; Cracraft 1989) and Biological (BSC; Mayr 1963) species concepts, as a group of organisms bound by a unique ancestry that can successfully interbreed and produce fertile offspring (Freeland & Boag 2016; Cracraft 1983; Bush, 2016; Mayr 1942). This choice is concordant with Avise and Ball work (1990) who, in the effort to integrate speciation concepts, advanced the use of multiple independent loci in species definition. The authors suggested that the time necessary to major phylogenetic distinctions to accumulate concordantly at independent loci is presumably adequate for intrinsic reproductive barriers to form. Consequently, populations showing concordant and reciprocally monophyletic patterns over those loci are hence estimable as single taxonomic units. In addition, the Phylogeographic facet will be fundamental as well throughout this thesis, since it adds a timescale to the understanding of population structure and genealogies, reproductive isolation of population units and speciation events.
In general, morphologically well-differentiated species are often characterized by similar genetic traits due to rapid divergence mechanisms at times accompanied by incomplete lineage sorting or hybridization (i.e. rapid adaptive radiations in African cichlids, Böhne et al. 2016 ; Ivory et al. 2016; Malinsky & Salzburger 2016 or in lizards, Feiner, 2016; Medina et al. 2016; Barley et al. 2013). The widespread detection of an alternative paradigm, where evolutionary lineages are discriminated genetically, but not morphologically, can be an issue for species identification and a contribution to the underestimation of biodiversity in systems involving ‘nonadaptive radiations’ (Rundell & Price 2009; Jockusch & Wake 2002; Gittemnerger 1991) and ‘cryptic evolution’ in species complexes (Clare 2011; Funk et al. 2012; Pfenninger & Schwenk 2007; Stuart et al. 2006). Anyone googling ‘cryptic species on the web, would hunt approximately 4,290,000 entries. A total of 983 academic papers are available on public portals, corresponding to about one tenth of the records obtained using any scientific literature database (e.g. ISI Web of Knowledge roughly counts 9,681 entries, among articles, reviews, proceeding papers, meeting abstracts and editorial materials).
Beside the meaning of these fast-changing numbers, what is the significance of cryptic diversity? Cryptic species can be defined as two or more distinct but morphologically similar species that were ranked and hidden as a single nominal one (Bickford et al. 2007; Pfenninger & Schwenk 2007). The discovery of this phenomenon boosted with the advent of PCR-based approaches, in particular of DNA barcoding (Hebert et al. 2004), which has shown to be helpful in species diagnosis, even between closely related species (Moore 2016; Avise & Walker 1999; Hebert et al. 2003). This approach highly contributed in revealing the astonishing diversity around us and arose both questions and criticisms about cryptic taxa acknowledgment, frequency, age, distribution and boundaries.
Moreover, these species are the most studied and criticized since two decades. Particular caution should be paid when observing deep genetic divergences within species, which do not always imply cryptic speciation events (Horne et al. 2008). Conversely, when deep evolutionary splits are in agreement across both mitochondrial and nuclear DNA markers (henceforth mtDNA and nuDNA), are geographically isolated or show morphological and behavioural dissimilarities (Victor 2015; Knudsen & Clements 2012) then the signal of a cryptic speciation event might be loud and clear. As a matter of fact, an increasing number of DNA-based studies suggest that morphologically similar species can be the product of ancient speciation events (Beheregaray & Caccone 2007). Despite criticisms regarding the ‘taxonomic inflation’ issue and other controversies (Trontelj & Fiser 2009; Meiri & Mace 2007; Rubinoff & Holland 2005) cryptic diversity has been richly documented among marine invertebrates (Knowlton 2009) as foraminifera (de Vargas et al. 1999), crustaceans (Baldanzi et al. 2016; Pilgrim et al. 2013; Navarro-Barranco et al. 2013; Schiffer & Herbig 2016), annelids (Grosemans et al. 2016; Johnson et al. 2016; Kawauchi & Giribet 2014), mollusc (Huelsken et al. 2013; Barco et al. 2013; Jörgeret et al. 2012) and echinoderms (Boissin et al. 2011), which show paradoxical wide distribution, but theoretical low dispersal capacity.
More and more case studies are focusing also on vertebrate hidden species among ascidians (Kwan et al. 2014; Pérez-Portela et al. 2013), teleost (Nirchio et al. 2016; Fernandez-Silva et al. 2015; Bradbury et al. 2014; Corander et al. 2013), amphibians (Funk et al. 2012; Elmer et al. 2007), birds (Friesen et al. 1996), reptiles (Ukuwela et al. 2014) and, unexpectedly, on mammalian megafauna (Clare 2011; Brown et al. 2007; Dalebout et al. 2002; Garcia-Rodriguez et al. 1998). Their discovery and cataloguing are fundamental and critical for their conservation and habitat management, legal protection and distribution of limited resources (Crozie et al. 2005; Agapow et al. 2004; Daugherty et al. 1990).
The striking underestimate of global species diversity is particularly important because it can occur in biodiversity conservation hotspots (Brown & Diesmos 2009), but it can’t be excluded in other realms, as the marine one, where speciation events and different evolutionary radiations are more and more extensively documented (Henriques et al. 2016; Hodge & Bellwood 2016; Pereira et al. 2016; Siqueira et al. 2016; Frable et al. 2015; Henriques et al. 2015; Craig et al. 2009; Neilson & Stepien, 2009; Ward et al. 2008; Knowlton 2000; Palumbi 1992).
According to Bickford et al. (2007), the basis of the un-correlation between morphological change and species delimitation should be sought in two main recurrent conditions: the lack of visual communication among conspecifics and the conservation of the external gross morphology. Regarding the first condition, a nonvisual language is likely to be intensified in the marine realm, where organism interact via chemical or electric signals (Klimley 2013; Feulner et al. 2009; Sisneros & Tricas 2002; Sisneros & Tricas 2002; Knowlton 2000). These features could be considered the key of survival for those species arisen so recently that most morphological traits have not yet diverged but, on the other hand, the conservation of external morphology could be the result of stabilizing selection on important adaptive traits in species occupying similar habitat types and ecological niches (Losos & Glor 2003; Schonrogge et al. 2002). Some authors also refer to morphological and ecological stasis as the result of a ‘living-fossil’ condition, being the latter typically characterized by bradytely (Eldredge & Stanley 1984) and a relatively unmodified gross morphology associated with molecular divergences (Erdmann et al. 1999; Bowen et al. 1993). Considered the rarity of living fossils, in most cases a strong selection may be driving the conservation of external morphological traits, even if the evidence of this phenomenon is not always easily ascertainable. Furthermore, the maintenance of similar external traits can vary a lot on the evolutionary scale, meaning that in some cases a consistent species diagnosis based on morphological characters is not possible, whereas in other cases morphological differentiation appears to have occurred in minor measure, involving only slight differences in body size, for instance.
Among tropical fish, for example, the molecular divergence between evolutionary lineages can be congruent with the observed morphological distinction, e.g. the commercially valuable Cephalopholis
hemistiktos (Rüppell, 1830), the yellow-fin hind (Priest et al. 2016), while other species show a
morphological stability on a strikingly wide range. An example of species differentiation driven by stabilizing selection is the tropical and subtropical genus Albula (Scopoli, 1777) which has diverged 3–20 Mya because of the balancing selective force acting in sand habitats (Andrews et al. 2016; Galdino Brandão et al. 2016; Henriques et al. 2016; Henriques et al. 2015; Colborn, et al. 2001),
considered ecologically homogenous all over the world (Bowen & Karl 2006).
Theoretically, a high number of cryptic events should be detected in the richest hotspots for biodiversity. This is the case of the Coral Triangle, where the genus Eviota (O.P. Jenkins, 1903) has started developing 23 Mya, after the geological formation of the hotspot (Renema et al. 2008) and evolved during the Pleistocene in more recent species complexes characterized by different regional colour morphs and at least six genetic lineages per complex (Tornabene e t al. 2015).
From one end to another, extreme habitats can also be the nest of cryptic evolution. Around Antarctica, the peculiar geological, climatic and oceanographic conditions fostered the endemic marine fauna to exhibit a higher than expected species richness, including cryptic species (Strugnell & Allcock 2013; Allcock & Strugnell 2012; Thatje 2012; Thornhill et al. 2008; Wilson et al. 2007; Allcock et al. 2011). The yellow-fin rockcod Lepidonotothen nudifrons (Lönnberg, 1905) is one of them, having demonstrated to comprise two genetically distinct and geographically isolated partitions that are morphologically identical because of a speciation event fitting into adaptive radiation theory (Dornburg et al. 2016). The authors found that the hidden diversity of this species could be a result of the frequent glacial cycles occurred over the past 5 million years, which could have forced niches’ shifts and/or restricted gene flow over long distances (Dornburg et al. 2016) instead of providing ecological opportunities for phenotypic change likewise other Antarctic fauna (Near et al. 2012; O’Loughlin et al. 2011). According to the authors, the lack of morphological diversification involves the ‘flexible-stem model’ proposed by West-Eberhard (2003), which states that phenotypic diversification requires developmental plasticity: the more flexible is the ancestral population in terms of ecology, natural selection and adaptive capacity, the more phenotypic diversity would be characterizing the radiating lineage in function of time and population size. More specifically, large populations persisting over long timescales would be more prone to develop a higher measure of flexibility, necessary for further phenotypic change (West-Eberhard 2003). Cryptic evolutionary mechanism has been shown to occur into another extreme habitat which has not been extensively sampled: the deep sea. Independent lineages were recorded in genus Etelis (Couvier, 1828), the Deepwater snappers (Andrews et al. 2016), where the nominal E. carbunculus was indeed composed of two partitioned species, co-occurring in North-Western Australia, Cocos Island, New Caledonia, Tonga, Wallis and Futuna, Fiji and Samoa. Concordantly with extensive morphological similarity, the lineages have diverged 4-5 Mya in an historic period comprising a reduced water flow between the separated Indian and Pacific Basins (16–8 Mya) and the flow fluctuations occurred during the Pleistocene (2.6–0.12 Mya; Andrews et al. 2016).
According to the reported examples, the role and importance of paleoclimatic history and hydro-geographic discontinuities in driving genetic diversity, population divergences and species demography became evident. But what could we expect from ancient and, in some cases, slow-mutating species (Martin & Palumbi 1993)? 1.3. Cryptic lineages in chondrichthyans The evolutionary history of cartilaginous fish dates back to the early Devonian, about 400 Mya and 200 Ma before the origin of teleost, as revealed by the fossil records collected between Europe, Lebanon and North Africa (Maisey 2012). Despite their ancient origin, this class is far from being strictly primitive. On the contrary, chondrichthyans evolved sophisticated reproductive strategies and means of communication. Elasmobranchs like mammals, perform courtship, internal fertilization and females experience gestation, during which an extended development may be necessary to enhance the mediation of complex social and sexual behaviour (Demski 1990a). Tricas et al. (1995) have also described the role of the electro-sensory system and the neuroendocrine system while localizing the sexual partner (e.g. Urolophus halleri produces a weak electric signal that is rhythmically modulated by the movements of the spiracles and gills during ventilation. The signal is detected by other buried skates via the ampullae of Lorenzini). Nevertheless, their slow growth and longevity (Cailliet et al. 1995; Camhi et al. 1998), low recovery capacity, low fecundity and late maturity (i.e. between 10 and 20 years for males and 11.5 to 30 years for females of Etmopterus baxteri; Irvine et al. 2006) are well known among marine biologists and conservationists: most species spend relatively long gestation periods (approximately one year) and produce few egg-capsules per season (Dudgeon et al. 2012; Pratt & Carrier 2001). This K-selected life history trait makes this Class particularly vulnerable to anthropogenic stressors and environmental change (Cariani et al. 2017; Ball et al. 2016; Kousteni et al. 2015; Griffiths et al. 2010; Richards et al. 2009; Corrigan et al. 2008; Abercrombie et al. 2005), and because of their intrinsic sensitivity and susceptibility to overfishing and by-catch, erasing any taxonomic uncertainty is fundamental to their survival and conservation (Bonello et al. 2016). It has been estimated that more than 1100 cartilaginous fish species (sharks, skates, rays and chimaeras) inhabit the oceans worldwide, while the Mediterranean Sea alone hosts 89 species (about 7% of the global diversity; Cariani et al. 2017). Speaking of cryptic diversity, could we predict a similar scenario as the one observed among marine teleost? This is certainly the case.
cryptic species for elasmobranch groups as well (Pavan-Kumar et al. 2014; Ovenden et al. 2011). Angel sharks Squatina spp. (Solé-Cava & Levy 1987), thresher sharks Alopias spp. (Eitner, 1995), hound sharks Mustelus spp. (Gardner et al. 2002; (Heemstra 1997), shovelnose guitarfish Rhinobatos spp. (Sandoval-Castillo et al. 2004), catsharks Galeus spp. (Castilho et al. 2007), wobbegong sharks (Corrigan et al. 2008), the spotted eagle ray Aetobatus (Richards et al. 2009) and Atlantic skates genus Dipturus (Griffiths et al. 2010; Iglésias et al. 2010) have all demonstrated to hide parallel or intricate genealogies driven by hydrographic barriers and paleo-geological events. Below, two interesting case studies are reported and one more has been developed and investigated within this PhD research (see Chapter 2).
Among Squaliformes, the deep-sea lanternsharks genus Etmopterus are not commercially interesting, but they represent a significant by-catch component of deep-water trawl and longline fishery (Clarke et al. 2005; Compagno et al. 2005; Jakobsdóttir 2001; Wetherbee & Nichols 2000; Wetherbee et al. 1996). The taxonomic confusion characterising the genus still endangers species conservation and reflects an even more tangled pattern of interspecific and intraspecific relationships within at least six nominal species. As other relatives (e.g. Schaaf da Silva & Ebert 2006; Ward et al. 2008; 2005), lanternsharks display an unclear cryptic diversity within the Southern Hemisphere (Straube et al. 2011). Paleoclimatic events mainly related to the deep-sea cooling (e.g. temperatures decreased from 12°C down to 4.5°C about 34 Mya; Zachos et al. 2001) and ice sheet development on Antarctica were the cause of its separation from the surrounding continents. The opening of the Tasman and Drake passages allowed circumpolar circulation and thermal isolation (Dingle & Lavelle 2000).
Many authors have demonstrated the existence of a cryptic Atlantic lineage related to the cosmopolitan and endangered Sphyrna lewini (Griffith & Smith 1834), the scalloped hammerhead shark (Abercrombie et al. 2005; Duncan et al. 2006). This species shows a deep divergence between the Atlantic and Indo-Pacific monophyletic populations according to mtDNA and morphological differentiation as well (Quattro et al. 2006). The corresponding two morphs previously described by Springer (1941) as S. diplana (from Atlantic Ocean) and S. lewini (from Indo-Pacific region) were later synonymized via ‘taxonomic lumping’ by Fraser-Brunner (1950) and Gilbert (1967). A third, deeper and isolated lineage was also detected along the coasts from North Carolina to Florida, which earned the name of Carolina hammerhead, aka S. gilberti sp. Nov (Quattro et al. 2013) and, more recently, along the Western Atlantic Coasts (Pinhal et al. 2011), widening the distributional area of the species of more than 7,000 km. The uplift of the Isthmus of Panama (3.1-3.5 Mya; Coates et al. 2004; Avise
et al. 2000; Coates & Obando 1996) seems to have influenced the phylogeographic history of the scalloped hammerhead shark (Duncan et al. 2006; Quattro et al. 2006), as well as many other terrestrial, freshwater and marine species (Andrews et al. 2016; Hodge & Bellwood 2016; Schiffer & Herbig 2016; Bowen & Karl 2006; Colborn et al. 2001; Bermingham et al. 1997), including batoids (Richards et al. 2009). In the next chapter the case of the Raja miraletus species complex will be reported as a further exemplification of hidden diversity among the family Rajidae.
Chapter 2. The name game: when evolution hides behind unchanging morphology
2.1. Introduction
Skates (Rajoidei, Rajiformes) are marine and brackish elasmobranchs distributed worldwide that paradoxically exhibit an extraordinary species diversity and high degree of endemism paired with high levels of morphological and ecological stasis (Ebert & Compagno 2007). They are bottom dweller organisms that generally inhabit the sandy habitats of continental plates and shelves, which are frequently up to 1,500 m in depth (Ebert & Compagno 2007). Instead of visual signals, they use a highly efficient electro-sensory system for mating recognition (Tricas et al. 1995) and detection of prey (Camperi et al. 2007). Skates are oviparous and lay very large and benthic egg capsules, usually with a single embryo (Chiquillo et al. 2014). Species diversity and zoogeography of skates are well described in the regional shelf areas that have been surveyed intensely by scientific trawling programs (e.g. the north-eastern Atlantic-Mediterranean [Stehmann & Bürkel 1984] and the south- eastern Atlantic and western Indian Oceans [Compagno & Ebert 2007]). Skate faunas of the north-eastern Atlantic and Mediterranean shared several nominal species with the central and south African faunas (Froese & Pauly 2017). Among them, the brown skate (or twineye skate) Raja miraletus L. 1758 is distributed more widely than expected given the limited potential of dispersal conditioned by a relatively dominant residential behaviour of adults and juveniles (Neat et al. 2015; Frisk, et al. 2014; Wearmouth & Sims 2009; Hunter et al. 2005a ; 2005b) and the lack of egg dispersal (Musick & Ellis 2005). The brown skate is a small-sized, fairly fecund species that is reported to be distributed from northern Portugal, the whole Mediterranean and along the western and south-eastern coasts of Africa (Compagno & Ebert 2007; Stehmann & Bürkel 1984). This skate exhibits a pronounced benthic ecology, with depth range from shallow waters to ~450 m, but with most records from 10m to 150m on sandy and hard bottoms (Serena & Mancusi 2010; Compagno & Ebert 2007) and a generalist feeding behaviour (Kadri et al. 2014; Šantić et al. 2012). Because of its high and stable abundance over its distribution, the small body size and the early maturation (age at maturity estimated at 2.7 years; Tsikliras & Stergiou 2014), the brown skate is considered resilient to exploitation and assessed as Least Concern in the Red List (IUCN 2009). Raja miraletus also exhibits high levels of stasis of the external rough morphology along with its range, with two very distinctive tricolored (blue, black and yellow) bright eyespots on the upper ochre-brownish surface at the base of pectoral fins (Compagno et al. 1989; Stehmann & Bürkel 1984).
Unexpectedly, the flattened variation of external rough distinctive features contrasted with the pronounced differences in several fine internal and external morphometric and meristic characters. This contrast had started and conducted a “name game” for R. miraletus, namely a taxonomic and evolutionary game whose moves aim to lay upon taxonomic boundaries onto natural evolution in this enigmatic skate. The first “move” of the game was played by McEachran et al. (1989) that observed a significant variation of morphometric and meristic characters over its range and recognized at least three distinct groups of brown skates in the Mediterranean, West and South Africa. The Mediterranean and South African samples resulted the most differentiated, while those from West Africa (i.e. including samples from Mauritania-Senegal, Gulf of Guinea-equatorial Africa and Angola) were similar to each other. Among the West African samples, the Angolan brown skates were the most distinct, even if for some characters displayed intermediate variation between the Mediterranean and South African specimens (McEachran et al. 1989). The subtle variation of characters amongst groups and the cline trend of some of them, lead McEachran et al. (1989) to consider R. miraletus a polymorphic species with at least three parapatric or allopatric populations (i.e. located in the Mediterranean, West Africa and South Africa). Two oceanographic fronts with steep thermal gradients in the Eastern Atlantic, namely the upwelling areas at Cape Blanc (21°N) and Cape Frio (18°S) may act as barriers to maintain the partial reproductive separation among these populations (McEachran et al. 1989). The second “move” of the game has been played 20 years later by Naylor et al. (2012) and Caira et al. (2013) who provided a preliminary evidence of cryptic speciation in R. miraletus by integrating results from mitochondrial DNA analysis, morphology and host-parasite relationships from specimens collected in Senegal and South Africa. These authors suggested the existence of at least three clusters within R. miraletus and the species was updated to a complex of species (Naylor et al. 2012). Two clusters are sympatric in Senegal and the third was located in South Africa. Specimens of each clade host different Diphyllidean flatworm species of the genus Echinobothrium (Caira et al. 2013) and, even if additional material should be collected to formally describe these taxa, these independent data strongly corroborate cryptic speciation of R.
miraletus (Caira et al. 2013; Naylor et al. 2012). A third “move” of this taxonomic and evolutionary
game has been recently played by Last and Séret (2016) that, according to deep morphometric and meristic analyses of specimens that were mtDNA-typed (Naylor et al. 2012 and unpublished data), recognized R. miraletus as a species complex of at least four valid species: 1) the northernmost R.
miraletus, occurring in the Mediterranean and adjacent North Eastern Atlantic waters, 2) the
Ocean, from False Bay to Durban, 3) the central African R. parva sp. nov., distributed from Senegal to Angola and 4) a still not described species, occurring from Mauritania to Senegal where it is therefore sympatric with R. parva. This latter taxon can be identified by divergent mtDNA haplotype at the NADH2 gene (Naylor et al. 2012).
The advent of high-throughput DNA technologies and the launch of global biodiversity assessments (e.g. the DNA barcoding based on mtDNA universal markers as the fragment of the cytochrome oxidase subunit I, COI; Hebert et al. 2003), are providing raw data to go deeply in determining taxonomic, ecological and evolutionary issues of cryptic (sensu Bickford et al. 2007) and sibling species, where the term ‘sibling’ connotes species with a recent common ancestry, implying a sister-species relationship (Knowlton 1986) and even more challenging conservation issues (Bickford et al. 2007). However, the use of molecular methods coupling mitochondrial and nuclear DNA markers better resolved species boundaries as well as gene introgression/hybridization phenomena in marine fish and in closely related elasmobranches (Frodella et al. 2016; Arlyza et al. 2013; Morgan et al. 2012; Pasolini et al. 2011). This study aims to play again “the name game” by measuring genetic variation at both mtDNA (i.e. the COI barcode sequence marker) and nuDNA markers (i.e. eight EST-linked polymorphic microsatellite loci; El Nagar et al. 2010) in 323 individuals exhibiting the distinctive phenotype of the “R. miraletus” species complex (Compagno et al. 1989; Stehmann & Bürkel 1984). Individuals were collected from Mediterranean, North-eastern Atlantic, Senegal, Angola and South Africa, thus likely representing most of the diversity of the “Raja miraletus species complex” at multiple taxonomic levels. With these data, we tested the hypothesis that restricted gene flow and genetic divergence within this species complex are associated with climatic/oceanographic discontinuities (e.g. oceanographic fronts, depth barriers and environmentally unsuitable habitats) and parallelise morphological and parasite variation assessed independently (Caira et al. 2013; McEachran et al. 1989). Furthermore, we inferred the time of the most recent common ancestor and reconstructed the relative historical demography of the R. miraletus species complex to estimate the timeframe of populations and species’ evolutionary dynamics.
2.2. Materials and methods
2.2.1. Sampling
Specimens and tissues were collected from Mediterranean individuals caught during scientific research programs. No specific approval of this vertebrate work is required since the individuals sampled in this study were obtained for scientific and commercial activities. A total number of 323 brown skates were collected from 2000 to 2014 (Table S1 in Appendix I). Most of the individuals were collected by international scientific trawl survey campaigns carried out in South Africa (Africana cruises), Angola (Nansen cruises), the whole Mediterranean Sea (MEDITS scientific surveys) and national scientific trawl surveys (the Italian GruND; Relini 2000; the Portuguese scientific surveys of the Instituto Português de Investigação Marítima). Additional samples were provided by contracted commercial fishermen (Senegal, Levantine Sea and Israel) or collected at local fish markets (Algeria). Therefore, sampling covered most of the wide geographical distribution of Raja miraletus (Figure 1). All individuals were easily assigned to R. miraletus on the basis of their very distinctive morphotype and species-specific diagnostic characters (Stehmann & Burkel 1984; Compagno et al. 1989). Fin clips and muscle tissues were cut from each individual using sterile tweezers and clippers, transferred to a clean tube filled with 96 % ethanol and stored at -20°C for subsequent DNA analyses. 2.2.2. DNA isolation and PCR amplification Total genomic DNA (gDNA) was extracted from about 20 mg of fin clip or muscle tissue using the Invisorb® Spin Tissue Mini Kit (Stratec®molecular) according to manufacturer’s protocol (http://www.stratec.com/en/molecular/Products_Molecular/Genomic_DNA/Invisorb_Spin_Tissue_ Mini_Kit/Invisorb_Tissue_Mini.php). 2.2.3. mtDNA COI sequence From the extracted gDNA, a fragment of the mitochondrial COI gene of about 650bp was amplified using the COI-3 primer cocktail described by Ivanova et al. (2007). The PCR reactions were performed in 50μL total volume containing 4µL of pure gDNA corresponding to ~25ng, 10µL of buffer (1X), 5µL of MgCl2 (2.5mM), 0.5µL of dNTP mix (0.1mM each), 1 µL of each primer (0.2mM) and 0.25U of Taq DNA Polymerase. All PCR reagents were supplied by Promega®, except for primers, supplied by
LifeTechnologies®. The cycle was planned with the following thermal profile: 94°C for 2 min, 35 cycles of 94°C for 30 sec, 52°C for 40 sec, 72°C for 1 min and a final extension step at 72°C for 10 min and it was performed on a Biometra T-Gradient Thermocycler. The PCR products were electrophoresed on agarose gel at 2 % and amplicons were stored at -20ºC until shipping to Macrogen Europe (Amsterdam, the Netherlands). Individual Sanger sequencing was carried out on Applied Biosystems 3730xl DNA Analyser. 2.2.4. Expressed Sequence Tag-linked microsatellite loci Eight Expressed Sequence Tag-linked microsatellite loci (henceforth EST-SSRs) developed from the little skate Leucoraja erinacea and cross-amplifying in several skate species (El Nagar et al. 2010) were optimized for cross-amplification in the R. miraletus species complex. The EST-SSR PCR reactions were performed in a 10µL total volume containing 3µL of gDNA corresponding to ~20ng, 2µL of PCR Buffer (1X), 0.5µL of MgCl2 (1.25mM), 0.8µL of dNTP mix (0.05mM each), 0.5µL of each primer (0.5µM; 0.25µM for LERI 26) and 1U of Taq DNA Polymerase. All PCR reagents were supplied by Promega®, except the primers which were from LifeTechnologies®. DNA amplifications were run on a Biometra T-Gradient Thermocycler as follows: after an initial denaturation at 94°C for 3 min, amplification was performed with 30 cycles consisting of denaturation at 94°C for 30 sec, annealing at 53°C for 30 sec, extension at 72°C for 30 sec, followed by a final extension at 72°C for 10 min. Amplicons were electrophoresed on 2.5 % agarose gel and stored at -20ºC until shipping to Macrogen Europe (Amsterdam, the Netherlands). Individual genotyping was performed on ABI3100 Genetic Analyser (Applied Biosystems), using labelled forward primers and LIZ HD500 (Applied Biosystems) as internal size standard. 2.2.5. Data analysis A total of 275 COI sequence electropherograms was manually edited and aligned by CLUSTAL W software (Thompson et al. 1994) and incorporated into MEGA v.6.0 (Kumar, Stecher & Tamura 2015). The correct amino acidic translation was assessed to exclude the presence of stop codons and sequencing errors (Moulton et al. 2010). For each individual, consensus COI sequences were first compared with published sequences from both the NCBI (http://www.ncbi.nlm.nih.gov/genbank/) and the Barcode of Life Data System (Ratnasingham et al. 2007; BOLD at
(http://blast.ncbi.nlm.nih.gov/Blast.cgi) in order to rule out any error due to mishandling of samples on board or during the laboratory activities. Additional homologous COI sequences of R. miraletus were retrieved from both on-line databases selecting, when accessible, records from different geographical origins: South Africa, Sicilian Channel, Aegean Sea and Israel (Table S1). The retrieved sequences were aligned with those newly generate and a final dataset of 306 COI homologous sequences was obtained.
The number of polymorphic sites (S), the number of haplotypes (H), the haplotype diversity (Hd), the nucleotide diversity (π; Nei 1987) and their standard deviations were calculated using DNASP v.5.0 (Librado et al. 2009). Genetic distances were assessed using MEGA. The same software package was also used to estimate the best evolutionary substitution model following the corrected Akaike Information Criterion (AICc; Akaike 1981). The haplotype frequencies were estimated using ARLEQUIN v.3.5.2.2. (Excoffier et al. 2010).
A total of 256 chromatograms for each of the eight EST-SSR loci were obtained and manually inspected using GENEMAPPER v.5.0 (Applied Biosystems). The allele calling and binning have been performed with GENEMAPPER v.5.0. ML-NullFreq (Kalinowski et al. 2006) and FreeNA (Chapuis & Estoup, 2007) were used to test for the presence of stuttering, large allele dropout and null allele’s artefacts. The multilocus EST-SSR genotypes were analysed using GENETIX v.4.05 (Belkhir et al. 2004) to estimate the observed (HO) and expected heterozigosity (HE) and number of alleles (NA). Jackknifing over loci was performed to assess the single-locus effects on Weir & Cockerham’s F-statistics estimators. The deviation from the Hardy–Weinberg equilibrium (HWE) and Linkage Disequilibrium (LD) was investigated using GENEPOP on the web v.4.2 (Rousset 2008). The allelic richness (Ar) and the inbreeding coefficient (Fis) were estimated using FSTAT v.2.9.3.2 (Goudet 2002). The phylogenetic relationships among individual haplotypes were inferred by parsimony network analysis implemented in the software HAPLOVIEWER (http://www.cibiv.at/~greg/haploviewer) and the dnapars program of the PHYLIP package v.3.6 (Felsenstein 2005). The graphical representation of the resulting network has been modified with Adobe Photoshop. The average genetic distances observed within and between the two identified Central-Southern African and the NE Atlantic-Mediterranean clades of R. miraletus were calculated with MEGA using the Tamura-Nei (1993)’s model implemented therein and compared with the range of COI genetic distances estimated among other congeneric species. Homologous COI sequences of Raja straeleni, Raja microocellata, Raja asterias, Raja brachyura, Raja clavata, Raja montagui, Raja polystigma, Raja
radula and Raja undulata were retrieved from on-line databases (NCBI and BOLD) and inter-species distances were calculated applying the Tamura-Nei model. The population connectivity of R. miraletus was investigated by estimates of Fst and FST values using ARLEQUIN with 10,000 permutations, p<0.05. The Tamura and Nei (1993) substitution model was applied to the mtDNA dataset to estimate FST values. The virtual spatial differentiation and genetic relationships among geographical population samples were assessed through Principal Coordinate Analysis (PCoA) and were conducted on genotypic and haploid genetic distance matrixes. PCoA plots were generated using the packages ‘ade4’ (Dray & Dufour 2007) and ‘ape’ (Paradis et al. 2004) in R environment 3.0.2 (R Core Team 2013). The genetic heterogeneity among the geographical samples was also assessed by the hierarchical analysis of molecular variance (AMOVA, Excoffier et al. 1992). Significance was assessed using a null distribution of the test statistic generated by 10,000 random permutations of the individuals in the samples. The significance threshold of the pairwise comparisons (p<0.05) was adjusted with the sequential Bonferroni correction for multiple simultaneous comparisons (Rice 1989) implemented in the software SGoF+ v.3.8 (Carvajal-Rodriguez & de Uña-Alvarez 2011). Different grouping of the geographical samples was tested, following both a priori subdivisions according to geographical areas of collection and PCoA groups. In order to unravel the individual-based genetic clustering, the EST-SSR dataset was analysed using the Bayesian algorithm implemented in STRUCTURE v.2.3.4 (Falush et al. 2007). This analysis was carried out assuming an admixture ancestry model with the geographical origin of samples as prior information (LOCPRIOR models), associated with a correlated allele frequencies model. For each simulation of K (1-20), five independent replicates were run, setting a burn-in of 200,000 iterations and 500,000 iterations for the Markov Chain Monte Carlo (MCMC) simulation. The most likely value for K based on the STRUCTURE output was determined by both by plotting ln Pr (X|K) vs K (Pritchard et al., 2000) and assessing the ΔK statistic (Evanno et al. 2005) based on a rate of change in the log probabilityof the data as implemented in STRUCTURE HARVESTER (Earl & von Holdt 2012). The results were averaged over multiple runs using CLUMMP (Jakobsson and Rosenberg, 2007) and displayed using DISTRUCT (Rosenberg, 2004) to obtain a bar plot representing the membership coefficients for each individual in each geographical population. The phylogenetic relationships between the Central-Southern African and NE Atlantic-Mediterranean COI lineages was estimated using a Bayesian coalescent approach, implemented in BEAST v.1.8.3 (Drummond & Rambaut 2012). Sequences of R. undulata, the closest related species to R. miraletus, were used as outgroup. The Bayesian reconstruction was obtained using the Hasegawa, Kishino and
Yano (HKY+G) model of evolution (Hasegawa et al. 1985), as the most appropriated model inferred by MEGA software, a strict molecular clock model, the Yule Process as species tree prior, the Piecewise linear and constant root as population size prior. To ensure convergence of the posterior distributions, an MCMC run of 60,000,000 generations sampled every 1,000 generations with the first 25 % of the sampled points removed as burn-in was performed. We analysed the log file using TRACER V.1.6 (Rambaut & Drummond 2007) to calculate the robustness of the posterior distributions for all parameters and recover average divergence time and 95% confidence intervals. The plausible trees obtained with BEAST were summarized using the program TREEANNOTATOR and the resulting phylogenetic relationships among population samples and the posterior probabilities at nodes were visualized with FigTree v.1.4.2 (Rambaut 2014).
2.3. Results 2.3.1. Genetic diversity The COI dataset counted 306 sequences over 23 geographic population samples, while the EST-SSR dataset was made up of a total of 256 individuals distributed in 20 geographic population samples (Figure 1 and Table S1) Figure 1 Geographical distribution of the sampling locations for the European (north-eastern Atlantic and Mediterranean) and African Raja miraletus (aka R. ocellifera from south-eastern Atlantic and western Indian Ocean). Acronyms are used as in Table S1. Sampling locations are overlayered to the IUCN distribution map of R. miraletus available at http://maps.iucnredlist.org/map.html?id=161599.
The final COI alignment consisted of 529 nucleotide positions and counted 76 variable sites (14.3%) and 64 parsimony informative sites (12.1%). The mitochondrial gene polymorphism showed low nucleotide diversity (π) and very high haplotype diversity (Hd). AANG sample was the most polymorphic (Hd = 0.858 ± 0.041 SD, π= 0.02543 ± 0.00380 SD, K = 13.453; Table S5 in Appendix I). The average Tamura-Nei genetic distances (DTN) among geographical samples of the NE Atlantic-Mediterranean were extremely low (DTN =0.0025 ± 0.0011 SE; Table S4 in Appendix I) while those observed among geographical samples of the Central-Southern Africa were an order of magnitude higher (mean TN = 0.0188 ± 0.0031 SE). The DTN between NE Atlantic-Mediterranean and Central-Southern Africa samples were much higher (mean DTN = 0.0734 ± 0.0115 SE) and slightly greater than those estimated from the pairwise comparison with the outgroup R. undulata (DTN ranged from 0.0364 to 0.0697; Table S4 in Appendix I).
Thirty-eight haplotypes were found and none of which was shared between samples from the North-Eastern Atlantic-Mediterranean and Central-Southern African (Fig. 2 and Table S5 Appendix I). The parsimony network of the COI haplotypes (Fig. 2) identified two main haplogroups, which are differentiated by at least 30 mutations and correspond to the Central-Southern African and the NE Atlantic-Mediterranean samples. The former haplogroup included 22 haplotypes that grouped into four largely differentiated geographic clusters occurring in Senegal, Angola and Angola/South Africa. The Senegalese cluster, which coincided with the ASEN sample (N =5), showed three slightly differentiated private haplotypes. On the contrary, the Angolan sample (AANG, N = 28) showed strongly differentiated haplotypes grouped in two endemic Angolan subclusters together and in a third cluster shared with the South African samples (ASAF, total N = 40).
The NE Atlantic-Mediterranean haplogroup included 16 weakly divergent haplotypes (Fig. 2 and Table S5 Appendix I). Four of them were shared by several samples and areas: i) the haplotype Hap_23 was shared by Portuguese, Algerian and Sicilian Channel samples; ii) the most frequent Hap_24 was shared by 12 samples from Algeria, Balearic Islands, Sardinia, Sicilian Channel, Tuscany and Adriatic Sea; iii) the H_26 was shared by samples from Algeria, Sicilian Channel and Ionian Sea; iv) the Hap_31 was shared by Adriatic and Greek samples. In contrast, three endemic haplotypes characterized the Eastern Mediterranean samples of the Israeli coasts and Levantine Sea.
Figure 2 Parsimony network of the COI haplotypes of the European and African R. miraletus. The confidence interval was at 95%. The size of the circles is proportional to the number of individuals that shared that haplotype. The haplotypes are indicated by codes as given in Table S1 in Appendix I. Dashed red lines correspond to the principal oceanographic fronts of Cape Blanc (21°N) and Cape Frio (18°S). For graphical reasons only the most frequent COI haplotypes found in the Mediterranean Sea were reported.
The summary statistics of the eight polymorphic microsatellite loci per geographical sample and over all the loci considered is shown in the Table S6 in the Appendix I. The number of alleles (NA) ranged from six (LERI 40) to 15 (LERI 27). After Bonferroni correction, no significant LD was detected between any pairs of locus and the average mean observed and expected heterozygosity (HO/HE) at eight loci was 0.2595/0.3920. After applying the Bonferroni correction, significant HWE departures were found over all loci in all samples, apart from ASEN, APOR, MALG/03, MMAL/02, MION and MLEV. The Portuguese sample was monomorphic at five loci (LERI 26, LERI 34, LERI 63, LERI 40 and LERI 44). Ml-Nullfreq and FreeNA results detected the presence of null alleles at loci LERI 40, LERI 50 and LERI 44. Nevertheless, we did not exclude any of them, since Jackknife analysis didn’t reveal outliers over the confidence interval. 2.3.2. Population connectivity Because the small sample size affecting some geographical areas and the subsequent decrease in power of the analyses, an appropriate caution should be applied while interpreting the results obtained here. However, similar experimental designs and analytical approaches proved geographical population structure and genetic differentiation at multiple taxonomic levels in other skate species (Pasolini et al. 2011; Plank et al. 2010; Chevolot et al. 2006a).
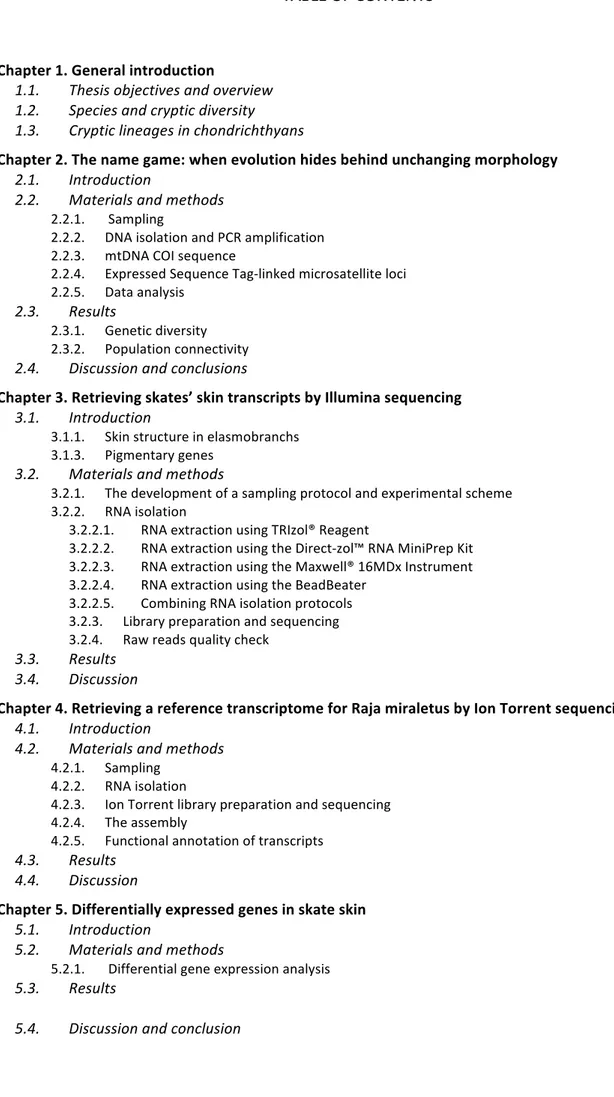
The PCoA (Principal Coordinate Analysis) based on the haploid COI genetic distance (Figure 3a) was performed to assess the virtual spatial differentiation among geographical populations. The PCo1 strongly separated the Central-Southern African samples from those of the NE Atlantic-Mediterranean Sea. Within the former group, PCo1 also differentiated the AANG from ASAF while the PCo2 markedly separated the Senegalese sample (ASEN). The ASAF temporal replicates were in
contrast not differentiated. Within NE Atlantic-Mediterranean Sea, the PCo2 separated geographical samples according to a longitudinal gradient with the Israeli temporal samples (MISR/09 and MISR/14) as the most distinct samples followed by the Levantine and Ionian Sea samples as intermediately differentiated. Similarly, the PCoA based on the genetic distance matrix computed on the EST-SSR data (Figure 3b) mainly separated Central- Southern African and NE Atlantic-Mediterranean samples. A smaller level of differentiation than that revealed by COI data was observed between ASAF and AANG samples. In contrast, microsatellite data confirmed the genetic distinction of the Senegalese sample. The EST-SSR genetic variation also confirmed the longitudinal pattern of differentiation of the NE Atlantic-Mediterranean samples with a marked separation of Portuguese and Central Western Mediterranean samples (APOR, MALG/03, MALG/10, MBAL, MSAR, MTUS/06, MTUS/10, MADV and MMAL/02) from those of the Central-Eastern and Eastern Mediterranean (MION, MNAD1, MNAD2, MSAD1, MSAD2 and MLEV and MIRS/09).
The genetic differentiation among 23 samples based on COI data showed highly significant pairwise Фst values, even after the Bonferroni correction was applied (Table S7 in Appendix I). High levels of differentiation were observed between the Atlantic African and NE Atlantic-Mediterranean samples, but also between Western and Eastern Mediterranean. Accordingly, the EST-SSR data showed a similar pattern of genetic differentiation even after the Bonferroni correction was applied (Table S8 Figure 3a Left side - Plot of the PCoA carried out on COI haplotype genetic distance matrix over all geographical and temporal samples of the Raja miraletus species complex. Figure 3b Right side - Plot of the the PCoA carried out on genotypic EST-SSR genetic Rey’s distance matrix over all geographical samples of the Raja miraletus species complex.
in Appendix I). No significant differentiation was detected between temporal replicates from the same geographical areas, either with mitochondrial and nuclear data. The hierarchical AMOVA performed on the COI dataset and testing five sample groupings, confirmed that 89.81% of the genetic variation was significantly attributable to differences between the two main groups (AMOVA 1, Table S3). In contrast, such proportion of differentiation between two groups was much lower based on EST-SSRs loci (26.07%, P = 0.0006). However, the proportion of genetic variation among populations within groups was high and indicated a significant genetic heterogeneity within groups (23.93%, P = 0). The grouping tested in the AMOVA 5 (seven groups) better explained the total mitochondrial genetic variation among samples with a very low proportion of the genetic variation among populations within groups over that among groups (1%). On the contrary, the lowest proportion of the genetic variation among populations within groups over that among groups with the EST-SSR data was obtained in the AMOVA 3 (16.9%) with five groups separating the three Central Southern African samples, the NE Atlantic and Western Mediterranean samples (including those of the Sicilian Channel) and the Eastern Mediterranean samples (including the Ionian sample).
The analysis of STRUCTURE outputs did not provide a clear indication of the most likely number of clusters, therefore results from K=2 to K=7 were assessed (Figure 4). The barplot of the clustering K=2 revealed the separation of the samples from NE Atlantic-Mediterranean Sea and Central-Southern Africa (Figure 4) with an admixed genetic composition of the Senegalese individuals. The clustering K=3 and K=4 further discriminated between samples from Western and Eastern Mediterranean as well as the Angolan sample from those of the South Africa. The clustering K = 5, corresponding to the best grouping revealed by AMOVAs (Table S3) contributed to differentiate the samples from Sicilian Channel (MADV and MMAL/02) from the other NE Atlantic and Western Mediterranean samples while any relevant separation within the Eastern Mediterranean was appreciated. This AMOVA revealed that AANG displayed an intermediate genetic composition between the South African and Senegalese clusters and that the Senegalese genetic component was also exhibited by two South African individuals. The clustering K=6-7 did not contribute a better resolution of population structure
Figure 4 Barplots of the STRUCTURE analysis of Raja miraletus species complex based on the complete EST-SSRs dataset and with estimated K=2-7. On the horizontal axis are reported the geographic samples, while on the vertical axis is reported the percentage of individual membership to a given genetic cluster. Single vertical bar represents one individual. Fractions of colour of a bar represent the estimated membership to a certain genetic group of that individual. Vertical black lines separate different sampling
Bayesian approach using MCMC simulation was used to test any speciation signal (Yule process) between the Central-Southern African and NE-Atlantic-Mediterranean lineages (Figure 5, see Table S5 in Appendix I for haplotype distribution among samples). All effective sample size (ESS) values exceeded 200, indicating a solid evaluation of all parameters. The model based on the substitution rate estimated for mtDNA showed a clear separation between the Central-Southern African (from Hap_1 to Hap_23) and the NE-Atlantic-Mediterranean haplotypes (Hap_24 to Hap_30; Fig 4), with exception of the Hap_12 (an Angolan haplotype) that clustered together with the haplotypes of the NE-Atlantic-Mediterranean lineage. The phylogenetic relationships among lineages and haplotypes were congruent with the relationships obtained with the parsimony network results (Figure 2). Furthermore, within the main Central-Southern African lineage, three clusters of haplotypes were reconstructed with high posterior probability (p=1): the most basal cluster formed by six Angolan haplotypes (Hap_11, Hap_13, Hap_15, Hap_16, Hap_18 and Hap_19), a Senegalese cluster (Hap_20, Hap_21 and Hap_22), and a third Angolan/South African cluster formed by all the South African haplotypes (Hap_1-9) and the Angolan Hap_14 and Hap_17.
Figure 5 Phylogenetic relationships of Raja miraletus species complex based on the COI haplotypes. Refer to Tab S3 for the distribution of the COI haplotypes among R. miraletus geographical samples. Raja undulata was used as an outgroup for the analysis. Numbers near nodes represent the posterior probability value.
2.4. Discussion and conclusions The evolutionary and phylogenetic history of skates has been recently described with the increased popularity of DNA-based molecular techniques. Many authors have demonstrated the correlations between Earth’s paleo-climatic events or the occurrence of oceanographic barriers and the great levels of diversification of skates at multiple taxonomic levels (Naylor et al. 2012; Pasolini et al. 2011; Iglesias et al. 2010; Compagno & Ebert, 2007; Chevolot et al. 2006; Valsecchi et al. 2005). In parallel, the ability of integrated methodological approaches combining morphological and molecular data in detecting taxonomic and geographic species boundaries of skates have amplified the number of studies and the amount of knowledge supporting species’ risk assessment and conservation action plans (Dulvy & Reynolds 2009; Iglesias et al. 2010; Griffiths et al. 2010; Cannas et al. 2010; Frodella et al. 2016; Cariani et al. 2017). The combination between massive sampling and DNA barcoding of skates carried out prevalently in the Atlantic and in the Mediterranean over broad geographical ranges have revealed the occurrence of several cryptic species and species complexes behind the high level of morpho-anatomical and ecological stasis (Iglesias et al. 2010; Naylor et al. 2012; Frodella et al. 2016; Cariani et al. 2017). The recent achievement that Raja miraletus, behind a distinctive and quite constant pattern of the dorsal body side, has a status of species complex (i.e. three valid species R. miraletus, R. ocellifera, R. parva sp. nov. together with a not yet described taxon only identified by the mtDNA haplotype at the NADH2 gene; Naylor et al. 2012; Last & Séret 2016), skyrocketed the interest for an evolutionary appraisal based on a deeper and more extensive analysis using massive sampling and nuclear/mitochondrial combined genetic data. This study, based on an unprecedented number of individual specimens of the Raja miraletus species complex collected from the areas where the four taxa occurred and on the coupling of the sequence variation of the universal COI barcode and the allele frequency of eight polymorphic EST- linked microsatellite loci, provided advances in resolving the “name game” in this intriguing and enigmatic skate.
Mitochondrial and microsatellite data I obtained consistently agreed in genetically defining the taxonomic and geographical boundary of Raja miraletus L. 1758 which is distributed in the whole Mediterranean Sea and in the adjacent NE Atlantic Ocean, at least in the Portuguese coastal waters. The great divergence of this taxon shown by a Tamura-Nei genetic distance estimated between the NE Atlantic-Mediterranean clade and the Central-Southern African clade (0.073) greater than the corresponding pairwise interspecific estimates obtained among several congeneric species spoke in
favour of a specific level of differentiation. In the NE Atlantic and Mediterranean area, such species resulted structured in at least two main populations genetically well differentiated: the “western population” inhabiting the NE Atlantic coastal waters and those of the Western Mediterranean from Gibraltar Strait to the Sicilian Channel and the “eastern population”, inhabiting the Eastern Mediterranean Sea from the Ionian and Adriatic Sea to the easternmost Israeli coasts. The transition area in the Sicilian Channel that separates Western and Eastern Mediterranean biogeographic sectors (Bianchi 2007; Coll et al. 2010) showed a slight genetic differentiation of the brown skates living in this area within the Western Mediterranean. The genetic similarity of temporal replicates tested only some geographical areas (Algeria, Tuscany, Sicilian Channel and Israel) over a time range corresponding to two generations of R. miraletus speaks in favour of an interannual stability of population genetic structure. Even if the evident unbalance in the sampling design of R. miraletus between Mediterranean and adjacent NE Atlantic, there was no differentiation between populations of R. miraletus from the two areas. This suggested that the Gibraltar strait does not represent an effective geographical barrier to gene flow between Atlantic and Mediterranean populations. On this debate, controversial patterns were obtained in the thornback skate R. clavata by Chevolot et al. (2006) and Pasolini et al. (2011). Whilst Chevolot et al. (2006) detected spatial genetic differentiation and restricted gene flow between NE Atlantic and Mediterranean thornback skates by analysing the genetic variation at the cytochrome b and species-specific microsatellite loci, Pasolini et al. (2011) did not detect substantial divergence between population samples of the same species collected from the two areas using more polymorphic loci such as the mitochondrial non-coding region D-loop and genomic markers as the Amplified Fragment Length Polymorphisms (AFLPs). Using the D-loop sequence marker and only two samples of small size (N = 14), Griffiths et al. (2010) also detected a weak but significant divergence and restricted or null gene flow between longnosed skates Dipturus oxyrhinchus collected from the NE Atlantic (Norway, Rockall) and Western Mediterranean (Balearic Islands). This comparative data led to suppose that the Strait of Gibraltar cannot always represent a barrier to gene flow for skates and other marine organisms, rather than an accession gate to ancient refugia (Patarnello et al. 2007). The marked population genetic structure of R. miraletus detected within the Mediterranean was never detected in other Raja species by previous population genetic studies carried out with similar sampling design and genetic markers (i.e. uniparental polymorphic mitochondrial DNA sequences, biparental genomic and nuclear loci). Within the Mediterranean R. clavata, Chevolot et al. (2006) have analysed the variation of the mtDNA cytochrome b and species-specific microsatellite loci in
three geographical samples (Corsica, Adriatic Sea and Black Sea) detecting any significant structure. Pasolini et al. (2011) found a weak but detectable genetic divergence only of the thornback skates collected from the Eastern Mediterranean, without any restriction of gene flow between western and eastern Mediterranean samples. Recently, Frodella et al. (2016) using the same markers I used in R. miraletus, have detected genetic homogeneity and high level of genetic connectivity among Western and Central Mediterranean population samples of the spotted skate R. polystigma, a small-sized species endemic of the basin. Only a weak but detectable divergence was shown by the Adriatic deme because a private fixed COI haplotype characterized by a single nucleotide mutation. Such divergence is quite similar to that observed in the R. miraletus collected from the Eastern Mediterranean (Israeli and Levantine coastal waters) which showed fixed private haplotypes slightly differentiated by 1-3 nucleotide mutations from the closest haplotype distributed prevalently in the population samples of the Adriatic and Aegean Seas. Subtle genetic divergence in marine fish populations with shallow evolutionary histories can be better assessed by mtDNA markers than nuclear ones (Hoarau et al. 2004). Haploid maternal inheritance of mtDNA can lead to smaller effective population size (Birky et al. 1989) and thus faster genetic drift. Population structure within the Mediterranean could be related to bathymetry and hydrogeological fronts or discontinuities. The shallow bathymetry characterizing the Southwest part of the basin would likely enhance the transition of brown skate, except for the Ionian area from which the divergence pattern displayed a shift. The area ranging from the easternmost part of Sicily and the adjacent geo-morphological depression of the Calabrian Arc (down to 3,000m of depth) is dominated from cyclonic/anti-cyclonic inversions of water masses. The combination of these environmental features could have driven the differentiation of the Eastern Mediterranean samples. The “name game” appeared more complicated to be resolved in the Central-Southern African taxa of the R. miraletus species complex than in the NE Atlantic and Mediterranean. Mitochondrial and nuclear markers contributed differently to define taxonomic and geographical species boundaries. It has to be considered that molecular taxonomic methods using both nuclear and mitochondrial data have proven useful in assessing relationships between pairs of morphologically similar taxa (Morgan et al. 2012, Arlyza et al. 2013) and that the maternal inheritance of mtDNA in Vertebrates combined with ecological and behavioural processes such as natal homing and phylopatry can lead to profound discordance between genetic patterns of structuring obtained with mitochondrial DNA markers with respect to those obtained with biparentally-inherited nuclear DNA markers on the same individuals (see for an example Pardini et al. 2001). According to the concept of biological species, speciation is