Escaping Satiation Dynamics:
Some Evidence from British Houseiiold Data
Andreas Chai*Griffith Business School, Griffith University Alessio Moneta
Institute of Economics, Scuola Superiore Sant' Anna JEL D12; C14; O33. '
Demand-satiation; engel curves; structural change; nonparametric smoothing.
S u m m a r y • •
The tendency of sectoral demand to satiate has long been argued to he a key driver of the struc-tural change in an economy (Pasinetti 1981; Saviotti 2001). This literature raises the question as to what extent cross-sectional patterns of household expenditure can be used to make inferences about how the demand for goods and services will grow over time. Moreover, if indeed satiation does take place, then firms and entrepreneurs could react to this situation by innovating goods and services in order to overcome stagnation in demand growth (Witt 2001). We empirically investigate this 'satiation-escape' hypothesis by examining the inter-temporal dynamics of Engel curves and their derivatives, which reflect how household spending on a good changes with income. Taking into account changes in the price level, we investigate whether Engel curves that exhibit cross-section satiation tend to exhibit over time an upwards shift in the satiation level jointly with a shift in position and shape. Evidence suggests that this is actually the case.
1 Introduction
The past decade has witnessed important shifts in the scope and focus of evolutionary economics (Fagerberg 2003; Witt 2008). One of these has been the effort to improve the empirical tractability of evolutionary theories (Windrum et al. 2007). In addition, there has been ongoing effort to gain a better understanding of the role that demand plays in driving long run economic evolution (Metcalfe 2001; Witt 2001). In the case ofthe latter, a good example is the study of the innovation process, previously focused on how new goods and production technologies are developed by visionary entrepreneurs and firms.
We would like to thank Nadine Chlaß, André Lorentz and Ulrich Witt for suggestions and comments on a previous version of this paper. We are also grateful to Christiane Bradler and Sebastian Müller for research assistance. The usual disclaimer applies. We also thank the U.K. Central Statistical Office for making available the U.K. Family Expenditure Survey data through the Economic and Social Data Service. • ' •
Today, a range of studies examine the role of users in co-developing innovation (Von Hippel 2005; Malerba et al. 2007). However, beyond the role it plays in the emergence process, less work has has done to empirically assess how the demand side affects more macroscopic features of economic evolution, such as structural change (Krüger 2008; Saviott/Pyka 2013).
This is quite curious as many theoretical studies of structural change have pointed out that the non-homothetic nature of household demand plays an important role in this process (Pasinetti 1981; Andersen 2001; Aoki/Yoshikawa 2002; Metcalfe et al. 2006; Foelmi/ZweimüUer 2008). In particular, the cornerstone of demand-driven structural change theory is tbe claim that the growth rate of demand for any good will eventu-ally decline due to inevitable changes in the composition of household demand that take place as household income rises (Pasinetti 1981; Saviotti 2001; Metcalfe et al. 2006). This slowdown in demand causes a decline in an industry's productivity growth, leading to a stagnation in the growth rate of the industry. A major challenge for any growing economy is what Andersen (2001: 144) calls the "Pasinetti problem." This is the prob-lem of finding the correct institutional setting through which economies can maintain full employment through fostering the emergence of new sectors that enable full-employment to be maintained and ensure continues economic growth.
In this paper we aim to contribute a little to the frontiers of evolutionary economics by empirically considering the relationship between these apparent slowdowns in demand and how they may play a role in stimulating the emergence of innovations. Here Witt points out that any slowdown in the growth of demand will create an incentive for incum-bent firms to innovate their goods and improve the quality of tbeir goods and services in such a way as to 'escape' demand satiation and avoid sectoral stagnation (Witt 2001: 39). For example, Ruprecht (2005) offers convincing historical evidence that flrms in the food sector, when faced with a decline in the growth rate of demand for natural sweeteners such as sugar, developed and released new products in the form of artificial sweeteners that allowed per capita consumption spending on sweeteners to continue to rise. There-fore, if firms possess some capacity to delay or even completely overcome slowdowns in aggregate growth by engaging in product innovation, then this suggests that the actual rate of structural change observed in tbe economy is also linked to the flrms (dis)incentives for engaging in product innovation. We label this statement about the dynamic interac-tion between the growth rates of demand and the corresponding sector's tendency to engage in product innovations as the 'satiation-escape' hypothesis. This hypothesis rep-resents a new contribution to the existing literature studying the link between innova-tion and demand (Fontana/Guerzoni 2008). Previously, many studies in this area have focused on how the level of demand positively affects innovative activity (Schmookler 1966; Kleinknecht/Verspagen 1990). Less attention has paid to how the growth rate of demand affects innovation, as suggested by the satiation-escape hypothesis.
To investigate this hypothesis we examine long run deflated expenditure data from the U.K. Family Expenditure Survey relative to 18 different expenditure categories observed between 1974 and 2001. We study how slowdowns in aggregate demand for goods can be used to predict major changes in how household spending patterns react to rising household income, as reflected in the position and shape of the Engel curve (henceforth EC). The EC shows how household spending on a good varies with household income. As discussed by Pasinetti (1981) and Saviotti and Pyka (2013), the growth rate of demand for a good can be inferred from estimating the derivative of the EC for that good. The derivative of an EC, whose variables enter in logarithmic terms, is a measure of the income
elasticity as it indicates how household spending on a good will change with marginal changes in income. If the EC derivative is equal to zero at a certain level of income, independently of its functional form, it means that household spending ceases to rise at that level of income as this rises. Thus, in order to empirically verify slowdowns in demand, we study the extent to which EC derivatives reach a zero value - representing perfect income inelasticity. If the ECs are stable (in shape and position) over time, such a satiation level suggests that the growth rate of demand for the product will eventually slow down and equal zero as an increasing number of households reach the satiation level of expenditure.
Concerning our methodology, it is crucial that we do not make a priori assumption about the functional form of the ECs to ensure an unbiased investigation of the EC derivative. Therefore we use nonparametric estimation methods. Previously most work on ECs was parametric in nature, which involved scholars making a priori assumptions about the shape of the EC. In this paper, we use a kernel-based estimation of the derivative of the EC that allows us to examine how many goods exhibit satiation levels. In addition, studying the EC derivative - rather than the EC itself - represents a more direct approach to investigating the empirical existence of satiation. This represents an advantage over other recent studies that have found empirical evidence for satiation indirectly by studying the shape of the ECs (Chai/Moneta forthcoming).
Our estimates of ECs and their derivatives reveal that a type of polarisation process appears to be taking place in the manner in which household spending patters have evolved over time. For some goods and services, the effect of income on spending is waning over time such that the good is becoming increasingly income inelastic. In other cases, the effect of income seems to be increasing over time in a positive direction, such that the goods become even more of a luxury over time. Concerting satiation, we find that this phenomenon is indeed a relatively prevalent phenomenon across a wide variety of goods and services. These results indicate that it is not just such goods as food that display satiation, but indeed a diverse range of other goods and services also seems to possess this property.
In addition, we proceed to search for evidence of satiation-escape dynamics by examining whether there is any relationship between the extent to which the EC derivative of goods display satiation at beginning of the observed period (1974), on the one hand, and the observed instabihty in the position and shape of the EC, on the other hand. In particular, controlling for nominal increases in price levels, we check the stability of the EC in two dimensions: position and shape. The former test examines if the position of the EC has shifted across time in real terms, whilst the last test standardizes the position of the EC and examines whether shape of the EC significantly differs between two time points. Our results show that many of these ECs that exhibited satiation at the beginning of the observed period are found to be unstable over time, both in terms of their position and shape.
In sum, these results call forth a more nuanced understanding of demand-driven structural change. On the one hand, demand-satiation is found to be a widespread phenomenon across a wide variety of good and services in UK expenditure patterns. On the other hand, the evidence shows how malleable consumption patterns are over time. This suggests that demand satiation does not seem to pose a inevitable or imminent threat to sectoral growth, partially due to the innovative responses of suppliers to slowdowns in growth. While there are a number of contributing factors that may explain the observed instability, we uncover some tentative evidence for this instability to be related to the extent to which
slowdowns in household aggregate demand are present in the expenditure patterns of good in previous decades, as predicted by the satiation-escape hypothesis.
The paper is structured as follows. Section 2 provides an overview of the connection between demand satiation and structural change. In section 3 we formulate the hypothe-ses to be tested and present the econometric method to test these hypothehypothe-ses. Section 4 presents the data and section 5 the empirical results. Section 6 concludes.
2 Growth rate of demand and innovation: a possible link
The general notion that a industry's size and character is influenced by the magnitude of demand is not new. Adam Smith (1776) conjectured that the division of labour was lim-ited by the extent of the market. Around one hundred flfty years later, Alfred Marschall (1919) emphasized the central role of demand in determining returns to scale. Contem-porary theories of demand-driven structural change are different from these traditional ideas as they posit an important link between the growth rate of demand and the relative size of different sectors of the economy. Solomon Fabricant (1942) recognized that while an industry can only grow as much as the size of the market allows, this constraint is itself influenced by the growth rate of per capita income (dynamic increasing returns). These ideas grew with popularity as new data emerged about the developmental trajec-tories of different industries (Kuznets 1973). In this context Colin Clark (1950) noted that consumption expenditure does not expand in a uniform manner across all goods and services as income rises. This unevenness has natural implications for the industrial composition of an economy (cfr. also Eisher 1935).
A clear formulation of the link between the growth rate of demand and the industrial composition of an economy can be found in Luigi Pasinetti's ground-breaking contribu-tion "Structural Change and Economic Growth" (1981). This work formally sets out an alternative vision of the economic growth process which explicitly accounts for structural change as an endogenous outcome of this growth process. Its central theme is that signif-icant changes in an economy's sectoral composition occur as the very consequence of the economic growth process. As growth in certain sectors reaches a limit, inventive effort and investment must be periodically redirected towards new sectors that yield higher productivity. A major challenge is to find the correct institutional setting through which economies can maintain full employment. This is what Andersen (2001: 144) dubs the "Pasinetti problem".
Speciflcally, Pasinetti argues that there is an upper limit on how much an individual con-sumer is willing to spend on any good or service as income rises. In his words, "there is no commodity for which any individual's consumption can be increased indefinitely. An upper saturation level exists for all types of goods and services although at different levels of real income" (Pasinetti 1981: 77). We label this conjecture the satiation
hypoth-esis. Since satiation' levels occur at very different levels of income (possibly also "out of
sample") and the paths leading to these levels may be of very different shapes and steep, increases in consumption expenditure, at any level of income, tend to concentrate on
We prefer the term "satiation" instead of "saturation" to avoid confusion with the innovation diffusion literature. In this literature the term "saturation" refers to the point in time when all potential users have adopted the innovation (Rogers 1962). "Satiation" instead refers to the fail of expenditure of exceeding a certain limit even when income increases infinitely.
(b) (c)
Source: Pasinetti 1981:73.
Figure 1 Chart a is the hypothesized EC for goods "necessary for physiological rasons (e.g. food)", chart b is the hypothesized EC for almost all otber cases, while chart c is the hypothesized EC tor inferior goods.
particular goods and services. Pasinetti (1981: 73) hypothesized that goods and services possess one of the three types of ECs displayed in Eigure 1. Thus, there are significant differences in the productivity and growth rates between those industries whose products attract increases in consumption expenditure, and those whose products do not. Note that satiation is a property of the growth rate - not of the level - of demand with respect to a particular sector.
More recently, several scholars have followed Pasinetti's idea of ascribing the cause of structural change to demand satiation, see e.g. Andersen (2001); Saviotti (2001); Aoki and Yoshikawa (2002); Metcalfe et al. (2006). However, the basic question remains open: How credible is the assumption that expenditure on all goods and services has an asymp-totic limit? Lewbel (2008) notes that ECs for certain goods (e.g. food) are close to a log-linear fit, while ECs for other goods and services are highly nonlinear, even in log formulation. Note that structural change is possible if one observes a "slowdown" rather than a "satiation" of household spending on a good. Satiation implies that, no matter how much household income increases, household expenditure on a good stays below a certain (good specific) level. In contrast, a slowdown simply means that as income increases, the growth rate of expenditures declines: in other words, the income elasticity of good declines with increasing income. A slowdown is a necessary but not sufflcient condition for observing satiation in household expenditure.
Implicit in Pasinetti's hypothesis about the shapes of ECs (see again Figure 1), on which his argument about structural change is based, is that observations about how expen-ditures change as household income increases can be interpreted as expansion path for expenditures over time. In other words, the hypothesized shapes of ECs are used to pre-dict what will happen in the future, provided that income rises with time. This inference assumes that the underlying EC is stable and will not change over time. This assumption means that, given a rise in household income from x at time t to x + h at time t+l, the household at time t+l with income x-\-h will display a consumption behaviour similar or identical to the household that possessed a income x + h already at time f.
However, ECs can become unstable for a number of factors.^ As Haavelmo (1947: 341) stated: "The ordinary family-expenditure functions or Engel curves ... cannot be assumed to remain invariant under transformations of the income distribution." Recently, Foellmi and Zweimüller (2006) hypothesized that changes in the household income distribution may also foster the emergence of higher quality products by creating a wealthy class of households willing to pay high prices for new products. Changes in households' demo-graphic characteristics has also been shown to cause shifts in ECs (cfr. Blow et al. 2004). Demographic trends may cause changes in the EC simply by changing the frequency of cer-tain types of consumers in the population. Moreover, changes in relative prices may also affect the position and shape of the EC. There are models of demand which do account for relative price changes (cfr. Deaton/Muellbauer 1980). These models, however, are usually made on strong assumptions about consumer preferences. Pasinetti avoided this problem by focusing on long run dynamics, where price effects may be treated as temporary fluc-tuations in income (Pasinetti 1981: 73). While prices were acknowledged to flatten or steepen the shape of the EC, he maintained they cannot influence the fundamental shape of the EC.
2.1 Innovations and slowdowns in demand growth
From a Schumpeterian perspective, an important factor that should be considered in this matter is how the stability of ECs is affected by new product innovations, which can severely disrupt the composition of household expenditure (Bils/Klenow 2001).^ In this regard, Witt (2001) conjectures that the slowdown in the growth rate of demand may itself represent an emerging incentive for firms to engage in product innovation. Faced with such a drastic trend, one must consider what entrepreneurs and firms could do to revert the slowdown in the growth rate of demand. An industry in such a predicament can hardly be expected to do nothing. Witt thus suggests that firms may innovate their goods and services in such a way as to avoid satiation (Witt 2001: 39). When faced with a slowdown in demand, industries have a tendency to innovate and upgrade the quality of products in order to delay the onset of demand satiation.
For example, Ruprecht's (2005) work on the emergence of artificial sweeteners industry investigates how a particular good evolved to serve multiple wants given both satiation in the consumption of sugar and evolving consumer knowledge about consumers satisfy their want for health. Ruprecht showed how continued increases in consumer spending on the consumption of sweetness is essential to understand how a new low calorie alter-native (artificial sweeteners) became more appealing to consumers relative to existing high calorie products (sugar) by establishing a new connection between the act of con-suming it and the consumer's want for health. Historical evidence shows that in the mid 1970s there was a major health campaign in Europe to make consumer aware of the link between sugar consumption and obesity, which triggered substantial changes in the food consumption patterns of US and European consumers. Taking this into account provides
For a comparison of time series total expenditure with estimates derived from cross sectional data see Ogaki (1992).
Indeed Saviotti and Pyka (2013) note that the complete satiation is only observable if one assumes no structural change in the economy as the emergence of new goods induces a shift in the satiation level of pre-existing goods and services. Hence complete satiation would only occur if the composition of the economic system were to remain constant.
an explanation of how a new variety of low-calories sweeteners emerged that appealed to not only consumer's wants for sweetness, but also their health concerns.
Moreover, other historical case studies have also highlighted how it is precisely because of innovation by suppliers that satiation levels of demand have not been reached. In the case of washing machines, Woersdoerfer (2010) outlines how the diffusion of washing machines was critically mediated by not only the consumer's want to avoid drudgery, but social norms about cleanliness which affected the consumer's demand for clean clothes. Because of the changing nature of these norms, satiation in the demand for clean clothes has not been reached until very recently. Elsewhere, Manig and Moneta (forthcoming) uncover empirical evidence that a slowdown in the quantity of food consumption in contemporary Russian consumption patterns correlates with demand for new varieties and higher quality food. Thus, while there may exist a slowdown in the quantity of goods consumed, industries appear to have successful overcome any tendencies for household spending on food to slowdown by introducing new food varieties which are perceived to be of a higher quality by consumers.
It is worth noting that this escaping satiation hypothesis stands in stark contrast to other recent studies wKich argue that the growth of demand may increase the capacity to inno-vate of a sector (Fontana/Guerzoni 2008). For example, Schmookler (1966) argued that there is a positive correlation between the size of the market and the expected profitability of innovation. More recent contributions show that the existence of expert and special-ized consumers may encourage innovative activity by firm as they act as a type of resource or 'capability' that firms can utilize in tbe innovation process (Teubal 1979; Von Hippel 1986). Hence, it should be emphasized that there are number of ways in which the size of market demand is seen to increase the probability of observing innovative activity. In the following, we focus on the argument that slowdowns in demand may trigger prod-uct innovations that cause instability in the shape of ECs. We call this 'satiation-escape' dynamics. It provides an alternative view of how two important phenomena relate to each other: the evolving composition of demand, on the one hand, and the industrial composition of the economy, on the other. Rather than changes in the composition of demand spurning the transformation of the economy in a way that leads to emergence of new sectors replacing exiting sectors in the economy, this body of evidence suggests that demand growth leads more to a kind of self-transformation of industries in the sense that the same industry will engage in product innovations that may alter the character of the goods and services that it produces, but ultimately not the actual group of flrms who are undertaking the production.
3 Hypotheses and method
This section details our empirical approach to investigating satiation (Hypothesis 1 ) and satiation escape dynamics (Hypothesis 2) outlined in the previous section. The claim that satiation is a general property is based on early empirical studies about the shape of ECs. In particular, Pasinetti (1981) cites the study of Aitchison and Brown (1954), which suggests that almost all ECs can be estimated with a functional form that features a satiation level and is based on the log normal distribution." Since then, the EC shape has been the subject
Similarly, Keynes's (2006) consumption function, featuring a consumption growth less than pro-portional to income growth, has been claimed to descend from empirical regularities discovered in household income-expenditure patterns by Ernst Engel (Houthakker 2010).
of much debate in the empirical literature which has been conducted in the context of parametric estimation methodology. The parametric approach was predominant for much of the twentieth century and required researchers to make a priori assumptions about the shape of the EC. Via the gradual shift away from linear towards log-linear (Working 1943) and eventually nonlinear functional forms (Prais 1952; Banks et al. 1997), some consideration was given to functional forms that imposed a satiation level of expenditure (Aitchison/Brown 1954).
3.1 Hypothesis 1: satiation
We first investigate evidence regarding the following hypothesis:
Hypothesis 1 : Satiation The Engel curves of most expenditure categories exhibit an
inter-val of income where expenditure is insensitive to income increases.
We assess this hypothesis without making any a priori assumption about the shape of the EC, using nonparametric technique for estimation. The term "nonparametric" refers to the fact that the researcher does not specify a priori the functional form for an object (in our case the EC) being estimated. In the case of parametric regression, which encompasses most estimates, the functional form of the EC is assumed to be known, as in the linear formulation of Allen and Bowley (1935), in the log-linear formulation of Working (1943), and the log-rank-three formulation of Leser (1963)^ In the case of the nonparametric approach, in contrast, the only assumption that is made about the EC is that the function has to be smooth (continuous derivative). This is well in tune with the recent findings that ECs display, across years and products, different curvatures and one rarely possesses prior knowledge on their functional form (Banks et al. 1997).
In this paper we use kernel smoothers, in the spirit of Banks et al. (1997) and Hardie and Jerison (1991). For a discussion of kernel smoothers vis-à-vis other nonparametric smoothers, the reader is referred to Engel and Kneip (1996). Our sample is made of house-hold expenditure yf, on a particular category of goods or services and total expenditure
Xfj,{oth = 1, ...,n, where n is the number of households. It is assumed that the sample is
generated by a matrix {(X¿, Y¿)}^_j of independent and identically distributed random variables with joint probability density function fx.yix, y)- As in any regression method, the focus here is on the conditional mean of Y given X, given by
-l-oo
r+oo
g{x) = E(Y|X = x)= yfY\x(y\x)dy,
J—co
where fY\x(y\x) is the conditional probability density function of Y given X. Whereas the parametric approach assumes that the function g(x) can be described by a few parameters (e.g. in the Working-Leser model g(x) = oix-\-ßx log(x)), the nonparametric kernel regres-sion provides as estimate oí gix) as a weighted average of the observations {Y¿ = yh}f,Z"-In estimating g{x), the weights are constructed in such a way such that the nearer the X^ value of an observation is to x, the heavier is the weight placed on that observation. The
kernel function iC is a weight function that changes the weight allocated to the
observa-tion in a neighborhood of x in a continuous way. Many different kernel funcobserva-tions can be used, but all of them have to be positive and integrate to one.
We propose to estimate gix) via a local linear smoother, as deflned in Fan and Gijbels (1992) and Fan (1993). The estimator is deflned as gixf,), such that
H
k=l
where K¿,^( ) is a suitable kernel function depending on a bandwidth bj^. An alternative estimator would be the local constant flt which corresponds to
H • • ' ' ' .
Y ^ '• J è H . — , . . . , . • ( J
F r o m (2), it is possible t o derive either t h e N a d a r a y a W a t s o n e s t i m a t o r (see e.g. W a t -son 1964) w h e n Wf^ibn) = K ¿ ^ ( x ¿ - x/,) or t h e G a s s e r - M ü l l e r e s t i m a t o r (see e.g. Gasser/Müller 1984) w h e n Wj^ibn) = ¡K[,^iu - xi,)du. It can be p r o v e d t h a t t h e local linear e s t i m a t o r (1) has a smaller flnite s a m p l e bias, is asymptotically efflcient, a n d has a better b e h a v i o u r at the e x t r e m e s of t h e s a m p l e (see e.g. Fan/Gijbels 2 0 0 3 , for a c o m -p a r i s o n ) . M o r e o v e r , by solving the m a x i m i z a t i o n in (1), w e o b t a i n also a local estimate of the slope S w h i c h is a n estimate of the flrst derivative of t h e Engle curves. Therefore, for o u r empirical analysis w e use t h e local linear e s t i m a t o r displayed in e q u a t i o n (1).^ T h e choice of t h e b a n d w i d t h can be based o n different m e t h o d s . In o u r estimations b e l o w (see n e x t section) w e c h o o s e t h e b a n d w i d t h o n the basis of the minimization of a p o l y n o m i a l a p p r o x i m a t i o n of t h e m e a n integrated s q u a r e error {of gixi,}), following t h e a p p r o a c h p r o p o s e d by F a n a n d Gijbels ( 2 0 0 3 : Section 4 . 2 ) .
W h e n considering h o w ECs vary across t i m e , t h e w a y in w h i c h ECs are deflned w i t h respect t o prices plays a decisive role. In this r e g a r d , w e focus on real E C , w h i c h are o b t a i n e d by dividing t o t a l c o n s u m p t i o n by the C o n s u m e r Price I n d e x a n d regressing this q u a n t i t y o n real e x p e n d i t u r e for a p a r t i c u l a r p r o d u c t (expenditure divided price i n d e x for a p a r t i c u l a r p r o d u c t ) (cfr. H ä r d l e / J e r i s o n 1 9 9 1 ; Paulin 1 9 9 8 ) .
3.2 Hypothesis 2 : satiation escape ,
O u r second hypothesis is t h e following: • - • • •
Hypothesis 2: For those e x p e n d i t u r e categories for w h i c h satiation is observed in the
Engel C u r v e , s p e n d i n g will exhibit a high degree of instability over time, as observed in the p o s i t i o n , s h a p e a n d satiation level of the Engel C u r v e .
In o t h e r w o r d s , w e seek t o find evidence for a relationship between t h e e x t e n t t o w h i c h ECs exhibit satiation across different g o o d s a n d services, a n d h o w unstable they are over time. By 'stability' of an EC w e refer t o t h e e x t e n t its position a n d s h a p e (in the a p p r o p r i a t e l y deflated i n c o m e - e x p e n d i t u r e space) r e m a i n i n v a r i a n t over time. As m e n t i o n e d a b o v e , fac-t o r s c o n fac-t r i b u fac-t i n g fac-t o insfac-tabilifac-ty include fac-t h e relafac-tive price of e x p e n d i fac-t u r e cafac-tegories, changes in the income d i s t r i b u t i o n , a n d d e m o g r a p h i c changes. If satiation escape d y n a m i c s occurs in a persistently m a n n e r , t h e n its effects s h o u l d be observable in the changes of t h e flrst
derivative of the EC. The first derivative reflects the rate at which expenditure changes as income increases. It is greater than zero if expenditure increases as household income grows. On the other hand, if it is less than zero, then expenditure decreases as income increases. If expenditure slows down because of satiation, then we expect the first deriva-tive to be posideriva-tive but reach zero at some point as income increases. This monotonically decreasing functional form ultimately represents the growth constraint faced by indus-tries due to satiation. In terms of the indusindus-tries' efforts to escape satiation, a successful innovation should have such an effect that it raises the overall income level by which the satiation is reached, which is directly reflected in the point at which the first derivative of the EC reaches zero.
To compare the shape of ECs across different years independently from changes in its position, we also define maximum standardized ECs, which are obtained from the real ECs by rescaling the axes, dividing x and y variables by their maximum values in the sample. In this way, we control for the fact that expenditures have shifted across years and we concentrate on the change of the shape of the EC. Maximum standardized ECs work also around the problem of changing relative prices, which is not controlled by real ECs.
Moreover, to compare real and maximum-standardized ECs we use a nonparametric test for equality of multivariate distributions based on Euclidian distance between sample elements. The test statistic, called the energy test, has been introduced by Székely and Rizzo (2004) and, for the two-sample case, is defined by
-, «2 "1
where «j and «2 are the sample sizes of the two samples X and Y, and 11.11 is the Euclidian norm.' As shown in Székely and Rizzo (2004), this test is suitable for testing the com-posite testing of equal distributions, when distributions are unspecified and is universally consistent against all fixed alternatives with finite second moments.
4 Data
We use data from the U.K. family expenditure survey (EES) taken from the years 1974, 1986, 2001. Each year a stratified sample of approximately 7000 households are inter-viewed by the UK Office of National Statistics. Erom this survey and diary records we access household spending data (as well as total expenditures) for eighteen categories: (1) food; eight sub-categories of food ((2) beef; (3) lamb; (4) pork; (5) flsh; (6) fresh milk; (7) soft drinks; (8) sugar granulated; (9) catering); (10) clothing; three sub-categories of clothing ((11) men's outer clothing; (12) women's outer clothing; (13) footwear); (14) furniture; (15) audiovisual equipment (shortly referred to as "radio and TV"); (16) news-papers, books and periodicals; (17) domestic services; (18) postage and telephones. A more detailed description of these categories is provided in Appendix A.
As the table in Appendix A shows, the eighteen categories we analyze refer to different levels of aggregation (2, 4, and 6 digit levels). The idea is indeed to address our theo-retical hypotheses by looking at a variety of goods and services for which we have the corresponding price indices (necessary to deflate expenditures). The inclusion of differ-ent levels of aggregation in our analysis permits us to check the possible dependency of
the results on the level of aggregation. Another remark is in order. Appendix A lists the expenditure codes for 2001. We analyze expenditure patterns for 1974 and 1986 as well, which have slightly different codes, but consistent with those of 2001. Expenditures are deflated using the Retail Price Indices, with 2001 as base year. We report in Appendix B the price indices we have used, which describe price movements in the years 1974, 1986, and 2001.
We select these three years (1974, 1986, 2001) on the basis of two criteria: (i) attaining years that were close to the beginning, middle and end of the entire sample of household spending data available to us, and (ii) avoiding sampling household spending that coin-cided with strong fluctuations in UK GDP (see Figure 2). Concerning (i), the earliest FES data that was available to us was 1968. Unfortunately, a close look at the aggregation method used in the FES data from 1968-1971 cast some doubt on the extent to which it was consistent with FES data from later years. In addition, the period 1970-1975 wit-nessed volatile fluctuations in GDP (see Figure 2). This made the task of choosing one year from the early period of the sample quite difficult. We selected 1974 as it was the first year in which the UK economy slowed down after a period of rapid expansion in 1972-1973. The GDP contraction in 1974 was mainly due to the 1973 oil crises that caused the price of crude oil to rise sharply. Choosing a later year such as 1975 was ruled out as inflation in the UK peaked at around 25 per cent in that year (Hendry 2001). Concerning the middle of the sample, 1986 represents a year in which UK GDP was growing close to the long term trend. Finally, 2001 was the last year of household spending data available to us when we undertook this analysis.
Figure 2 Crowth rate of UK GDP 1968-2002. Annualized trend is seasonally adjusted and measured using 2009 prices. Source: UK Office of National Statistics.
In terms of which spending categories to examine, we selected aggregate food given its nondurable nature and close theoretical connection with the concept satiation. In addi-tion, some subcategories of food were also used including certain meats (e.g. lamb and beef) and drinks (milk and soft drinks). Note that these subcategories are not exhaus-tive. These were included in order to check whether indeed the ECs for subcategories indeed exhibited relatively less stability compared to aggregate categories. In addition, we also examined aggregate category clothing and footwear, audiovisual equipment, and furniture. Audiovisual equipment is composed of radio and TV expenditures and related equipment. Furniture includes such basic categories such as couches, beds, tables but excludes electrical goods such as fridges and washing machines. With regards to ser-vices, domestic services and telephone services were chosen. The former includes the hire of domestic cleaners, the use of dry cleaners, and repair costs for furniture and clothing. The latter includes telephone line rental, mobile telephone contracts, and previously the use of telegrams. In sum, one must keep in mind that these aggregate categories tend to include a relatively wide collection of goods and services, including inferior, normal and luxury goods, this reinforces the point that one must be careful in interpreting the EC as relatively different markets emerge across different levels of income.
With respect to the surveyed households, we have also data on demographic character-istics, in particular we know tbe age of the head of primary household maintainer, and the number of members. In order to get relatively (from a demographic point of view) homogeneous households, we restrict our analysis to households with number of mem-bers between 2 and 3 and age ofthe head between 21 and 60. We have checked, however, tbe robustness of our empirical results to some changes in demographic characteristics. We trim zero-expenditures and outliers using the approach used by Banks et al. (1997): those observations that lie outside three standard deviations of the mean on either the total expenditure or any of the particular expenditure are not included in the sample. Table 1 displays the sample sizes of the categories of expenditures considered, for the 1974, 1986, 2001.
Table 1 Sample sizes Year (1) Food (2) Beef (3) Lamb (4) Pork (5) Fisb (6) Fresh Milk (7) Soft Drinks (8) Sugar granulated (9) Catering (10) Glotbing
(11) Men's Oufer Clothing (12) Women's Oufer Clothing (13) Footwear
(14) Furniture (15) Audiovisual
(16) Nev^ispaper and Periodicals (17) Domestic Services (18) Telephone services 1974 2071 1755 1080 1038 1529 1962 269 1748 1923 782 515 805 521 604 2032 1499 1840 1940 1986 2170 • 1726 797 1080 1738 1994 312 1463 1957 990 807 959 725 891 •• mm 1341 2008 1896 2001 1755 1090 389 634 1230 1664 276 724 1543 978 686 727 341 1669 1680 869 1694 1727
Engel Curve Food 1974 Engel Curve Food 2001 S-400 600 800 1000 total expenditure o 200 400 600 800 1000 1200 1400 total expenditure
Engel Curve Ciothing 1974 Engel Curve Ciothing 2001
s s -O o _ ••''TÍ • •'''•.'•. • ' 200 400 600 800 total expenditure S -200 400 600 800 1000 1-200 1400 total expenditure
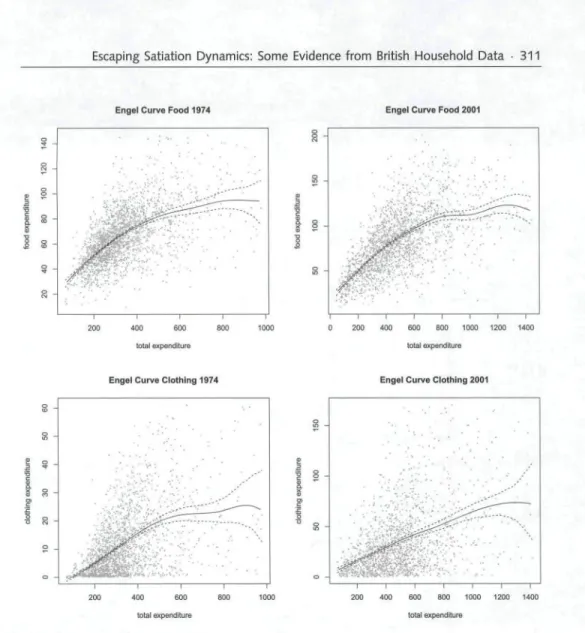
Figure 3 Solid lines display real Engel curves for food (1974), food (2001), clothing (1974),
clothing (2001); dashed lines describe 95% confidence intervals, obtained with a bootstrap procedure; gray points denote the household data on which the estimation is based. Engel curves are estimated by means of the local linear estimator.
Figure 3 displays the sunflower plots of (deflated) food expenditure versus (deflated) total expenditure for 1974 and 2001 joint with the estimated Engel curves (inclusive of 95% bootstrap confidence intervals). Analogous plots are shown for clothing expenditures.
5 Empirical results
We now report our results from estimating the ECs and the EC derivatives and discuss to what extent they support the satiation and satiation-escape hypotheses. We begin with some brief general remarks that juxtapose the results for ECs with those for the EC deriva-tives and then turn to formally test the hypotheses. Figure 4 displays the real ECs for
500 1000 1500 total expenditure » 1000 tolal expenditure Soft Drinks 1500 0 500 1000 lotal expenditure S u a a r 1500 0 500 1000 tolai expenditure r.atarínn q § 2 " t , ^-^-— 68 / 500 1000 1500
total expenditure total expenditure
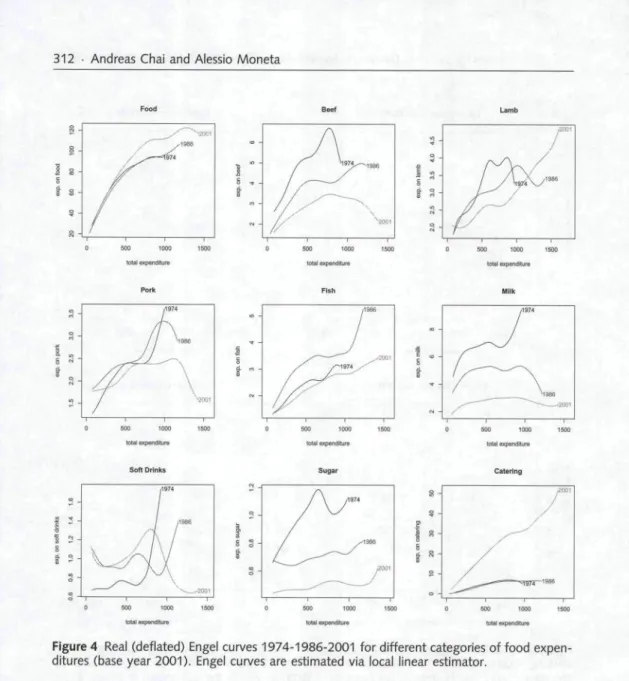
Figure 4 Real (deflated) Engel curves 1974-1986-2001 for different categories of food
expen-ditures (base year 2001). Engel curves are estimated via local linear estimator.
aggregate food, some of its subcategories (beef, lamb, pork, flsh, milk, sugar, and soft drinks) for the selected years. Figure 5 displays the real ECs for clothing, some of its subcategories (women's outer clothing, men's outer clothing, and footwear), audiovisual equipment, newspapers and periodicals, telephone services, furniture, and total domestic services for the selected years. We dub these 'real' ECs as the expenditure of the category is deflated using the respective prices index. In addition, total expenditure is deflated using the Retail Price Index. In this way, the figure delivers a better understanding of how the actual quantities consumed have changed as household income rises, as well as over time.'
Shift in the EC and EC derivatives do, however, reflect changes in relative prices, which will be discussed below.
Clothing Women Outer Clothing Men Outer Clothing 500 1000 1500 tota) expenditure 1000 1500 total expenditure Radio and TV 500 1000 1500 total expenditure 500 1000 1500 total expenditure 1000 1500 total expenditure
Newspapers and Periodicals Teiephone and Telegrams Total Domestic Servie
500 1000 1500 total expenditure
1000 1500 total expenditure
Figure 5 Real (deflated) Engel curves 1974-1986-2001 tor different categories ot expenditures
(base year 2001). Engel curves are estimated via local linear estimator.
A salient feature of these figures is the high degree of volatility is exhibited in the shape of ECs (and consequently, their derivatives) at high income levels. This is due to the fact that the functional form is influenced by the distribution of observations. As most household expenditure surveys have less observations at high levels of household income, some doubt may be cast on the properties of nonparametric Engel curves at these levels. However, in the case of the UK Eamily Expenditure Survey, Tanner(1998) studied the reliability of EES expenditure data by comparing it to spending figures found in the UK National Accounts. She found that the ratio of housing total EES expenditure to non-housing total expenditure in the National Accounts was around 90 per cent between 1974
and 1992.' Moreover, this problem is also mitigated by the fact that our sample sizes are relatively large: the range of observations used in our estimations is between 269 (tobacco 1974) and 2180 (food 1986), with an average of 1258 (see again Table 1) .
Moreover these figures reveal that a type of polarisation process appears to be taking place in how the ECs for different goods and services have evolved over time: for some goods and services the effect of income on spending is waning over time such that the good is becoming increasingly income inelastic. In other cases, the effect of income seems to be increasing over time in a positive direction, such that the goods become even more of a luxury over time. Concerning the former effect. Figure 4 shows how several food categories exhibit declining income elasticities, including beef, pork, milk, soft drinks, sugar, and to a lesser extent fish. In all of these cases, the 2001 EC appears to be situated at lower spending level than the 1974 ECs. Also, it is worth noting that the EC for total food expenditure appears to be relatively stable and slightly trending upwards. This contrast between the aggregate food spending and its subcategories can be explained by the fact that household expenditure on other food categories has increased in the same time period, for example spending on food has increased substantially between 1974 and 2001 (see Figure 4). The finding of a relatively stable EC for food is consistent with other studies: Blow et al. (2004: 9) found that average budget share spending on food by UK households remained relatively stable between 1975 and 1999.
Beyond food, the second part of the polarisation process is observed in the ECs for many durable goods that exhibit the reverse tendency: an upward shift in the position of ECs that suggests that the marginal propensity to consume these goods as household income rises is growing over time. Figure 5 shows such upward trends in aggregate clothing, the subcategories of clothing, footwear, audiovisual, telephones and telegrams, as well as total domestic services. The long term growth of expenditure in these categories stands in stark contrast to the ECs of other non-food categories, such as newspaper and periodicals, for which expenditure levels has been relatively stable. Taken together, these figures provide a rough snapshot of the turbulent manner in which the composition of demand changed over the approximately three decades. Demand did not expand in a homogeneous fashion across all goods services. Rather, while some type of goods stagnated, others experienced surges in demand. In some of these cases, this surge in spending is attributable to lower relative prices. As shown in Appendix B, prices of audiovisual goods, were relatively more expensive in 1974 than in 2001. However, in other categories, spending increased while prices rose roughly in line with the general inflation rate (e.g. aggregate clothing) Turning to the EC derivatives. Figures 6 and 7 display how the derivatives of real ECs for the same categories have changed between 1974 and 2001. Eigure 8 displays the differences among ECs derivatives for food, clothing, and total domestic services.'" Since these figures represent the derivatives of ECs, the income effects of goods are represented by the level of the curve and not by the change in its slope. In the case of ECs (discussed above), the income effect is represented by the change in the slope of the curve. A casual glance at these figures appear to show further evidence of a polarisation process: the position of some EC derivatives have drifted closer to horizontal zero value line over time, while the position of others have drifted away from the zero line between 1974 and
This compares favourably to the US Consumer Expenditure Survey (CES) in which Slesnick (1992) found that 1989 per capita total expenditure only captures 65 per cent of per capita total expen-diture recorded in the National Income and Product Accounts.
As these figures feature 9 5 % confidence intervals (obtained by means of bootstrapping), we omitted the year 1986 to ensure that the confidence intervals were clearly depicted.
500 1000 1500 total expenditure 500 1000 1500 tola I expenditure 500 1000 1500 total expenditure w 1000 1500 lotal expetidllure
Figure 6 Derivative of real (deflated) Engel curves 1974-2001 for different categories of food
expenditures inclusive of 95% confidence intervals. Derivative of Fngel curves are estimated via local linear estimator. Confidence intervals are obtained through a bootstrap procedure. We have also added an horizontal line to represent the zero values.
2001. For many food subcategories whose ECs exhibited a decline in position over time, the figure shows that their EC derivative also appears to have drifted closer to the dotted zero value line. For example, the EC derivatives for beef, pork, milk, soft drinks and sugar all appear to be closer to zero in 2001 than they did in 1974. This suggests that as household spending on these goods has declined over time, there has also been a decline in the marginal propensity of households to increase their spending on these good as their income rises. In other words, these goods appear to be also becoming increasingly income inelastic over time.
In contrast, among non-food categories for which household spending has increased over time, the EC derivative appears to have drifted away from the zero value line. Figure 7
Clothing Women Outer Clothing len Outer Clothing 1 total e F U I 1000 xpenditure -niture 1500 0 500 1000 1500 total expenditura Radio and TV iOO 1000 1500 total sxpenrflture
Newspapers and Periodicals
0 500 1000 1500 total expenditure
Telephone and Telegrams
500 1000 1500 total expenditure 500 1000 1500 total expenditure 500 1000 1500 tola) expenditure
Total Domestic Services
1000 1500 total expenditure
Figure 7 Derivative of real (deflated) Engel curves 1974-2001 for different categories of
expen-ditures inclusive of 95% confidence intervals. Derivative of Engel curves are estimated via local linear estimator. Confidence intervals are obtained through a bootstrap procedure. We have also added an horizontal line to represent the zero values.
shows that the 2001 EC derivative estimated for aggregate clothing, audiovisual equip-ment and total domestic services has drifted rightwards from the respective 1974 EC derivative for the same goods. This suggests that the income elasticity of the goods has increased over time, such that they have more of a 'luxury' in the observed time period. To formally validate these general observations, we now proceed with measuring the frequency of satiation across the different goods (Hypothesis 1). We do this by distin-guishing between strong and weak satiation. We say that an EC displays weak satiation when the EC derivative is equal to zero at any level of income and it displays strong satiation when the EC derivative together with its upper and lower confidence interval are equal to zero at any level of income. Weak satiation implies that a particular class
of expenditure shows a tendency to satiate but this tendency is not significant or stable enough. In this way, we proceed to test whether ECs display weak or strong satiation on the basis of the analysis of EC derivatives.
Table 2 summarizes the results for weak and strong satiation across categories of expen-ditures. We find that aggregate food expenditure (flrst chart of Figure 6) displays weak satiation at some income level, but not strong satiation in both 1974 and 2001 ECs. As such, this result shows how even for a basic good such as food that is relatively closely linked to the satisfaction of human needs and possesses a concave-shaped EC, the for-mal existence of satiation can not be taken for granted. Given substantial increases in household income in the observed period, an interesting general feature of these formal results is that weak satiation is more frequent in 1974 than in 2001. However, strong satiation is only slightly less frequent in 2001 than in 1974 (3 out of 18 in 2001 vs. 5 out of 18 in 1974), while both strong and weak satiation are both completely absent in four categories in 2001 and in no category in 1974. Hence these findings generally support the notion that satiation is prevalent among a wide range of goods in 1974 (hypothesis 1). However, this evidence is not very robust over time, an aspect which we will now turn to discuss.
Table 2 Frequency o f Satiation • = • . '
Expenditure Categories Satiation
1974 2001 Food Beef Lamb Pork Fisb Fresh milk Soft drinks Sugar Catering Clothing
Men's Outer Clothing Women's Outer Clothing Footwear
Furniture Audiovisual
> Newspapers and periodicals Domestic Services
Telephone services
Concerning Hypothesis 2, these results support the notion that there is link between the degree to which the EC of a good exhibits satiation and the extent to which the upper limit of the EC tends to shift upwards over time. Firstly it is worth noting generally that the spending categories which experienced an upwards shift in ECs over time (discussed above), including aggregate food, clothing and its sub-categories, audiovisual goods, tele-phone services, and domestic services exhibit some form of satiation. This is however, not surprising as satiation appears to be a general tendency among all ECs in 1974. More intriguingly, among the four expenditure categories which switch in status from exhibiting
weak weak weak weak weak weak weak weak weak weak weak weak strong strong strong weak strong strong weak strong weak weak -weak strong weak — weak weak -strong weak weak -weak weak
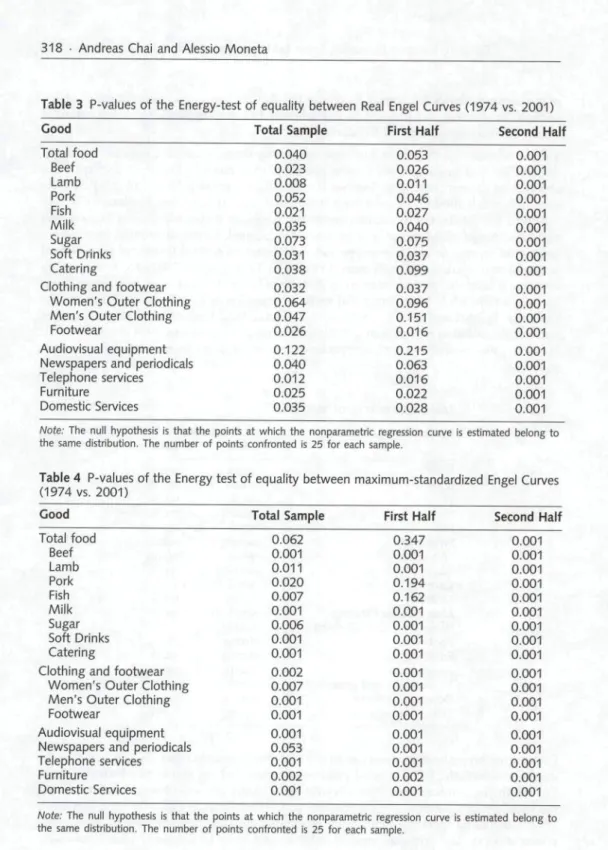
Table 3 P-values of tbe Energy-test of equality between Real Engel Curves (1974 vs. 2001) Good Total food Beef , ,1-. Lamb ., Pork Fish Milk Sugar Soft Drinks .• -Catering
Clothing and footwear
Women's Outer Clothing ' ' Men's Outer Clothing
Footwear
Audiovisual equipment •• Newspapers and periodicals Telephone services Furniture Domestic Services Total Sample 0.040 0.023 0.008 0.052 0.021 0.035 0.073 0.031 0.038 0.032 0 . 0 6 4 •' •>< ' . 0.047 0.026 0.122 0.040 0.012 0.025 0.035 First Half 0.053 0.026 0.011 0.046 0.027 0.040 0.075 0.037 0.099 0.037 0.096 0.151 0.016 0.215 0.063 0.016 0.022 0.028 Second Half 0.001 0.001 0.001 0.001 0.001 0.001 0.001 0.001 0.001 0.001 0.001 0.001 0.001 0.001 0.001 0.001 0.001 0.001
Note: The null hypothesis is that the points at which the nonparametric regression curve is estimated belong to
the same distribution. The number of points confronted is 25 for each sample.
Table 4 P-values of the Energy test of equality between maximum-standardized Engel Curves
(1974 vs. 2001) Good Total food Beef Lamb Pork Fisb Milk Sugar Sott Drinks Catering
Clothing and footviiear Women's Outer Clothing Men's Outer Clothing Footwear
Audiovisual equipment Newspapers and periodicals Telephone services Furniture Domestic Services Total Sample 0.062 0.001 0.011 0.020 0.007 .. 0.001 :- 0.006 0.001 - ••.' 0 . 0 0 1 1 •' 0.002 0.007 0.001 0.001 0.001 0.053 0.001 ' 0.002 0.001 First Half 0.347 0.001 0.001 0.194 0.162 0.001 0.001 0.001 0.001 0.001 0.001 0.001 0.001 0.001 0.001 0.001 0.002 0.001 Second Half 0.001 0.001 0.001 0.001 0.001 0.001 0.001 0.001 0.001 0.001 0.001 0.001 0.001 0.001 0.001 0.001 0.001 0.001
Woie.- The null hypothesis is that the points at which the nonparametric regression curve is estimated belong to the same distribution. The number of points confronted is 25 for each sample.
strong satiation in 1974 to exhibiting weak satiation in 2001, all goods, except for fur-niture, exhibit a strong upward trend in the satiation level of expenditure between 1974 and 2001 (see again Figures 4 and 5). When considering this result, it should be noted that our estimations control for nominal price increases. Particularly interesting is the EC for clothing where the level of expenditure at which satiation occurs nearly quadru-ples between 1974 and 2001. Note that these are relatively heterogeneous expenditure categories as regards prices movements (cfr. Appendix B).
This instability may explain why the results for Hypothesis 1 are so mixed: As the sati-ation level of the ECs shifts upwards, it becomes empirically less likely to identify the point at which satiation occurs. This supports the observation made by Saviotti and Pyka (2013) that satiation may be unobservable precisely because of the structural change tak-ing place in the economy. At the same time, for some expenditure categories the satiation limit has fallen, including milk (by a factor of 5) sugar, furniture and newspapers and periodicals. These industries seem to be facing definite hardship, possibly due to intensive price competition coupled with the effect (for some of them) of foreign imports. We note that there does not appear to be any significant difference in the instability dynamics of those goods and service that displayed strong satiation, relative to those that displayed weak satiation.
The shift test, whose results are displayed in Table 3, examines whether the basic position of the EC has shifted between 1974 and 2004, regardless of its shape. The null hypoth-esis is that there has been no change in the position and the p-values report at which confidence level this null hypothesis can be rejected. Secondly, we examined if the shape of the EC has changed over time, controlling for its position. We do this by standard-izing the position of the EC (shape test in Table 4) using maximum-standardized ECs, as described in the previous section. For both of these tables we also examine if there are substantial differences between household with below average income (the "poor", reported in the second column), and those households with above average income (the "rich", reported in the third column). This was done because we suspected that stability was biased towards the lower end of the EC given the tendency for household expendi-ture to be more volatile at higher levels of income. This prediction is confirmed by the fact that there are more frequent rejections of the null hypothesis in column three (second half) than column two (first half). To clearly compare results across the two tests. Table 5 summarizes both tables.
In some instances the results of these tests reveal findings that contrast sharply from the estimation of ECs and their derivatives discussed above. For example audiovisual equip-ment is found to possess a very stable EC in Table 3), although Figure 4 shows that the EC appears to have shifted up considerably between 1974 and 2001. This can be explained when viewing the results for relatively rich and poor households in Table 3). Column three shows that spending on audiovisual has indeed significantly shifted for relatively wealthy households (p-value of 0.001), however this is not the case for households with a below average household income (p-values of 0.215 in column 2). As such, the aggregate results can be explained by the fact that the stability among low income households has outweighed the instability of spending revealed among low income households. Indeed there are several other instances in which the EC exhibits relative stability among the poor, but not among the rich. This includes aggregate food, pork, sugar, women's outer clothing, men's outer clothing, newspapers and periodicals.
Turning towards the results for the shape test (Table 4), these results confirm that, in the majority of cases, a shift in the EC is also accompanied with a significant change in
the shape of the EC (e.g. all the subcategories of food in the full sample). In other cases, aggregate food exhibits no change in shape (p value of 0.062 in Table 4) although it does exhibit a change in position (p value of 0.04 in Table 3). A similar result is found among the expenditure patterns of poor households on pork and fish, where the shape of the ECs appears to have not changed (p-value of 0.194 and 0.162 respectively), but the position of the EC has changed significantly.
All in all, this series of instability tests (as summarized in Table 5) provide some new insights into which types of goods and services exhibited highly volatile spending patterns between 1974 and 2001 in the sense that they exhibited upward trends in the satiation level over time (column 1), exhibited a significant shift in the EC position (column 2), and exhibited a significant change in the shape of the EC (column 3). Of the 18 categories that we examined, only seven categories were found to report significant changes across all three of these dimensions: soft drinks, catering, aggregate clothing, men's outer clothing, domestic services and telephone services. Of these, it is worth noting that three exhibited strong satiation in 1974 (domestic services, telephone services and footwear), while the rest exhibited weak satiation (soft drinks, catering, aggregate clothing and men's total clothing). As such, three out of the five spending categories that reported strong satiation in Table 2 have exhibited highly volatile spending patterns between 1974 and 2001. The other two spending categories that exhibited strong satiation (furniture and audiovisual goods) were found to be unstable in two of the three dimensions reported in the table. Thus we interpret these results as providing some tentative evidence of a link between the extent to which satiation is exhibited, on the one hand, and the degree to which spending patterns are unstable over time. In terms of the role that innovations play in driving this instability, it is worth noting that for some of the goods which have exhibited both strong satiation in 1974 and a high degree of instability in their ECs between 1974 and 2001, here
Table 5 Summary of evidence for fhe escaping satiation hypothesis af fhe 95% confidence level Expenditure Categories Food Beef Lamb Pork Fish .• • . Fresh milk ' Soft drinks Sugar Catering Clothing
Men's Oufer Clothing Women's Outer Clothing Footwear
Furniture Audiovisual
Newspapers and periodicals Domestic Services Telephone services upward shift In satiation level yes no no • ' n o ' ' no no yes no yes yes yes yes yes no yes no yes yes shift in EC position yes yes yes no yes yes yes no yes yes yes no yes yes no yes yes yes shift in EC shape no yes yes yes yes yes yes yes yes yes yes yes yes yes yes no yes yes
have been a number of radical product innovation in these markets; for example, product related telecommunications changed fundamentally between 1974 and 2001. This would include the invention and diffusion of the mobile phones, answering machines, internet services, and mobile paging services. In the case of clothing, the liberalization of UK trade barriers has also seen an increase in the variety of clothing goods and brands that are available to UK consumers (Gereffi 1999). In both cases, new goods have been introduced into markets following a period in which the sector of the economy was facing a slowdown in the growth rate of demand in the 1970s.
However, the extent to which the slowdown in the growth rate of demand causes these product innovation to take place can not be answered by this study alone. We emphasize that this study has several limitations as the methodology we employ does not allow us to control for other sources of EC instability, such as changes in the underlying income distribution and relative price changes. In another study, we have indeed found a link between EC stability and changes in the income distribution and the relative prices of goods Chai and Moneta (forthcoming). The income distribution has changed significantly in the observed time period in that income inequality has grown in the UK. To the extent that there is a greater distance between rich and poor households one the one hand, and that rich household have reached new levels of affluence not previously observed, we expect this to play some role in driving the shape of the EC.
Concerning the role of relative prices, we have acknowledged in the discussion above that these have played a role in determining the shape and position of ECs in the observed period. More future work needs to be done to study how relative prices and the corre-sponding cross price elasticities do or do not affect EC instability. Here it is interesting to note that Pasinetti argued that price changes can only temporarily postpone or antic-ipate the onset of demand satiation (Pasinetti 1981: 73). In particular, this logic suggest that if the relative price of a good falls, we would expect satiation to be more evident in spending, given that a greater number of households would reach the satiation level of spending. Our results show that while the relative prices for some goods have fallen over time (e.g. audiovisual goods) the satiation level of the good has nevertheless shifted up - not down - over time. As such, this counterintuitive results suggest other dynamics, such as the satiation-escape hypothesis, need to be studied in order to properly account for long run trend in consumption.
To investigate how robust these results are across households' demographic characteristics we repeated our analysis for different groups: households with two members (no limits in age), and households with 3-4 members (household maintainer's age between 21 and 60). The gist of the results are stable enough, in particular the fact that most of the categories tends to exhibit at least weak satiation, and in some cases strong satiation. It is also quite robust the result that most categories tend to be unstable in terms of shifts in position and shape. However, the test we implemented (energy test) tend to be quite sensitive to sample size, which changes significantly across groups of demographically homogeneous households, so that the details of these results should be taken with caution.
Einally, another interesting aspect of EC derivatives is to examine whether evidence can be found for an order to exist in the different rates at which ECs slowdown across differ-ent goods and services (Moneta/Chair forthcoming). Pasinetti (1981) discussed the fact that certain types of household expenditure are only possible if other, more important types of expenditure have been appropriately satisfied. Comparing the EC derivatives across goods may thus provide some evidence of a hierarchy in goods in that goods which slowdown first are of higher priority to goods which slowdown last. In Figure 8, we plot
Derivative reai EC 1974 Derivative real EC 2001
400 600
total expenditure
400 600 800 1000 1200 1400
tota! expenditure
Figure 8 Comparison of derivatives of real Engel curves (witb 95% confidence intervals) across
three categories. Derivative of Engel curves are estimated via local linear estimator. Confidence intervals are obtained through a bootstrap procedure.
the flrst derivative of food, clothing and total domestic services to preliminarily examine whether such a order exists and how stable it is over time. On the left chart, the estimation for 1974 suggests that food is the flrst category to slow down because its EC derivative significantly tends downwards at very lowest level of income. Indeed the derivative of food EC suggests that even among the poorest households in the sample, the rate at which household spending on food grows with rising income begins to slowdown (consistent with Engel's Eaw). The second EC derivative to slowdown is clothing and finally domes-tic services. Total domesdomes-tic services, on the other hand, nears zero relatively early but the flrst derivative is declining only at higher levels of income. On the right chart, the results for 2001 are shown, and again a relatively similar pattern appears except that domestic services reveals a upward turn at higher income levels. Of course, how representative these selected categories are of the entire order of consumption expenditures is indeed questionable, and we leave it to future work to uncover more systematically the stability in the order of satiation in consumption expenditures (see also Moneta/Chai forthcom-ing). Nevertheless, these results do tentatively suggest that we may expect to find relative stability in the order at which different types of goods and services that serve different types of wants reach satiation.
6 Conclusion '
This paper has cast but a mere glance on the work involved in undertaking a more rig-orous, empirically-orientated examination of the shape and evolution of ECs and their implications for structural change. The data on consumption expenditure represents a rich source of information that delivers insights into the demand environment which industries face. While many have used the shape of the ECs as an inspiration for modeling the emer-gence of bottlenecks to economic growth in the form of demand satiation, little effort has
been made to consistently exploit information on their changing nature to better under-stand the degree to which satiation is a hard constraint on industry growth and whether industries can and have successfully escaped this predicament through innovation. As such, if indeed a convincing case is to be made about the central role that structural change plays in evolving capitalist economies, then data on consumption expenditure patterns must cease to be a mere inspiration and instead be systematically used to derive insights into the malleability of consumer expenditure patterns over time. Eurthermore, this must be accompanied with a proper theory concerning the motivations and learn-ing patterns that are involved in the consumption process, and how these tend to vary across both income levels and different types of goods and services. Our evidence suggests that satiation is a property which is not uniformly shared across all goods and services, as predicted by Pasinetti (1981). At the same time, it is a property which seems to be shared by a wide variety of goods and services, and not just by food, as it was predicted by hypothesis 1. As such, it reinforces the point that one cannot simply assume that all industries face a satiation point sooner or later. Eurthermore, we flnd evidence that many ECs which possess the satiation property tend to change in such a way that the absolute level at which expenditure ceases to grow with increasing income tends to shift up over time (as predicted in hypothesis 2). This suggests that the onset of a slowdown in expen-diture growth for an industry is not necessarily an inescapable predicament in that it may stimulate innovation in goods and services which may significantly reshape consumption patterns.
In conclusion, we emphasize that this work has several limitations which we hope can be addressed in future work. This study formally ignores others possible sources of EC instability, including changes in the income distribution, the role of business cycles, and demographic trends in the population. All of these factors can affect the shape of ECs. In this sense, more work needs to be done to properly account for the effects of these factors so that the magnitude of EC instability that can be attributed to satiation escape dynamics can be properly identified. In spite of these limitations, the results of this study can be considered to be tentative evidence for a link between the extent to which ECs display satiation and the extent to which they are unstable over time. Many of the categories that displayed evidence for this link are associated with variety growth and the introduction of radical product innovations, such as aggregate clothing, telephone services and audio-visual equipment. Eor example, telephone services exhibited strong satiation in 1974 and a high degree of instability in its EC between 1974 and 2001. During this time period several new goods were introduced into this category, including answering machines and mobile telephones.
Appendix A
Description of the 18 expenditure categories considered. The numbers in brackets refer to the eighteen categories we used. The other numbers refer to the original 2001 EES code.
FES code FES description FOOD
Meat and meat products beef and veal (uncooked) lamb (uncooked) pork (uncooked)
Fish, shellfish and products Milk and milk products Fresh milk
Beverages (non-alcoholic) food drinks
Sugar, preserves and confectionery sugar
Food, non-alcoholic drink from catering establishment CLOTHING AND FOOTWEAR
Men's outerwear
Boys' outerwear (aged 5-15) Women's outerwear Girls' outerwear (aged 5-15) Footwear
HOUSEHOLD GOODS Furniture and furnishings
TELEVISION, AUDIO, BOOKS, STATIONERY, LEISURE GOODS Audiovisual equipment
Newspapers, magazines, books, stationery
DOMESTIC AND PAID SERVICES, POSTAGE, PHONE, SUBSCRIPTIONS Postage and telephones
(1) (2) (3) (4) (5) (6) (7) (8) (9) (10) (11) (12) (13) (14) (15) (16) (17) (18) 03. 03.05 03.05.01 03.05.02 03.05.03 03.06 03.02 03.02.01 03.10 03.10.03 03.09 03.09.01 03.14 06 06.01.01 06.01.03 06.01.02 06.01.04 06.04 07 07.01 12 12.01 12.03 08 08.02