Cardiac Magnetic Resonance
Does Subclinical Hypothyroidism
Affect Cardiac Pump Performance?
Evidence From a Magnetic Resonance Imaging Study
Andrea Ripoli, PHD,* Alessandro Pingitore, MD, PHD,* Brunella Favilli, MSC,* Antonio Bottoni, MD,*
Stefano Turchi, BSC,* Nael F. Osman, PHD,† Daniele De Marchi, RT,* Massimo Lombardi, MD,*
Antonio L’Abbate, MD,‡ Giorgio Iervasi, MD* Pisa, Italy and Baltimore, Maryland
OBJECTIVES We sought to assess the effects of subclinical hypothyroidism (SHT) on the cardiac volumes and function.
BACKGROUND The cardiovascular system is one of the principal targets of thyroid hormones. Subclinical hypothyroidism is a common disorder that may represent “early” thyroid failure.
METHODS Thyroid profile was evaluated in 30 females with SHT and 20 matched control subjects. Left ventricular end-diastolic volume (EDV) and end-systolic volume (ESV), stroke volume (SV), cardiac index (CI), and systemic vascular resistance (SVR) were calculated by cardiac magnetic resonance (CMR). Regional greatest systolic lengthening (E1) and greatest systolic shortening (E2) were calculated by tagging CMR.
RESULTS EDV was lower in SHT than in controls (64.3⫾ 8.7 ml/m2vs. 81.4⫾ 11.3 ml/m2, p⬍ 0.001),
as well as SVR (38.9⫾ 7.5 ml/m2vs. 52.5⫾ 6.1 ml/m2, p⬍ 0.001) and CI (2.6 ⫾ 0.5 l/[min·m2]
vs. 3.7⫾ 0.4 l/[min·m2], p⬍ 0.001). Systemic vascular resistance was higher in SHT (12.5 ⫾ 2.5
mm Hg·min/[l·m2] vs. 8.6⫾ 1.1 mm Hg·min/[l·m2], p⫽ 0.003). The E1 was higher in controls
than in SHT at the basal (p⫽ 0.007), equatorial (p ⫽ 0.05), and apical (p ⫽ 0.008) levels, as well as E2 at the equatorial (p⫽ 0.001) and apical (p ⫽ 0.001) levels. All parameters normalized after replacement therapy. A negative correlation between TSH and EDV (p ⬍ 0.001), SV (p ⬍ 0.001), CI (p⬍ 0.001), and E1 at the apical level (p ⬍ 0.001) and a positive correlation between TSH and SVR (p⬍ 0.001) and E2 at the apical level (p ⬍ 0.001) were found.
CONCLUSIONS Subclinical hypothyroidism significantly decreased cardiac preload, whereas it increased afterload with a consequent reduction in SV and cardiac output. Replacement therapy fully normalized the hemodynamic alterations. (J Am Coll Cardiol 2005;45:439 – 45) © 2005 by the American College of Cardiology Foundation
The cardiovascular system is one of the principal targets of thyroid hormones (1). The cellular mechanisms by which thyroid hormones act on systolic and diastolic cardiac function are complex and at different levels. Thyroid hor-mones modulate the expression and function of several enzymes and proteins involved in the cardiac performance, such as sarcoplasmic reticulum Ca ATPase (SERCA II), Na/K ATPase, and alpha/beta-myosin heavy chains (2). The effect of altered thyroid function is well demonstrated in clinical practice by the typical cardiovascular alterations observed in patients with either overt hyperthyroidism or hypothyroidism (3–5). However, the cardiac effect of subtle thyroid dysfunction is less clear and documented. Subclin-ical (mild) hypothyroidism (SHT) is a very common disor-der that may represent asymptomatic “mild” thyroid failure in which substitutive treatment with synthetic thyroid hormones is still controversial (6,7). The prevalence of SHT ranges between 2% and 20% of the adult population, and
women are predominantly affected (7–9). Subclinical hypo-thyroidism is characterized by an increased serum thyro-tropin (thyroid-stimulating hormone [TSH]) concentration in the presence of normal values of free thyroxine (FT4) and of biologically active free tri-iodothyronine (FT3) (10). Although thyroid hormones are within the normal range, some cardiovascular effects have been documented in SHT as impaired diastolic relaxation and reduced exercise capa-bility (11,12); both of these alterations are reversible with synthetic thyroid hormone replacement (13,14).
Whether SHT also affects left ventricular (LV) volumes and systolic function at rest remains to be established (7,15). Cardiac magnetic resonance (CMR) is considered the gold standard for evaluating cardiac volumes and function (16). Gradient echo sequences provide a naturally high level of contrast between intracavitary blood and myocardium, thus allowing an accurate and reproducible determination of LV volumes and mass and calculation of SV and ejection fraction. In this context, additional information can also be drawn from application of the more recent CMR tagging analysis, which represents a noninvasive highly accurate method for direct quantification of regional systolic function (17).
From the *Institute of Clinical Physiology, C.N.R., Pisa, Italy; †Johns Hopkins University, Baltimore, Maryland; and ‡Scuola Superiore S. Anna and Institute of Clinical Physiology, C.N.R., Pisa, Italy.
Manuscript received March 2, 2004; revised manuscript received October 1, 2004, accepted October 18, 2004.
The aim of the present study was to assess the cardiac morphology and ventricular systolic function in patients with SHT before and after substitutive treatment with synthetic thyroid hormone.
METHODS
Patients. Fifty female patients were enrolled in the study. Of these, 30 (mean age 41.2 ⫾ 6.9 years) had the first diagnosis of SHT (i.e., 4.00 ⬍ TSH ⬍ 15 IU/ml, confirmed by two different serum determination in one month) in the presence of both FT3 and FT4 in the normal range, due to autoimmune thyroiditis; the remaining 20 (mean age 38.4 ⫾ 9.4 years) with absent thyroid autoanti-bodies, normal thyroid function (i.e., normal FT4, FT3, and TSH), and normal ultrasound thyroid pattern served as controls. All patients were free from any other concomitant disorder and from any treatment for at least three months. All patients and controls underwent thyroid hormone sam-pling and CMR in the same day. In 26 patients with SHT, CMR was repeated after reversal of SHT by synthetic thyroid hormone replacement therapy, as assessed by nor-malization of TSH (obtained values ranging between 0.4 and 2.5 IU/ml). The remaining four patients refused to undergo CMR for a second time (after treatment). The time range from the first to the second CMR was 70 to 138 days (median 86 days).
Thyroid hormones assay. The thyroid function profile was determined by measuring FT4, FT3, and TSH through a fully automated AIA system, as previously reported (18). The reference intervals for our laboratory were: FT3 2.0 to 4.2 pg/ml (3.2 to 6.5 pmol/l), FT4 7.1 to 18.5 pg/ml (9.2 to 24.0 pmol/l), and TSH 0.30 to 3.80IU/ml.
The CMR technique. Cardiac magnetic resonance was
performed on a whole-body magnetic resonance imaging scanner (Signa Cvi, GE), operating at 1.5-T using a surface phased-array coil. The CMR acquisition was performed according to a standardized protocol. Cardiac images were obtained using breath-hold segmented gradient echo FI-ESTA (Fast Imaging Employing Steady State Acquisition) electrocardiographically triggered sequences. The echo time
was 1.7 ms; repetition time 4.0 ms; slice thickness 8 to 10 mm with no interslice gap; field of view from 320 to 380 mm; data matrix size 256⫻ 224; phase of field of view 0.75; trigger delay was minimum; and views per segment 8 to 12 according to heart rate; flip angle 45°. Thirty cine frames were obtained both in four-chamber view and two-chamber views to measure LV dimensions. On the four-chamber view slice, the LV was covered from the base to apex, with a stack of slices in the true short axis. The basal short-axis slice was positioned just forward of the atrioventricular ring, and all subsequent breath-hold slices were acquired toward the apex. The tagging pulse sequence consisted of nonse-lective radiofrequency pulses separated by spatial modula-tion of magnetizamodula-tion-encoding gradients to achieve tag separation of 7 mm (19). Three base-to-apex short-axis sections were prescribed (basal, equatorial, and apical re-gion). Two sets of identical short-axis views were acquired, with the second set rotated by 90°; in this way, we imaged the three slices within three breath-holds (about 20 s each). The number of views per phase was optimized on the basis of the patient’s heart rate.
Cardiac magnetic resonance data analysis. Left ventricle
contours were drawn in end-diastolic and end-systolic short-axis frames using a commercial post-processing pro-gram (Mass Analysis, Leiden, The Netherlands) on an independent Sun-pare Station. Left ventricular end-diastolic volume (EDV) and end-systolic volume (ESV) were measured by manual planimetry and subsequent mul-tiplication with slice thickness. Final LV volumes were calculated by simple addition of the individual slice volumes in the stack of contiguous slices for the entire LV. The indexed volumes of the LV were obtained by dividing EDV and ESV by the body surface area. Left ventricular mass index (g/m2) was calculated by multiplying the difference
between epicardial and endocardial end-diastolic indexed volumes by the density of myocardial tissue (1.05 g/ml). Both EDV and ESV were used to calculate LV indexed stroke volume (SV, ml/m2) and ejection fraction. Cardiac
index (CI, ml/[min·m2]) was obtained as the product of SV
and heart rate. Systemic vascular resistance (SVR, mm Hg·min/l·m2) was calculated as mean arterial blood pressure
divided by cardiac output: the obtained value was indexed by body surface area. The LV was divided into four walls (septum, anterior, lateral, and inferior) and 12 segments, including four basal, equatorial, and apical segments. Dia-stolic wall thickness (DWT) of the 12 LV segments was calculated, and the index of this DWT was obtained by dividing the sum of the individual segment values by the number of the 12 LV segments. Wall motion of the same 12 LV segments was graded semiquantitatively as 1⫽ normal; 2 ⫽ hypokinetic; 3 ⫽ akinetic; and 4 ⫽ dyskinetic. The analysis of tagged cardiac images was performed using Harmonic Phase (HARP) CMR, obtaining a fast and accurate assessment of two-dimensional strain fields (20). Tagged analysis was performed at the same segments of the DWT and wall motion. For each segment, the two-Abbreviations and Acronyms
CI ⫽ cardiac index
CMR⫽ cardiac magnetic resonance DWT⫽ diastolic wall thickness E1 ⫽ greatest systolic lengthening E2 ⫽ greatest systolic shortening EDV ⫽ end-diastolic volume ESV ⫽ end-systolic volume FT3 ⫽ free tri-iodothyronine FT4 ⫽ free thyroxine LV ⫽ left ventricular
SHT ⫽ subclinical hypothyroidism SV ⫽ stroke volume
SVR ⫽ systemic vascular resistance TSH ⫽ thyroid-stimulating hormone
dimensional strain field was assessed by computing the greatest systolic lengthening (E1, %), corresponding to wall thickening, and the greatest systolic shortening (E2, %), which is in the circumferential direction, as well as the angular deviation of E1 from the radial direction. The sensitivity of the HARP method to small changes in myocardial strain and its potential application in clinical cardiology have already been described (21). Operators were blinded as to the patient group during the analysis of the LV parameters.
Statistical analysis. Data are expressed as the mean value⫾
SD. The two-tailed independent samples t test was used to compare the results of the control and SHT groups. The two-tailed paired samples t test was used to compare the SHT group before and after therapy. The strength of correlation between variables was assessed by Pearson coefficient (R). A p value⬍0.05 was considered statistically significant.
RESULTS
Clinical and hormonal characteristics. The demographic,
clinical, and thyroid functional data are reported inTables 1
and 2. There were no significant differences in age, body surface area, diastolic and mean blood pressure, and heart rate between the SHT and control groups. In the 26
subjects reevaluated after treatment, the mean value of TSH was significantly lower and that of FT4 was higher than the corresponding values before therapy. Values of clinical and thyroid functional variables in the 26 treated patients with SHT were not significantly different from those of controls.
Volumes and global function of the LV. Indexed systolic
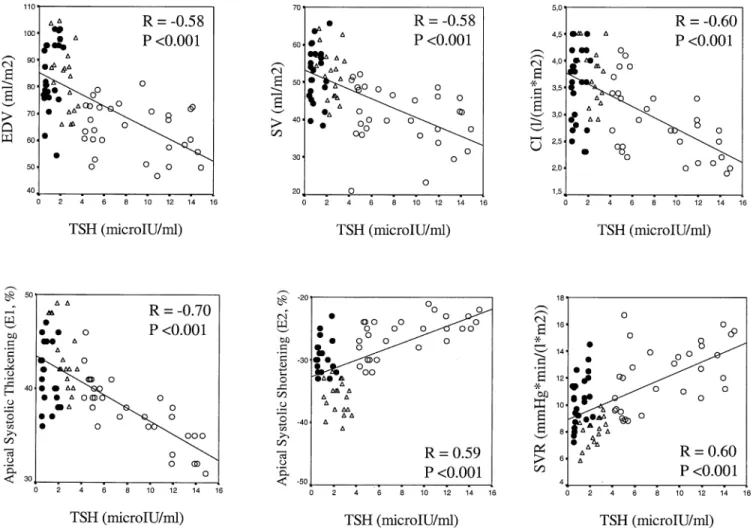
and diastolic volumes, as well as the indexes of global LV function in SHT before therapy and in control group, are reported inTable 3. The SHT group differed for EDV, SV, CI, and SVR, as compared with the control group. Cardiac parameters measured before and after thyroid replacement therapy in the SHT group are reported in Table 4. The EDV, SV, ejection fraction, and CI increased and SVR decreased after treatment. After treatment, no difference was found relative to the control group. By considering all subjects as a whole (control and SHT groups before and after treatment, Fig. 1), there was a significant correlation between TSH values and CI (R⫽ ⫺0.60, p ⬍ 0.001), SVR (R⫽ 0.60, p ⫽ 0.001), SV (R ⫽ ⫺0.58, p ⬍ 0.001), EDV (R⫽ ⫺0.58, p ⬍ 0.001), and ejection fraction (R ⫽ ⫺0.50, p⬍ 0.001).
Regional systolic function of the LV. Wall motion was
normal in all segments of both the control and SHT groups. E1 was significantly higher in normal subjects than in SHT
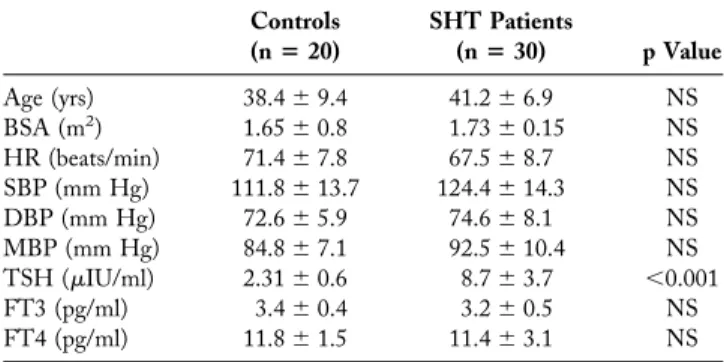
Table 1. Clinical and Thyroid Profile in Control Subjects and Patients With Subclinical Hypothyroidism Before Therapy (All Patients Enrolled)
Controls (nⴝ 20) SHT Patients (nⴝ 30) p Value Age (yrs) 38.4⫾ 9.4 41.2⫾ 6.9 NS BSA (m2) 1.65⫾ 0.8 1.73⫾ 0.15 NS HR (beats/min) 71.4⫾ 7.8 67.5⫾ 8.7 NS SBP (mm Hg) 111.8⫾ 13.7 124.4⫾ 14.3 NS DBP (mm Hg) 72.6⫾ 5.9 74.6⫾ 8.1 NS MBP (mm Hg) 84.8⫾ 7.1 92.5⫾ 10.4 NS TSH (IU/ml) 2.31⫾ 0.6 8.7⫾ 3.7 ⬍0.001 FT3 (pg/ml) 3.4⫾ 0.4 3.2⫾ 0.5 NS FT4 (pg/ml) 11.8⫾ 1.5 11.4⫾ 3.1 NS Data are presented as the mean value⫾ SD.
BSA ⫽ body surface area; DBP ⫽ diastolic blood pressure; FT3 ⫽ free tri-iodothyronine; FT4⫽ free thyroxine; HR ⫽ heart rate; MBP ⫽ mean blood pressure; NS⫽ not significant; SBP ⫽ systolic blood pressure; SHT ⫽ subclinical hypothyroidism.
Table 2. Clinical and Thyroid Profile in Subclinical Hypothyroidism Patients Before and After Therapy
SHT Before Therapy (nⴝ 30) SHT After Therapy (nⴝ 26) p Value HR (beats/min) 66.5⫾ 7.1 67.1⫾ 7.2 NS SBP (mm Hg) 122.6⫾ 16 117.3⫾ 16.1 NS DBP (mm Hg) 75.5⫾ 7.6 73.6⫾ 11.7 NS MBP (mm Hg) 91.8⫾ 9.4 88.1⫾ 12.3 NS TSH (IU/ml) 8.3⫾ 3.5 0.88⫾ 0.5 ⬍0.001 FT3 (pg/ml) 3.2⫾ 0.6 4.3⫾ 0.7 NS FT4 (pg/ml) 11.1⫾ 2.9 18.8⫾ 5.3 ⬍0.01 Data are presented as the mean value⫾ SD.
Abbreviations as inTable 1.
Table 3. Morphologic and Global Functional Parameters of the Left Ventricle in Control Subjects and Subclinical
Hypothyroidism Patients Before Therapy (All Patients Enrolled)
Controls (nⴝ 20) SHT Patients (nⴝ 30) p Value EDV (ml/m2) 81.4⫾ 11.3 64.3⫾ 8.7 ⬍0.001 ESV (ml/m2) 31.5⫾ 8.3 29.1⫾ 5.5 NS SV (ml/m2) 52.5⫾ 6.1 38.9⫾ 7.5 ⬍0.001 CI (l/[min·m2]) 3.7⫾ 0.4 2.6⫾ 0.5 ⬍0.001 EF (%) 65⫾ 5.5 61.0⫾ 6.4 NS SVR (mm Hg·min/[l/m2]) 8.6⫾ 1.1 12.5⫾ 2.5 0.003 LVM (r/m2) 81.0⫾ 8.0 84⫾ 16.3 NS DWT (mm) 6.3⫾ 0.4 6.0⫾ 0.6 NS
Data are presented as the mean value⫾ SD.
CI⫽ cardiac index; DWT ⫽ diastolic wall thickness; EDV ⫽ end-diastolic volume; EF⫽ ejection fraction; ESV ⫽ end-systolic volume; LVM ⫽ left ventricular mass; NS⫽ not significant; SHT ⫽ subclinical hypothyroidism; SV ⫽ stroke volume; SVR⫽ systemic vascular resistance.
Table 4. Morphologic and Global Functional Parameters of the Left Ventricle in the Subclinical Hypothyroidism Patients Before and After Therapy
SHT Before Therapy (nⴝ 30) SHT After Therapy* (nⴝ 26) p Value EDV (ml/m2) 64.8⫾ 8.3 78.0⫾ 11.5 ⬍0.001 ESV (ml/m2) 28.9⫾ 6.0 29.0⫾ 6.5 NS SV (ml/m2) 39.1⫾ 6.5 48.7⫾ 8.5 ⬍0.001 CI (l/[min·m2]) 2.6⫾ 0.3 3.2⫾ 0.5 0.002 EF (%) 59.7⫾ 6.4 65.5⫾ 7.0 ⬍0.001 SVR (mm Hg·min/[l/m2]) 12.5⫾ 2.7 9.1⫾ 1.4 ⬍0.001 LVM (g/m2) 73.8⫾ 15.9 75.3⫾ 16.1 NS DWT (mm) 5.9⫾ 0.6 6.0⫾ 0.6 NS
*There are no significant differences between controls and SHT patients after treatment. Data are presented as the mean value⫾ SD.
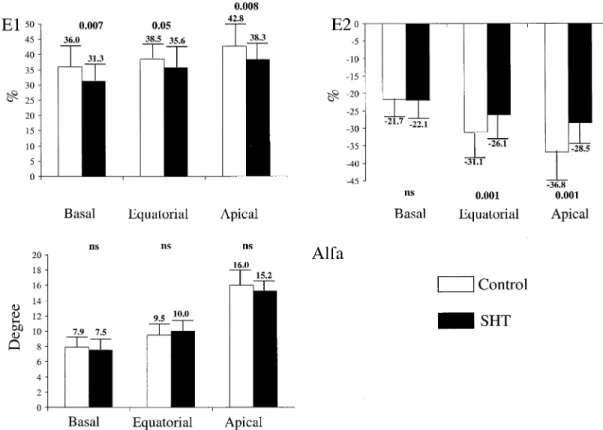
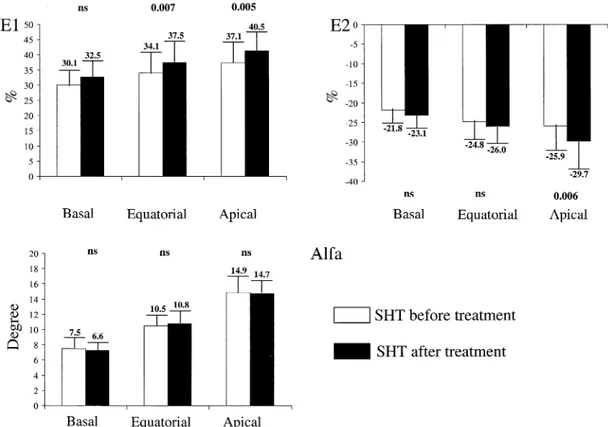
patients in each of the three considered levels; E2 was signif-icantly higher, in absolute value, in normal subjects only at the equatorial and apical levels; the alpha value was not signifi-cantly different in SHT patients as compared with normal subjects in each of the three levels considered (Fig. 2). Con-sidering controls and SHT patients (both before and after treatment) as a whole, there was a significant correlation between TSH values and both E1 (R ⫽ ⫺0.70, p ⬍ 0.001) and E2 (R⫽ 0.59, p ⬍ 0.001) at the apical level (Fig. 1), and E1 only at the equatorial level (R⫽ ⫺0.42, p ⬍ 0.001). When SHT patients were evaluated before and after therapy, a significant increase was observed in E1 at the equatorial and apical levels, and in E2, in absolute value, at the apical level only; the alpha value remained unchanged before and after treatment (Fig. 3).
DISCUSSION
The main finding of the present study is that patients with SHT showed reduced EDV (decreased preload) and in-creased systemic vascular resistance (inin-creased afterload), leading to impairment of cardiac pump performance, as
compared with normal subjects. The result of pump failure was the reduction of SV, as well as cardiac output, because heart rate was unaffected. All hemodynamic alterations reversed to normal after thyroid hormone replacement therapy. Moreover, a relatively good relationship was found between TSH, as the best biochemical marker of whole-body thyroid hypofunction, and the parameters of systolic LV performance. The observed scatter about the line of agreement may be at least in part ascribed to the relatively low sensitivity of TSH as a marker of the severity of hypothyroidism in the peripheral target tissues (22). To our knowledge, this is the first comprehensive study that em-ployed the CMR and tagging CMR techniques to evaluate cardiac morphology and function in patients with mild hypothyroidism; this makes a comparison with previous reports in the same field difficult. Only the CMR study, done in a severe and acute model of hypothyroidism secondary to total thyroidectomy, gave, at least in part, comparable results (23). On the other hand, the few echocardiographic studies performed in SHT (13,24 –26) showing diastolic relaxation impairment and reduced
exer-Figure 1. Scatterplots showing the relationship between thyroid-stimulating hormone (TSH) and end-diastolic volume (EDV), stroke volume (SV), cardiac index (CI), systemic vascular resistance (SVR), and apical greatest systolic lengthening (E1) and apical greatest systolic shortening (E2). Open circles⫽ subclinical hypothyroidism (SHT) patients before thyroid replacement therapy; filled circles⫽ SHT patients after thyroid replacement therapy; open
cise tolerance remain largely inconclusive as far as resting LV systolic function is concerned (7). Apart from possible differences in patient selection, different and somewhat contrasting data might be ascribed to the relatively poor accuracy of the method utilized for the assessment of systolic cardiac function (7). To overcome all of these drawbacks, we enrolled a selected group of patients of relatively young age with SHT, free from previous and/or concomitant additional disease and from medical treatment. The technique we adopted is considered the gold standard for the noninvasive assessment of cardiac performance (i.e., for evaluating both cardiac volumes and indexes of global LV function) (16). The principal advantages of the CMR technique are the high image resolution, allowing accurate definition of the endocardial and epicardial borders, and the three-dimensional approach, allowing direct volume recon-struction of the LV without any geometric assumption (16). Importantly, beside the clearly documented alteration in the global LV volumes and function, a significant difference in regional systolic performance has been shown in patients with SHT by the use of the more sophisticated tagging CMR analysis. The accuracy of this technique in the evaluation of regional intramyocardial contractility is operator-independent and relies on the ability to trace the same portion of the myocardium during the cardiac cycle, making the evaluation of this parameter accurate to the level of sonomicrometers—the invasive gold standard method (27). In this study, the analysis of regional strains allowed
accurate information on the regional nonuniformity of the LV, with numerical values in agreement with previously reported studies in normal adult hearts (20,28,29). We found that wall thickening (E1) and circumferential short-ening (E2) were significantly lower in patients with SHT as compared with controls. Moreover, E1 and E2 differences between normal subjects and SHT patients, as well as between SHT patients before and after hormonal therapy, appeared to be more evident and significant when moving from the base to apex of the ventricle. On the other hand, the angular deviation did not differ in SHT patients and normal subjects; this result is in agreement with the nature of this parameter, sensitive only to dyskinetic motions, and with the typology of subjects enrolled in the study, each with “normal” ventricular function.
The intrinsic mechanisms responsible for reduced LV EDV and for its normalization in SHT after thyroid hormone replacement therapy cannot be fully explained by the present data, per se. It seems very unlikely that the observed LV volume changes before and after therapy were related to blood volume variations, documented only in overt hypothyroidism but not in SHT (30). A hypothetical mechanism might be the redistribution of blood volume with subtraction of circulating blood from the systemic circulation, although the nature of such mechanism remains obscure. Conversely, the increase in systemic vascular resis-tance is in agreement with the known vasodilatory effect of thyroid hormone. The association of reduced preload with
Figure 2. Histograms showing the values of the tagging parameters in the control group and subclinical hypothyroidism (SHT) group before treatment. Alfa⫽ angular deviation of greatest systolic lengthening (E1); E2 ⫽ greatest systolic shortening.
increased afterload, observed in SHT in the present study, is in line with the systemic effect of the thyroid hormone, by which central and peripheral effects act synergistically to improve systolic performance (31–34). Changes in preload and afterload are sufficient reason to explain the decrease in systolic pump performance observed in SHT patients, without the need to invoke simultaneous impairment in myocardial inotropic function. Accordingly, for similar val-ues of ESV, systolic arterial pressure did not differ among patient subgroups and the control group, suggesting a similar degree of contractility. On the basis of this consid-eration, regional changes observed in E1 and E2 might be interpreted as the result of parallel changes in cardiac loading conditions.
Study limitations. The relatively small size of the studied
patient population could represent a potential drawback; however, the relevant cost of CMR limits its routine use. Moreover, the high resolution and reproducibility of the CMR imaging technique optimizes the likelihood of de-tecting the small differences (16) that we observed among untreated and treated SHT and control groups. Notwith-standing the high incidence of SHT (7–9), we enrolled a restricted but highly selected group of patients by including only those with SHT, without any other concomitant disorders, and free from any treatment.
Conclusions. The present study demonstrates that there
are measurable differences in cardiac volumes and systolic performance in patients with SHT; all these alterations
reverse to normal after thyroid hormone replacement ther-apy. Future studies are needed to define the underlying mechanisms and clinical importance of these abnormalities in terms of symptoms, exercise tolerance, and outcome.
Acknowledgment
We thank Mrs. Laura Mazza for her skillful secretarial assistance.
Reprint requests and correspondence: Dr. Alessandro Pingitore, C.N.R. Clinical Physiology Institute, S. Cataldo Research Cam-pus, Via G. Moruzzi 1, 56124, Pisa Italy. E-mail: [email protected].
REFERENCES
1. Polikar R, Burger AG, Scherrer U, et al. The thyroid and the heart. Circulation 1993;87:1435– 41.
2. Klein I, Ojamaa K. Thyroid hormone and the cardiovascular system. N Engl J Med 2001;344:501–9.
3. Feldman T, Borow KM, Sarne DH, et al. Myocardial mechanics in hyperthyroidism: importance of left ventricular loading conditions, heart rate and contractile state. J Am Coll Cardiol 1986;7:967–74. 4. Osman F, Gammage MD, Franklyn JA. Hyperthyroidism and
car-diovascular morbidity and mortality. Thyroid 2002;12:483–7. 5. Klein I, Ojamaa K. The cardiovascular system in hypothyroidism. In:
Braverman LE, Utiger RD, editors. Werner and Ingbar’s The Thy-roid: A Fundamental and Clinical Test. 8th edition. Philadelphia, PA: Lippincott Williams & Wilkins, 2000:777– 82.
6. Biondi B, Palmieri EA, Lombardi G, et al. Subclinical hypothyroidism and cardiac function. Thyroid 2002;12:505–10.
7. Surks MI, Ortiz E, Daniels GH, et al. Subclinical thyroid disease: scientific review and guidelines for diagnosis and management. JAMA 2004;291:228 –38.
Figure 3. Histograms showing the values of the tagging parameters in the subclinical hypothyroidism (SHT) patients before and after treatment. Alfa⫽ angular deviation of greatest systolic lengthening (E1); E2⫽ greatest systolic shortening.
8. Tunbridge WM, Evered DC, Hall R, e. The spectrum of thyroid disease in a community: the Wickham survey. Clin Endocrinol 1997;7:481–93.
9. Vanderpump MP, Tunbridge WM. The epidemiology of thyroid disease. In: Braverman LE, Utiger RD, editors. Werner and Ingbar’s The Thyroid: A Fundamental and Clinical Test, 8th edition. Phila-delphia, PA: Lippincott Williams & Wilkins, 2000:474 – 82. 10. Sturks MI, Ocampo E. Subclinical thyroid disease. Am J Med
1996;100:217–23.
11. Biondi B, Fazio S, Palmieri EA, et al. Left ventricular diastolic dysfunction in patients with subclinical hypothyroidism. J Clin Endo-crinol Metab 1999;84:2064 –7.
12. Brenta G, Mutti LA, Schnitman M, Fretes O, Perrone A, Matute ML. Assessment of left ventricular diastolic function by radionuclide ventriculography at rest and exercise in subclinical hypothyroidism and its response to l-throxine therapy. Am J Cardiol 2003;91:1327–30. 13. Arem K, Rokey R, Kiefe C, et al. Cardiac systolic and diastolic
function at rest and exercise in subclinical hypothyroidism: effect of thyroid hormone therapy. Thyroid 1996;6:397– 402.
14. Monzani F, Di Bello V, Caraccio N, et al. Effect of levothyroxine on cardiac function and structure in subclinical hypothyroidism: a double blind, placebo-controlled study. J Clin Endocrinol Metab 2001;86: 1110 –5.
15. Biondi B, Palmieri EA, Lombardi G, et al. Effects of subclinical thyroid dysfunction on the heart. Ann Intern Med 2002;137:904 –14. 16. Pohost GM, Hung L, Dole M. Clinical use of cardiovascular magnetic
resonance. Circulation 2003;108:647–53.
17. McVeigh ER, Zerhuni EA. Non-invasive measurement of transmural gradients in myocardial strain with MR imaging. Radiology 1991;180: 677– 83.
18. Iervasi G, Pingitore A, Landi P, et al. Low-T3 syndrome: a strong prognostic predictor of death in patients with heart disease. Circula-tion 2003;107:708 –13.
19. Axel L, Dougherty L. MR imaging of motion with spatial modulation of magnetization. Radiology 1989;171:841–5.
20. Osman NF, Prince JL. Angle images for measuring heart motion from tagged MRI. Proc IEEE Conf Image Proc 1998;1:704 – 8. 21. Garot J, Bluemke DA, Osman NF, et al. Fast determination of
regional myocardial strain fields from tagged cardiac images using harmonic phase MRI. Circulation 2000;101:981– 8.
22. Meier C, Trittibach P, Guglielmetti M, Straub JJ, Muller B. Serum thyroid stimulating hormone in assessment of severity of tissue
hypothyroidism in patients with overt primary thyroid failure: cross sectional survey. BMJ 2003;326:311–2.
23. Bengel FM, Nekolla SG, Ibrahim T, et al. Effect of thyroid hormones on cardiac function, geometry and oxidative metabolism assessed noninvasively by positron emission tomography and magnetic reso-nance imaging. J Clin Endocrinol Metab 2000;85:1822–7.
24. Tseng KH, Walfish PG, Peaud JA, et al. Concurrent aortic and mitral valve echocardiography permits measurements of systolic time intervals as an index of peripheral tissue thyroid functional status. J Clin Endocrinol Metab 1989;69:633– 8.
25. Vitale G, Galderisi M, Lupoli GA, et al. Left ventricular myocardial impairment in subclinical hypothyroidism assessed by a new ultra-sound tool: pulsed tissue Doppler. J Clin Endocrinol Metab 2002;87: 4350 –5.
26. Bell GM, Todd WT, Forfar JC, et al. End-organ responses to thyroxine therapy in subclinical hypothyroidism. Clin Endocrinol 1985;22:83–9.
27. Lima JCA, Jeremy R, Guier W, et al. Accurate systolic wall thickening by nuclear magnetic resonance imaging with tissue tagging: correlation with sonomicrometers in normal and ischemic myocardium. J Am Coll Cardiol 1993;21:1741–51.
28. Moore CM, Lugo-Olivieri CH, McVeigh ER, et al. Three-dimensional systolic strain patterns in the normal human left ventricle: characterization with tagged MR imaging. Radiology 2000;2:453– 66. 29. Young AA, Imai H, Chang CN, et al. Two-dimensional left ventricular deformation during systole using magnetic resonance imaging with spatial modulation of magnetization. Circulation 1994;89:740–52.
30. Villabona C, Sahum M, Roca M, et al. Blood volumes and renal function in overt and subclinical primary hypothyroidism. Am J Med Sci 1999;318:277– 80.
31. DiPierro FV, Bavaria JE, Lankford EB, et al. Triiodothyronine optimizes sheep ventriculoarterial coupling for work efficiency. Ann Thorac Surg 1996;62:662–9.
32. Klein I. Thyroid hormone and cardiac contractility. Am J Cardiol 2003;91:1331–2.
33. Diekman MJ, Harms MP, Endert E, et al. Endocrine factors related to changes in total peripheral vascular resistance after treatment of thyrotoxic and hypothyroid patients. Eur J Endocrinol 2001;144:339–46. 34. Faber J, Petersen L, Wiinberg N, Shifter S, Mehlsen J. Hemodynamic
changes after levothyroxine treatment in subclinical hypothyroidism. Thyroid 2004;12:319 –24.