Inland Waters (2015) 5, pp. DOI: 10.5268/IW-5.4.868
Article
Long-term ecological studies on phytoplankton in Mediterranean
reservoirs: a case study from Sardinia (Italy)
Maria Antonietta Mariani,1* Giuseppina Grazia Lai,1 Bachisio Mario Padedda,1 Silvia Pulina,2 Nicola Sechi,1
Tomasa Virdis,3 and Antonella Lugliè1
1 University of Sassari, Dipartimento di Architettura, Design e Urbanistica, Sassari, Italy 2 University of Cagliari, Dipartimento di Scienze della Vita e dell’Ambiente, Cagliari, Italy 3 Ente Acque della Sardegna, Servizio Qualità Acqua Erogata, Cagliari, Italy
* Corresponding author: [email protected]
Received 24 April 2015; accepted 24 June 2015; published DD Month 2015
Abstract
Artificial lakes are strategic water resources in the Mediterranean region but are one of the most vulnerable areas to the impacts of climate change, particularly to the expected significant decrease in water resources; therefore, enhancing the ability of water management to improve water quality is crucial. This study contributes to the knowledge of the long-term ecological features of Mediterranean artificial lakes based on a case study of Bidighinzu Lake in Sardinia, Italy, a warm, monomitic and hypereutrophic reservoir mainly used for drinking water. Among the different restoration actions carried out in Bidighinzu Lake to improve water quality is the reduction of nutrient loads from the watershed. To study multiannual trends of the trophic state, a long-term series (1988–2012) of both environmental variables and phytoplankton was analysed. Mann-Kendall tests revealed increasing trends for total nitrogen to total phosphorus ratios (TN:TP; significant in spring, summer, and winter) and decreasing trends for ammonium (winter and autumn), TP (all seasons), orthophosphate (spring, summer, and winter), reactive silica (autumn), and pH (summer). Among phyto-plankton, significant increasing trends were assessed in biomass of Bacillariophyceae, Chlorophyceae, Dinophyceae, and Chrysophyceae. Cyanobacteria did not show a clear trend, although at the order level, Chroococcales significantly increased in summer and decreased in winter. Despite these major tendencies, the lake did not show significant improvement in its eutrophic state, probably due to an inherent resistance and the insufficient and/or not well calibrated or applied recovery actions.
Key words: drinking use, long-term ecological research, Mediterranean reservoir, Sardinia, trophic status
Introduction
The Water Framework Directive (WFD; 2000/60/CE) includes phytoplankton among the biological components used to assess the ecological status of lacustrine ecosystems due to its sensitivity and dynamic responses to environmental changes (Thackeray et al. 2013). Any mod-ification in phytoplankton community structure and/or dynamics (i.e., phenology, structure, and species composition) may trigger changes in ecosystem functioning (Suikkanen et al. 2007, Guinder et al. 2010, Salmaso et al. 2012). Moreover, changes in phytoplankton
composition and abundance can significantly impact different ecosystem functions and, consequently, the related goods and services, such as high quality water for drinking or irrigation and recreational uses of waterbodies (Salmaso et al. 2012).
The WFD identifies eutrophication, acidification, toxic pollution, and hydromorphological alteration as the most important human pressures affecting lake ecosystems in Europe (Marchetto et al. 2009). According to the main objective of the WFD, actions must be implemented to improve the environmental quality of aquatic ecosystems. Restoration actions require a thorough knowledge of the
DOI: 10.5268/IW-5.4.868 © International Society of Limnology 2015
ecosystems, strategies must be tailored to specific cases, and reliable models of the ecosystem’s responses must be adopted (Scheffer et al. 2000). Long-term ecological studies are valuable for understanding community changes in relation to different stressors (Salmaso et al. 2012) and distinguishing regular and recurrent patterns from occasional and exceptional events (D’Alcalà et al. 2004). The ranges and scales of natural variability are difficult to determine, however, because phytoplankton does not respond linearly to environmental changes (Barbosa et al. 2010).
In Mediterranean artificial lakes, phytoplankton is the main primary producer (Naselli-Flores 2003). Long-term studies on Mediterranean lakes have highlighted the effects of the strong climatic seasonality of both rainfall regime and operational procedures on the structure and composition of phytoplankton communities (Naselli-Flo-res 2003, Cook et al. 2004, Carrasco et al. 2006, Mous-taka-Gouni et al. 2007, Barone et al. 2010). In particular, Mediterranean artificial lakes are subject to considerable water level fluctuations, with an abrupt increase during the wet season and a strong decrease during drought periods, further emphasized by an intensification of land use activities (Barone et al. 2010). The water level decrease can be accompanied by a break in the thermal stratifica-tion in summer, with rapid changes in nutrient availability (Naselli-Flores 2003).
The general aim of this study was to contribute to the knowledge of the long-term ecological features of Medi-terranean artificial lakes, strategic water resources in a region identified as one of the most vulnerable to the impacts of climate change (Giorgi 2006, García-Ruiz et al. 2011, EEA 2012). In particular, the expected significant decrease in water resources requires the ability of water management to improve water quality as well as comply with the WFD requests.
We considered the study case of a Mediterranean eutrophic reservoir (Bidighinzu Lake, Sardinia, Italy), which has been previously subjected to actions for reducing the trophic status and improving water quality by the diversion of civil and industrial wastewater downstream of the dam (Marchetti et al. 1992). A comparison among data collected from just before to about 10 years after the wastewater diversion did not show improvement in the trophic status (Lugliè et al. 2001). Considering a longer period (1988–2012), the specific objectives of this study were (1) to assess significant multiannual trends both in environmental variables and phytoplankton in Bidighinzu Lake at the seasonal scale, (2) to investigate if the phytoplankton reflects multiannual changes in environmental conditions, and (3) to verify if the observed tendencies were related to the wastewater diversion carried out over
time. Based on Jeppesen et al. (2005), we hypothesized that the wastewater diversion over 24 years would improve the trophic status by reducing nutrients in the lake (especially phosphorus) and the phytoplankton growth (reduction of chlorophyll a, biomass, and cell density), accompanied by a sensible modification in the phytoplankton species composition, particularly in cy-anobacteria abundance.
Study site
In Sardinia, the second largest Mediterranean island, about 90% of the drinking water derives from ~40 artificial lakes (Marchetti et al. 1992, Sechi and Lugliè 1992). Data collected on a multidecadal scale have shown that these lakes are largely eutrophic (Marchetti et al. 1992, Sechi and Lugliè 1992, 1996, Marchetto et al. 2009) and dominated by cyanobacteria (Sechi and Lugliè 1996, Messineo et al. 2009). Since the late 1980s, the management of Sardinian artificial lakes has been oriented toward a multiannual approach to address prolonged droughts and to limit, as much as possible, water level fluctuation and its adverse ecological consequences (Sechi and Lugliè 1992, Naselli-Flores and Lugliè 2014). The water management strategy carried out by the Regional Agency Ente Acque della Sardegna (ENAS) aims to store water from the wet to the dry season at intrannual and interannual scales and to move waters from one basin to another for different needs (Ente Acque della Sardegna 2015, Sardegna Ambiente 2015, Servizio Idrografico di Cagliari 2015).
Bidighinzu Lake (Fig. 1), built in 1956, is one of the artificial lakes managed by ENAS, located in northwest-ern Sardinia at an altitude of 334 m a.s.l. Its watershed has
a surface area of 52 × 106 m2 with a geological substrate
consisting of basalt, limestone, and shale. Bidighinzu
Lake covers a surface area of 1.7 × 10⁶ m2 and has a
theoretical maximum volume of 12.2 × 10⁶ m3 and a mean
depth of 7.3 m. According to ECOSTAT (2003, 2004), Bidighinzu Lake belongs to the LM7 category (altitudes <800 m a.s.l., mean depths >15 m, conductivity <2.5 mS
cm−1). The supplies of water from the catchment to the
lake are insufficient to make up for the losses and human demands (Lugliè and Sechi 1993). Consequently, the lake receives additional water from Temo Lake and Rio Mannu-Su Tulis river lock, localized in different watersheds (Fig. 1). The entity of transferred water changes in relation to the hydrological annual dynamic and to usage requests.
Since 2006, Bidghinzu Lake has served as a research station for the “10 Lake Ecosystems of Sardinia” (www. lteritalia.it) as part of the Long Term Ecological Research-Italy network (LTER-Research-Italy).
Methods
Sampling
The first data collected for temperature, ammonium
(NH4), nitrate (NO3), total phosphorus (TP),
orthophos-phate, reactive silica (Si), chlorophyll a (Chl-a), and phy-toplankton species composition were recorded in 2 seasonal samplings, February 1978 and August 1979. Subsequent samples were collected monthly from March 1988 to July 2012 at a single station close to the deepest part of the reservoir (Fig. 1). Samplings were not always continuous, becoming more regular in the last 7 years. Samples were collected at fixed depths using a Niskin bottle along the vertical profile from the surface at depths of 1, 2.5, 5, 7.5, 10, 15, and 20 m and at about 1 m from the lake bottom.
Chemical–physical variables
In situ temperature was measured along the vertical profile with a thermistor until 1988–1989 (Lugliè and Sechi 1993); subsequently, temperature, pH, conductivity, and dissolved oxygen (DO) were measured with a multiparametric probe (model Hydrolab datasonde 5). Water transparency was
measured using a Secchi disk. In the laboratory, pH, con-ductivity, and DO data recorded in the field were verified with bench instruments or other analytical approaches (Orion Research Model 960, Winkler’s method, and Analytical Control Mod 120, respectively), and alkalinity was analyzed (APAT–IRSA/CNR 2003).
Nutrients
Water samples were stored in cold and dark conditions
before laboratory analysis of NH4 (Fresenius et al. 1988),
nitrite (NO2), NO3, total nitrogen (TN), orthophosphate,
TP, and reactive Si according to Strickland and Parsons (1972). Dissolved inorganic nitrogen (DIN) was calculated
as the sum of NH4, NO2, and NO3.
Phytoplankton and chlorophyll a
In the field, phytoplankton samples (100 mL) collected from the surface and at depths of 1, 2.5, 5, 7.5, and 10 m were fixed using Lugol’s solution and analyzed in the laboratory according to Utermöhl’s technique (1958). Cell density was determined from subsamples (5–10 mL) of fixed samples (100 mL) using an inverted microscope (Zeiss, Axiovert 25) at 200× and 400× magnification, based on counts of cells from at least 10% of the total bottom area of the settling chamber. The species present were identified from live and fixed samples according to the taxonomic guides in Marchetto et al. (2009), Komárek and Komárková (2002), Komárek and Zapomělová (2007, 2008), and Suda et al. (2002).
Taxon biovolume was determined by multiplying the cell density of each taxon by the cell volume obtained by geometrical approximations from measurement of, when possible, at least 30 specimens for each sampling, following the method of Sun and Liu (2003). The biovolume was
converted to biomass based on the assumption that 1 mm3
= 1 mg of fresh-weight biomass (Liu et al. 2011).
Water samples for Chl-a were collected along the entire vertical profile, from the surface at depths of 1, 2.5, 5, 7.5, 10, 15, and 20 m and at about 1 m from the lake bottom. They were stored in cold and dark conditions before the laboratory analysis according to Goltermann et al. (1978).
Data analysis
Data from 1978 to 2012 were analyzed for temperature,
NH4, NO3, TP, orthophosphate, and reactive Si, and data
from 1988 to 2012 were analyzed for the other environ-mental variables and phytoplankton. Environenviron-mental data were averaged for the entire water column whereas phyto-plankton data were averaged for the euphotic zone
(Zeu = 2.5 times the Secchi disk depth; Poikane 2009).
DOI: 10.5268/IW-5.4.868 © International Society of Limnology 2015
The significance of monotonic multiannual trends in pluviometric (1978–2012), chemical-physical, hydrologic (reservoir volume: 1995–2012; water volumes received from the Temo Lake and from Rio Mannu-Su Tulis river lock: 2006–2012; days of stratification: 1988–2011), nutrients, and phytoplankton data were verified using the nonparametric Mann-Kendall test. The Mann-Kendall procedure does not require that data conform to any particular distribution, and missing values are allowed (Gilbert 1987), as in our nonnormally distributed data. The analysis was performed separately for each season (winter: Jan–Mar; spring: Apr–Jun; summer: Jul–Sep; autumn: Oct–Dec) to investigate in-depth the seasonal dynamics of the considered variables. Loess curves (span = 0.40) were fitted to the data to visually assess the significant multiannual trends.
Detrended correspondence analysis of phytoplankton data (Chl-a; total phytoplankton biomass [TBio]; total phytoplankton density [TDen]; classes Cyanophyceae, Bacillariophyceae, Chlorophyceae, Dinophyceae, Chryso-phyceae, ConjugatoChryso-phyceae, and Cryptophyceae; and orders Chroococcales, Oscillatoriales, and Nostocales) suggested that the redundancy analysis (RDA) ordination method was appropriate (linear distribution; gradient length <2) to assess relationships among phytoplankton and environmental variables (temperature, pH,
conductiv-ity, alkalinconductiv-ity, DO, NH4, NO3, NO2, TN, orthophosphate,
TP, reactive Si, DIN, TN:TP, and Zmix/Zeu, where Zmix is the
circulation depth). Before analysis, phytoplankton data
were log10(x+1) transformed to stabilize variance and
reduce the influence of dominant taxa on the ordination. The significance of environmental variables in explaining the variance of phytoplankton in the RDA was tested using Monte Carlo simulations with 999 permutations (Ter Braak and Šmilauer 1998).
To verify possible relationships between the observed tendencies and the wastewater diversion carried out since 1987 downstream of the dam, TN, TP, Chl-a, TDen, and TBio data were considered and grouped into 3 time intervals: just after diversion (JAD, 1988–1989; i.e., about 1 year after); mid-diversion (MAD, 1994–1997, i.e. 7–10 years after); and long after diversion (LAD, 2003–2012; i.e., 16–22 years after). Based on the available data, a subset of data for each group (at least 10 months in succession) was considered as representative of the corre-spondent group: March 1988 to April 1989 for JAD; December 1996 to November 1997 for MAD; and June 2010 to May 2011 for LAD.
The Vollenweider probabilistic model was used (OECD 1982) to evaluate the trophic status of the Bidighinzu Lake during the 3 periods. Provini et al. (1979) conversion coefficients were used to calculate the relative theoretical P and N loads on the basis of different census
statistics. Differences among the 3 periods for the variables were assessed using repeated measures of analysis of variance (rANOVA). All data were logarithmi-cally [ln(x)] transformed to comply with the assumptions of ANOVA: normal distribution (Shapiro-Wilk test) and homogeneity of variance (Levene’s test). When a significant difference for the considered variables was observed, a Tukey’s pairwise comparison test was also performed. Tests were considered significant when P < 0.05. To assess differences between periods on phyto-plankton assemblage, a one-way analysis of similarities test (ANOSIM) was performed (probability percentages <3% were considered significant).
Similarity matrixes were obtained using mean annual biomass of species. The dataset was composed of 62 species with mean annual biomass >1% of the correspon-dent TBio, and similarity matrixes were based on the Bray-Curtis similarity index. Species mostly contributing to differences between periods were assessed by mean of the SIMPER analysis, applying the cutoff level of contribution at 70%. Tests were considered significant when P < 0.05.
All the statistical analyses were performed using software R v3.1.1 (R Core Team 2012), except ANOSIM and SIMPER, which were performed using PRIMER 6 (Clarke and Warwick 1994).
Results
Phytoplankton composition and long-term trends
TBio, TDen, and Chl-a showed maxima over the years mostly in summer and autumn months (Supplementary Fig. A1, available in supporting information Appendix A). Cyanobacteria dominated TDen (Supplementary Fig. A2), whereas Bacillariophyceae, Chlorophyceae, Dinophyceae, and Cyanobacteria were the most important classes for TBio over time (Supplementary Fig. A3). Bacillariophy-ceae, mainly Centrales with species of the genus Cyclotella, increased progressively in the dry season (Apr–Nov 2007). Chlorophyceae were particularly abundant in May 1988, March 1989, and June 1994 (about 100% of TBio), and in summer months in more recent years (50–70% of TBio). Chlorococcales were the most important order of Chlorophyceae, with species of the genera Oocystis and Sphaerocystis. Dinophyceae achieved peaks of about 100% of TBio in August 1978 (Ceratium hirundinella [O.F.Müller] Dujardin), September 1994 (C. hirundinella), and March 2012 (Peridinium sp.). In the multiannual period, the order composition of Cyanobacte-ria biomass indicated a prevalence of Chroococcales and Nostocales over Oscillatoriales (Supplementary Fig. A4). In more recent years (summer 2011 and 2012), a major presence of Nostocales (genus Aphanizomenon) was
observed. Chroococcales with species of the genus Microcystis prevailed in the early years, mostly in summer, while species of the genus Cyanocatena prevailed more recently (from summer 2003).
The Mann-Kendall test performed on phytoplankton data indicated significant increasing trends for different classes in summer (Bacillariophyceae, Chlorophyceae, and Chrysophyceae; Table 1, Fig. 2), spring (Chrysophy-ceae and Cryptophy(Chrysophy-ceae), and winter (Chrysophy(Chrysophy-ceae and Dinophyceae). The one significant decreasing trend was assessed for Bacillariophyceae biomass in winter (Table 1, Fig. 2). The test did not highlight significant multiannual trends for Cyanobacteria, although at the order level, Chroococcales increased in winter for both cell density and biomass and decreased in summer for biomass, and Nostocales decreased in spring for cell density.
According to rANOVA results, TDen, TBio, and Chl-a were not significantly different among the 3 periods JAD, LAD, and MAD. Considering the selected dataset of phy-toplankton species, the ANOSIM test showed significant differences among the periods (Global R = 0.583; P = 0.001). On the basis of the pairwise comparison among periods, differences were significant between JAD and LAD (R = 0.707; P = 0.022) and between MAD and LAD (R = 0.462; P = 0.012), whereas JAD and MAD results were not significant (R = 0.667; P = 0.100). SIMPER indicated that species mainly responsible for the differences in the 3 periods were Aphanizomenon flos-aquae (L.) Ralfs ex Bornet & Flahault between JAD and MAD (21.14%) and JAD and LAD (23.98%), and Ceratium hirundinella (21.68%) between MAD and LAD. In suborders, other species most contributing (>10% of differences) were C. hirundinella (19.26%) and Cyclotella spp. (14.4%) between JAD and MAD, and Cyclotella spp. (15.23%) and Cryptomonas sp. (13.18%) between MAD and LAD.
Environmental factors and long-term trends
Environmental variables at Bidighinzu Lake (Table 2) from 1988 to 2012 applied to the Mann-Kendall test showed a significant multiannual decreasing trend for pH in summer (Table 1, Fig. 3). Significant decreasing trends were also observed for TP in all the seasons; for
orthophos-phate in spring, summer, and winter; for NH4 in winter and
autumn; and for reactive Si in autumn (Table 1, Fig. 3). In comparison, the test indicated a significant multiannual increasing trend for TN:TP in spring, summer, and winter (Table 1, Fig. 3). Temperature did not show a significant trend, although the thermal stratification periods were longer over the years, lasting from spring–late summer to spring–late autumn (Table 1, Supplementary Fig. A5).
The Mann-Kendall test indicated a significant multiannual increasing trend only for Bidighinzu Lake
volume (S = 247; P < 0.05) in winter and decreasing for water volumes received from Temo Lake (S = −45; P < 0.05) to Bidighinzu Lake in summer.
According to rANOVA only TP concentrations were significantly different among the 3 periods (F = 10.88; P = 0.0008). Specifically, considering Tukey’s pairwise comparisons, TP was significantly different between JAD and LAD (P < 0.001) and between MAD and LAD (P < 0.05).
The trophic status of Bidighinzu Lake was mostly eutrophic and hypereutrophic (>75%) during the 3 periods (Table 3, Fig. 4). The theoretical P loads varied in the 3
periods, passing from 6.3 t P y−1 in 1986 (Sechi 1986), to
11.8 t P y−1 in 2001 (Lugliè et al. 2001), to 4.1 t P y−1 in
2013. The main P contribution was from industrial and urban wastes for all the periods, with a sensible reduction
of industrial wastes from 2001 (9 t P y−1, 76% of the total
P load) to 2013 (0.2 t P y−1, 5% of the total P load).
Relationships between phytoplankton and environmental variables
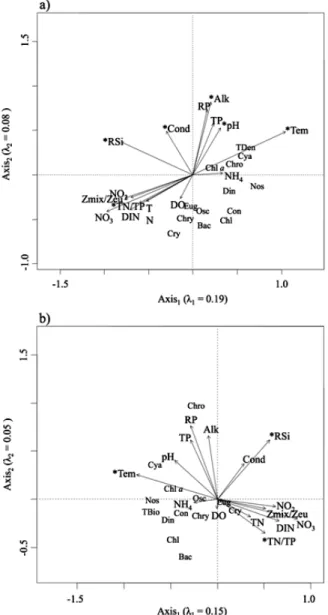
In the RDA, all environmental variables accounted for 37.4% and 29.2% of the variation in phytoplankton cell density and biomass, respectively. Biplots were used to display 27.5% (axis 1: 19.1%; axis 2: 8.4%) and 20.7% (axis 1: 15.2%; axis 2: 5.5%) of the total variance in cell density and biomass data, respectively (Fig. 5).
Considering cell density data, temperature (F = 13.67, P = 0.001), conductivity (F = 3.20, P = 0.004), and reactive Si (F = 3.84, P = 0.003) were the most significant abiotic variables explaining variability in the phytoplank-ton according to the RDA (Fig. 5A). In addition, the effects of TN:TP (F = 2.79, P = 0.011), pH (F = 2.26, P = 0.035), and alkalinity (F = 2.32, P = 0.045) were significant. Considering biomass data, the RDA analysis yielded temperature (F = 8.05, P = 0.001) as the most significant environmental variable that explained the variability in the phytoplankton abundance, followed by TN:TP (F = 2.69, P = 0.017) and reactive Si (F = 2.04, P = 0.045), which were also significant (Fig. 5B).
The environmental variables with the highest values in the same season grouped on the same side of the first axis (Fig. 5). Chl-a, TDen, TBio, and most of the phyto-plankton classes were closer to environmental variables with summer–autumn maxima (i.e., temperature, pH, TP,
orthophosphate, and NH4; Fig. 5). In the relative RDA,
TDen, Chl-a, Cyanobacteria, and Chroococcales were close to each other, and TBio was close to Nostocales, Dinophyceae, Chlorophyceae, and Bacillariophyceae. Cyanobacteria were positively related to temperature and pH, whereas they were negatively related to TN:TP ratio, considering both cell density and biomass RDA (Fig. 5).
DOI: 10.5268/IW-5.4.868 © International Society of Limnology 2015
Supplementary material
Supplementary figures A1-A4.
Fig. A1. Significant trends in phytoplankton classes abundance (triangle = density; circle =
biomass) in the Bidighinzu Lake. Loess curve = solid line; 95 % confidence interval = dashed lines.
Fig. 2. Significant trends in phytoplankton classes abundance (triangle = density; circle = biomass) in the Bidighinzu Lake. Loess curve = solid line; 95% confidence interval = dashed lines.
Winter Spring Summer Autumn S P n S P n S P n S P n pH 26 0.256 16 4 0.916 19 −97 0.023 25 −4 0.900 17 Alkalinity −65 0.004 16 −55 0.059 19 −136 0.002 25 −64 0.009 17 Conductivity −11 0.652 16 −82 0.004 19 −177 <0.001 25 −77 0.002 17 NH4 −76 <0.001 17 −43 0.142 19 14 0.761 26 −58 0.019 17 TP −48 0.034 17 −67 0.021 19 −156 <0.001 26 −50 0.043 17 Orthophosphate −70 0.002 17 −75 0.010 19 −172 <0.001 26 −44 0.076 17 TN:TP ratio 68 0.002 16 59 0.042 19 153 <0.001 25 34 0.174 17 Reactive Si −22 0.344 17 −16 0.599 19 −21 0.640 26 −50 0.043 17 DBac −48 0.034 16 5 0.904 19 113 0.009 25 38 0.127 17 BBac −10 0.685 16 37 0.208 19 113 0.009 25 36 0.149 17 BChl −2 0.964 16 3 0.944 19 99 0.022 25 16 0.537 17 DChry 63 0.004 16 85 0.007 19 113 0.007 25 47 0.054 17 BChry 47 0.026 16 71 0.004 19 149 <0.001 25 41 0.090 17 DCry 26 0.260 16 111 <0.001 19 75 0.083 25 10 0.711 17 DDin 40 0.020 16 33 0.192 19 52 0.228 25 −12 0.622 17 BDin 42 0.014 16 42 0.062 19 54 0.214 25 −6 0.823 17 DChro 44 0.049 16 17 0.155 19 7 0.754 25 78 0.072 17 BChro 44 0.042 16 −6 0.861 19 −85 0.049 25 −8 0.773 17 DNos 7 0.754 16 −74 0.027 19 78 0.072 25 17 0.499 17
Table 1. Results of the Mann-Kendall test for detection of multiannual trends (1978–2012) of the significant environmental variables and phy-toplankton abundance (density and biomass) data from Bidighinzu Lake (S = Kendall score, P = significance, n = number of observations). For the months used for each season see text. Significant trends are marked in bold. D = density and B = biomass. Bac = Bacillariophyceae; Chl = Chlorophyceae; Chry = Chrysophyceae; Cry = Cryptophyceae; Din = Dinophyceae; Chro = Chroococcales; Nos = Nostocales.
Fig. 3. Significant trends in environmental variables in the Bidighinzu Lake. Loess curve = solid line; 95% confidence interval = dashed lines; span = 0.40.
DOI: 10.5268/IW-5.4.868 © International Society of Limnology 2015
and summer. In the Bidighinzu Lake watershed, a general decreasing trend was observed for annual mean rainfall values (pluviometric data), especially in winter and autumn. That decrement has not resulted in a similar tendency in the annual water volume retained in Bidighinzu Lake during 1995–2012, despite no significant increasing trends in the water volumes transferred from the Temo Lake and Rio Mannu-Su Tulis river lock, because of the lake management. Further, along the
Discussion
Based on multiannual trends, Bidighinzu Lake has shown some interesting tendencies, especially in summer, the season with the most numerous and significant trends (Table 1). The Mediterranean climate is characterized by mild wet winters and warm-to-hot dry summers, whereas spring and autumn are more variable (Lionello et al. 2006). Significant negative precipitation trends and significant warming trends have been assessed at different spatial and temporal scales in the Mediterranean region (Giorgi 2002, Brunetti et al. 2004), with a high subregional variability (García-Ruiz et al. 2011, Lionello 2012). These trends agree with predictions of most climate models (García-Ruiz et al. 2011), with stronger variation in winter Fig. 4. Boxplots of (a) TP, (b) TN, (c) Chl-a, (d) TBio, and (e) TDen in the Bidighinzu Lake. Box plots were constructed considering total dataset (all samplings) of averaged values along vertical profile for TP and TN; weighted average in the photic zone for Chl-a, TBio, and TDen. Line inside box represents the median; cross inside box represents mean; points represent maxima and minima. Bottom of box is the first quartile; upper part is the third quartile. Whiskers
represent limits over which values were considered anomalous. Fig. 5. Correlation plots of the RDA on the relationship among envi-ronmental (vectors, in black) and phytoplankton abundance: (a) density; and (b) biomass. Asterisks indicate statistical significance (P < 0.05) of environmental variables. Bac = Bacillariophyceae; Chl = Chlorophyceae; Chro = Chroococcales; Chry = Chrysophyceae;
Con = Conjugatophyceae; Cry = Cryptophyceae; Cya = Cyanophy-ceae; Din = Dinophyceae; Eug = Euglenophyceae; Nos = Nostocales; Osc = Oscillatoriales.
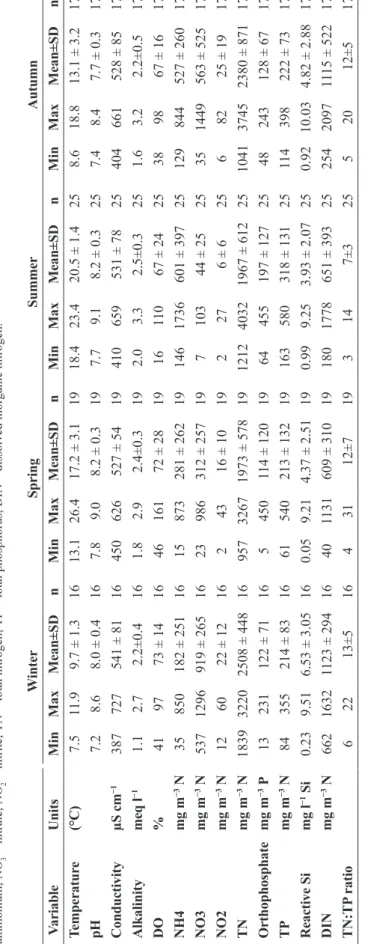
W inter Spring Summer Autumn V ariable Units Min Max Mean±SD n Min Max Mean±SD n Min Max Mean±SD n Min Max Mean±SD n Temperatur e (°C) 7.5 11.9 9.7 ± 1.3 16 13.1 26.4 17.2 ± 3.1 19 18.4 23.4 20.5 ± 1.4 25 8.6 18.8 13.1 ± 3.2 17 pH 7.2 8.6 8.0 ± 0.4 16 7.8 9.0 8.2 ± 0.3 19 7.7 9.1 8.2 ± 0.3 25 7.4 8.4 7.7 ± 0.3 17 Conductivity µS cm −1 387 727 541 ± 81 16 450 626 527 ± 54 19 410 659 531 ± 78 25 404 661 528 ± 85 17 Alkalinity meq l −1 1.1 2.7 2.2±0.4 16 1.8 2.9 2.4±0.3 19 2.0 3.3 2.5±0.3 25 1.6 3.2 2.2±0.5 17 DO % 41 97 73 ± 14 16 46 161 72 ± 28 19 16 11 0 67 ± 24 25 38 98 67 ± 16 17 NH4 mg m −3 N 35 850 182 ± 251 16 15 873 281 ± 262 19 146 1736 601 ± 397 25 129 844 527 ± 260 17 NO3 mg m −3 N 537 1296 919 ± 265 16 23 986 312 ± 257 19 7 103 44 ± 25 25 35 1449 563 ± 525 17 NO2 mg m −3 N 12 60 22 ± 12 16 2 43 16 ± 10 19 2 27 6 ± 6 25 6 82 25 ± 19 17 TN mg m −3 N 1839 3220 2508 ± 448 16 957 3267 1973 ± 578 19 1212 4032 1967 ± 612 25 1041 3745 2380 ± 871 17 O rthophosphate mg m −3 P 13 231 122 ± 71 16 5 450 114 ± 120 19 64 455 197 ± 127 25 48 243 128 ± 67 17 TP mg m −3 N 84 355 214 ± 83 16 61 540 213 ± 132 19 163 580 318 ± 131 25 11 4 398 222 ± 73 17 Reactive Si mg l −1 Si 0.23 9.51 6.53 ± 3.05 16 0.05 9.21 4.37 ± 2.51 19 0.99 9.25 3.93 ± 2.07 25 0.92 10.03 4.82 ± 2.88 17 DIN mg m −3 N 662 1632 1123 ± 294 16 40 1131 609 ± 310 19 180 1778 651 ± 393 25 254 2097 11 15 ± 522 17 TN:TP ratio 6 22 13±5 16 4 31 12±7 19 3 14 7±3 25 5 20 12±5 17 Table 2. Minimum, maximum, mean values, standard deviations, and number of observations of abiotic variables at Bidighinzu Lake, from 1988 to 2012. DO = dissolved oxygen; NH 4 = ammonium; NO 3 = nitrate; NO 2
DOI: 10.5268/IW-5.4.868 © International Society of Limnology 2015
considered period, different land uses may have signifi-cantly influenced runoff and erosion (Vacca et al. 2000). Nevertheless, Bidighinzu Lake has shown large water level fluctuations both at the seasonal (intrannual variation) and the multiannual scales (interannual variation). These factors, climate change, water management, and modification of anthropogenic activities in the watershed, may have overridden the variation linked to the wastewater diversion and cannot be neglected.
Assessing significant multiannual trends in environmental variables in Bidighinzu Lake
Among nutrients, orthophosphate and TP decreased sig-nificantly and, unexpectedly, more strongly in summer,
whereas NH4 and reactive Si showed significant
decreasing trends in autumn and winter and in autumn, respectively. Concentrations of nutrients significantly vary in Mediterranean lakes in relation to the hydrologic cycle and water level fluctuations (Marchetti et al. 1992, Beklioglu et al. 2007, Zohary and Ostrovsky 2011). The main input of nutrients derives from watershed runoff during the wet periods (Edwards and Withers 2008, Greene et al. 2011), even when high nutrient concentra-tions are assessed in the lakes in summer during the low water level phase (Geraldes and Boavida 2005). Prolonged drought periods decrease water level and increase water residence time, prolonging contact of water with the sediment, which favors internal nutrient release, especially of P (Romo et al. 2005, Beklioglu et al. 2007). Anoxic/ hypoxic conditions further exacerbate nutrient release (de Senerpont Domis et al. 2013). Moreover, in
Mediterra-nean lakes, thermal stratification favors nutrient accumu-lation in deeper waters in summer, determining their una-vailability along the water column (Foley et al. 2012). Breaking summer thermal stratification can change the availability of nutrients (Naselli-Flores 2003), favoring phytoplankton growth (Naselli-Flores and Barone 2005, Caputo et al. 2008). Bidighinzu Lake showed a similar behaviour in summer 1988 due to the input of air into the hypolimnion by an aeration system to reduce hypolim-netic anoxia (Lugliè and Sechi 1993), stimulating intense cyanobacteria blooms.
The normal behaviour of Bidighinzu Lake has been that of a warm monomitic lake, with a permanent thermal stratification in summer (Lugliè et al. 2001). The water volume transferred from Temo Lake and Rio Mannu-Su Tulis river lock, which is lower in P than Bidighinzu Lake (Pulina et al. 2014), has guaranteed sufficient water during summer for different uses, maintaining the Bidighinzu Lake stratification. A long-term decreasing trend of P was also assessed in Temo Lake (Pulina et al. 2014), although less intense than in Bidighinzu Lake. The decrement in Temo Lake occurred in absence of specific recovery actions and was attributed to the lake ageing and a decrease in human population and activities in the watershed (Pulina et al. 2014). A significant trend toward lower orthophosphate concentrations was assessed also in Lake Arancio, Sicily, in recent years (Naselli-Flores 2014), contrary to other Sicilian artificial lakes undergoing increased eutrophication processes due to the lack of urban waste treatment plants and to intensive agriculture (Naselli-Flores 2003). Jeppesen et al. (2005) reported a long-term decrease of P in a large series of lakes subject to
TP Chl-a mean Chl-a max Trophic categories
(mg m−3 P) probability (%) (mg m−3) probability (%) (mg m−3) probability (%)
JAD 399 0 33.1 0 134.3 0 oligotrophy 0 2 0 mesotrophy 13 36 0 eutrophy 87 62 100 hypereutrophy MAD 303 0 14.2 1 65.6 0 oligotrophy 0 22 6 mesotrophy 16 63 56 eutrophy 84 14 38 hypereutrophy LAD 177 0 34.3 0 208.5 0 oligotrophy 3 1 0 mesotrophy 44 34 0 eutrophy 53 65 100 hypereutrophy
Table 3. Results of TP and Chl-a mean and Chl-a maxima values and probability of trophic categories from Bidighinzu Lake according to OECD model (1982). JAD = just after diversion, ~1 y after; MAD = mid-diversion, 7–10 y after; LAD = long after diversion, 16–22 y after.
recovery with reduction of external nutrients loads. In Bidighinzu Lake, TP was the only parameter significantly different considering the rANOVA analysis performed on the 3 groups of data. In particular TP in the LAD period
(177 mg m−3 P) showed lower annual mean values,
reduced to half in respect to the previous periods (399 and
303 mg m−3 P in JAD and MAD, respectively). According
to the Organization for Economic Co-operation and Development (OECD 1982), however, TP values place Bidighinzu Lake within the eutrophic and hypereutrophic categories also for LAD (Table 3).
Jeppesen et al. (2005) did not find a clear pattern for DIN in individual lakes, and the decrease in TN was lower than for TP in most lakes. Consequently, the TN:TP increase in lake water was especially due to decreasing TP concentration. Similarly, in Bidighinzu Lake, TN:TP increased mainly due to the decreasing TP trend. No significant tendencies were assessed for TN and DIN,
despite a significant decrease in NH4 in autumn and
winter. These results contrast with those observed in other Sardinian artificial lakes, such as Mulargia and Flumendosa lakes (Sechi et al. 1992, 1996), in which the balance of nutrients showed a greater intake of N than P.
Reduction in reactive Si, the only other nutrient that has shown a significant multiannual trend in Bidighinzu Lake, has been reported from different aquatic ecosystems, especially in the transitional and costal marine areas. Reactive Si reduction is recognized as one of the drivers of phytoplankton species modification from siliceous to nonsiliceous microalgae-dominated communities, with consequences on the whole aquatic food web and the possibility of harmful algal bloom development (Zhang et al. 2004, Viaroli et al. 2013). Reactive Si reduction has been related to a number of drivers such as rainfall regime (Abreu et al. 2010), freshwater discharges (Mozetic and France 2010), agriculture (Viaroli et al. 2013), eutrophication (Smayda 2005), and dam construction (Cloern 2001). In the case of Bidighinzu Lake, reactive Si autumn reduction has been coherent with the rainfall reduction in the same season in the watershed.
Assessing significant multiannual trends in phytoplankton community in Bidighinzu Lake and relationships with environmental variables
Chl-a, TDen, and TBio did not show significant multiannual trends in Bidighinzu Lake, and the ANOVA analysis has not indicated significant differences among the 3 groups of data during JAD, MAD, and LAD. Jeppesen et al. (2005) indicated a significant decrease in Chl-a and biovolume in most of the analyzed case studies of reoligotrophication. In the case of Bidighinzu Lake,
regardless of the reduction, the lacustrine P concentrations have remained sufficiently high to limit phytoplankton
growth (TP < 50 mg m−3; Villena and Romo 2003, Romo
et al. 2004). By contrast, significant multiannual trends have been recognized for different classes and orders, supported by the ANOSIM test, which showed significant differences among species composition in the 3 periods JAD, MAD, and LAD. RDA analysis clearly indicated that temperature and nutrients were the most important environmental variables that determined the class composition and structure of phytoplankton.
Significant multiannual increasing trends have been assessed, especially in summer, for Bacillariophyceae, Chlorophyceae, and Chroococcales, particularly. The expansion of thermal stratification, which has been observed in Bidighinzu Lake, can be a direct consequence of climate warming (Jeppesen et al. 2005, Komatsu et al. 2007). Longer thermal stratification selects phytoplank-ton, favoring taxa more adapted to stronger water stability (Padisák et al. 2009). For example, Chlorococ-cales (the most important order for Chlorophyceae in Bidighinzu Lake) and Chroococcales are typical orders that respond positively to the increasing thermal stability in temperate lakes (Reynolds 1996, 1997). The motile forms of Chrysophyceae, Cryptophyceae, Dinophyceae, and, in part, Chlorophyceae with Sphaerocystis sp., are favored by strong water column stability because they exhibit a characteristic diurnal migration pattern within the epilimnion. In the case of Ceratium, co-occurrence with Microcystis is common (LM association; Padisák et al. 2003, 2009). Unexpectedly, DIN increased in winter in the long-term data of Bidighinzu Lake, whereas in the early years of the study blooms were more prevalent in summer (Lugliè et al. 2001). In addition, Bacillariophy-ceae also showed a significant decrement of biomass in winter. The larger and heavier species observed in winter (in our case, Aulacoseira spp.) require high water turbulence to avoid sinking and losses (Padisák et al. 2003) and thus are disadvantaged during thermal stratifi-cation. By contrast, the smaller species (in our case Cyclotella spp.) have an advantage (Salmaso 2011), especially when stratification is prolonged, as observed in Bidighinzu Lake.
Concerning nutrients, the assessed decrease of P, both TP and orthophosphate, and the contemporaneous increase in TN:TP seem to influence the composition and structure of phytoplankton rather than its abundance (Supplementary Fig. A6). As observed in Bidighinzu Lake, Jeppesen et al. (2005) reported higher importance of diatoms, cryptophytes, dinophytes, and chrysophytes among the key findings from the analysed case studies on trophic reduction. Cyanobacteria decline has been not assessed in Bidighinzu Lake, whereas Jeppesen et al.
DOI: 10.5268/IW-5.4.868 © International Society of Limnology 2015
(2005) reported it in reoligotrophication cases, a result that agrees with the eutrophic permanency of Bidighinzu Lake. In Bidighinzu Lake, species mainly responsible for the differences in the 3 periods were A. flos-aquae, Ceratium hirundinella, Cyclotella spp., and Cryptomonas spp., which show specific nutrient requirements, especially for N. Aphanizomenon flos-aquae is typical of eutrophic and stratified lakes with low N content (Padisák et al. 2009). In Bidighinzu Lake, this species has been found in higher abundances during JAD and LAD periods, characterized by the lowest levels of TN. Members of the genus Cyclotella are often abundant in N-rich eutrophic waters (Berg et al. 2003, McCarthy et al. 2009), possibly because they exhibit a high affinity for
NO3 (Grover et al. 1999). Cryptomonas is also associated
positively with NO3 fertilization (Donald et al. 2013).
Early in the Bidighinzu Lake study, C. hirundinella was the most important species, blooming especially in summer, probably in relation to its mixotrophy (Jones 2000). The motility and nutritional flexibility of Dinophyceae may enable them to successfully overcome N scarcity (Fisher et al. 2013). Therefore, even if significant trends were not assessed for TN and DIN and no clear relationships with phytoplankton were identified, N concentrations and ratios with other nutrients may still have influenced species composition.
Verifying if the observed tendencies in the phytoplankton community and environmental conditions were related to the wastewater diversion carried out overtime
The updated scenario of theoretical P loads over time indicates that the maximum load was in the 1990s in Bidighinzu Lake, attributed to the expansion of industrial activities, especially in the dairy industry sector (Lugliè et al. 2001). Today, in relation to the actual structure and anthropogenic activities in the drainage basin, the theoretical P load is lower than in the 1980s (Supplemen-tary Fig. A6). Regardless, the wastewater diversion
should have reduced the P load up to 1 t y−1 since the end
of the 1980s. The significant decreasing P trend assessed in Bidighinzu Lake concentrations has been the expected effect of the reduced P load over time; nevertheless, it was not assessed until about 10 years after the diversion (Lugliè et al. 2001). In this study, it was not possible to assess if the “failure” of the improvement resulted from nonuse or only partial use of the by-pass, or if the internal P load delayed the recovery, or if the ecosystem resisted moving toward a new ecological equilibrium, as reported for many other lacustrine ecosystems (Romo et al. 2005). Jeppesen et al. (2005) reported that a new equilibrium for TP in most of the 35 lakes analyzed was
reached after 10–15 years, a delay provoked by internal loading. In our case, a significant P reduction was assessed after a longer period (25 years), but it was not enough to modify the trophic status of the lake. Lugliè et al. (2001), applying the Vollenweider model (OECD 1982), concluded that, in the total absence of P load from urban and industrial wastewater, Bidighinzu Lake would not reach a mesotrophic status but only a reduction in the eutrophication.
More complex is the assessment for N, as already highlighted in some relevant Sardinian case studies (Oschiri Lake: Mosello et al. 1989; Medio Flumendosa and Mulargia lakes: Sechi et al. 1992, 1996), when inves-tigating the relationships among the nutrient loading from the drainage basin, the relative trophic status of the lakes, and any possible modification in the discharges. The N load in Bidighinzu Lake (and the majority of other Sardinian lakes) is mainly due to agricultural and livestock activities, deriving from diffuse sources with only a modest contribution from atmospheric input, similar to the western part of the Mediterranean basin (Camacho et al. 2003, EEA 2012). Further, a recent decrease in the contribution from atmospheric input has been assessed also in northern lakes (Edwards and Withers 2008, Greene et al. 2011, Rogora et al. 2012). During the study period, TN did not show a significant decreasing multiannual trend in Bidighinzu Lake or in the comparison among the 3 groups of data (JAD, MAD, and
LAD). Only NH4 showed a significant decreasing trend in
autumn and winter, maybe as a result of a lesser oxygen deficit in the bottom water in these seasons. By comparison, an increasing trend, even if statistically not significant, was assessed in summer, possibly a consequence of the assessed longer stratification period, one of the main signals of climatic change (Wetzel 2001, Foley et al. 2012). Consequently, the wastewater diversion carried out in Bidighinzu Lake may have affected P more than N, as highlighted by Jeppesen et al. (2005).
Conclusion
This long-term study provides more complete information on environmental and phytoplankton tendencies in a Med-iterranean reservoir subjected to a reduction of nutrients input to improve its water quality. At the seasonal scale, summer and autumn were the most critical seasons for the quality and the uses of water, with phytoplankton composition changes associated with abundance of nutrients and physical properties, which are key controlling factors both locally and globally (Elliott et al. 2006, Finkel et al. 2010). Consequently, in addition to local drivers, which should always be considered when
investigating causes of change, others drivers must also be considered. Further, in Mediterranean reservoirs, the operational procedures add variables to global drivers, such as global warming and modification of the precipita-tion regime, increasing the complexity of the systems and limiting our interpretation of ecosystem responses to induced changes. Our data confirm that ecosystem responses can be strongly delayed, and, in the specific case of Lake Bidighinzu, further action is warranted if the reduction of eutrophication is the goal. Among possible restoration actions are improving agricultural, industrial, and urban practices in the watershed or artificially oxygenating the deep layers of the lake, without disrupting thermal stratification, to improve nutrient retention, especially P, in the sediments.
Acknowledgements
This study was funded by University of Sassari, Department of Architecture, Design and Urbanistic (L.R. 7/2007 – POR Sardegna FSE 439 2007-2013). The authors thank the Sassari University Aquatic Ecology group for their support and Bastianina Manca and Pasqualina Farina for laboratory analyses.
References
Abreu PC, Bergesch M, Proença LA, Garcia CAE, Odebrecht C. 2010. Short- and long-term chlorophyll a variability in the shallow microtidal Patos Lagoon Estuary, Southern Brazil. Estuar Coast. 33:554–569.
APAT–RSA/CNR. 2003. Metodi analitici per le acque. Manuali e linee guida 29/2003.
Barbosa AB, Domingues RB, Galvão HM. 2010. Environmental forcing of phytoplankton in a Mediterranean Estuary (Guadiana Estuary, South-western Iberia): a decadal study of anthropogenic and climatic influences. Estuar Coast. 33:324–341.
Barone R, Castelli G, Naselli-Flores L. 2010. Red sky at night cyano-bacteria delight: the role of climate in structuring phytoplankton assemblage in a shallow, Mediterranean lake (Biviere di Gela, southeastern Sicily). Hydrobiologia. 639:43–53.
Beklioglu M, Romo S, Kagalou I, Quintana X, Bécares E. 2007. State of the art in the functioning of shallow Mediterranean lakes: workshop conclusions. Hydrobiologia. 584:317–326.
Berg GM, Balode M, Purina I, Bekere S, Bechemin C, Maestrini S. 2003. Plankton community composition in relation to availability and uptake of oxidized and reduced nitrogen. Aquat Microb Ecol. 30:263–274.
Brunetti M, Buffoni L, Mangianti F, Maugeri M, Nanni T. 2004. Temperature, precipitation and extreme events during the last century in Italy. Global Planet Change. 40:141–149.
Caputo L, Naselli-Flores L, Ordoñez J, Armengol J. 2008. Phyto-plankton distribution along trophic gradients within and among
reservoirs in Catalonia (Spain). Freshwater Biol. 53:2543–2556. Camacho A, Wurtsbaugh WA, Miracle MR, Armengol X, Vicente E.
2003. Nitrogen limitation of phytoplankton in a Spanish karst lake with a deep chlorophyll maximum: a nutrient enrichment bioassay approach. J Plankton Res. 25:397–404.
Carrasco D, Moreno E, Sanchis D, Wörmer L, Paniagua T, Del Cueto A, Quesada A. 2006. Cyanobacterial abundance and microcystin occurrence in Mediterranean water reservoirs in Central Spain: mi-crocystins in the Madrid area. Eur J Phycol. 41:281–291.
Clarke KR, Warwick RM. 1994. Change in marine communities: an approach to statistical analysis and interpretation, Bournemouth (UK): Bourne Press Ltd.
Cloern JE. 2001. Our evolving conceptual model of the coastal eu-trophication problem. Mar Ecol Prog Ser. 210:223–253.
Cook MC, Vardaka E, Lanaras T. 2004. Toxic cyanobacteria in Greek freshwaters, 1987–2000: occurrence, toxicity, and impacts in the Mediterranean region. Acta Hydrochim Hydrobiol. 32:107–124. D’Alcalà MR, Conversano F, Corato F, Licandro P, Mangoni O,
Marino D, Mazzocchi MG, Modigh M, Montresor M, Nardella M, et al. 2004. Seasonal patterns in plankton communities in a pluriannual time series at a coastal Mediterranean site (Gulf of Naples): an attempt to discern recurrences and trends. Sci Mar. 68:65-83.
de Senerpont Domis LN, Elser JJ, Gsell AS, Huszar VLM, Ibelings BW, Jeppesen E, Kosten S, Mooij WM, Roland F, Sommer U, et al. 2013. Plankton dynamics under different climatic conditions in space and time. Freshwater Biol (Special Issue): Plankton Dynamics in a Fast Changing World. 58(3):463–482.
Donald DB, Bogard MJ, Finlay K, Bunting L, Leavitt PR. 2013. Phy-toplankton-specific response to enrichment of phosphorus-rich surface waters with ammonium, nitrate, and urea. PLoS ONE. 8(1):e53277. doi:10.1371/journal.pone.0053277
ECOSTAT. 2003. Guidance on establishing reference conditions and ecological status class boundaries for inland surface waters. Luxembourg: European Commission.
ECOSTAT. 2004. Guidance on the Intercalibration process. Luxembourg: European Commission.
Edwards AC, Withers PJA. 2008. Transport and delivery of suspended solids, nitrogen and phosphorus from various sources to freshwaters in the UK. J Hydrol. 350:144–153.
[EEA] European Environment Agency. 2012. Climate change, impacts and vulnerability in Europe 2012. An indicator-based report. Copenhagen (Denmark): Report N°12 ISSN 1725-9177. Elliott JA, Jones ID, Thackeray SJ. 2006. Testing the sensitivity of
phytoplankton communities to changes in water temperature and nutrient load, in a temperate lake. Hydrobiologia. 559:401–411. Ente Acque della Sardegna. 2015. Available from: http://www.enas.
sardegna.it
European Parliament. 2000. Directive 2000/60/EC of the European Parliament and of the Council establishing a framework for community action in the field of water policy. Official J Eur Union. L327:1–72.
DOI: 10.5268/IW-5.4.868 © International Society of Limnology 2015
JA. 2010. Phytoplankton in a changing world: cell size and elemental stoichiometry. J Plankton Res. 32:119–137.
Fisher J, James CS, Moore VL, Moss B. 2013. Dinophyta character-ise nitrogen scarcity more strongly than Cyanobacteria in moderately deep lakes. Acta Protozool. 52:203–216.
Foley B, Jones ID, Maberly SC, Rippey B. 2012. Long-term changes in oxygen depletion in a small temperate lake: effects of climate change and eutrophication. Freshwater Biol. 57:278–289.
Fresenius WKE, Quentin WW, Scheneider W. 1988. Water analysis. A practical guide to physico-chemical and microbiological water examination and quality assurance. Berlin (Germany): Springer-Verlag. 320 p.
García-Ruiz JM, López-Moreno JI, Vicente-Serrano SM, Lasanta– Martínez T, Beguería S. 2011. Mediterranean water resources in a global change scenario. Earth Sci Rev. 105:121–139.
Geraldes AM, Boavida M-J. 2005. Seasonal water level fluctuations: Implications for reservoir limnology and management. Lakes Reserv Res Manage. 10:59–69.
Gilbert RO. 1987. Statistical methods for environmental pollution monitoring. New York: Van Nostrand Reinhold Co. 320 p. Giorgi F. 2002. Variability and trends of sub-continental scale surface
climate in the twentieth century. Part II: AOGCM simulations. Clim Dynam. 18:693–708.
Giorgi F. 2006. Climate change hot-spots. Geophys Res Lett. 33:L08707. doi:10.1029/2006GL025734
Goltermann HL, Clymo RS, Ohnstad MAM. 1978. Method for physical and chemical analysis of fresh waters. I.B.P.N. 8. Oxford (UK): Blackwell Scientific. 214 p.
Grover JP, Sterner RW, Robinson JL. 1999. Algal growth in warm temperate reservoirs: nutrient-dependent kinetics of individual taxa and seasonal patterns of dominance. Arch Hydrobiol. 145:1–23.
Greene S, Taylor D, McElarney YR, Foy RH, Jordan P. 2011. An evaluation of catchment-scale phosphorus mitigation using load apportionment modelling. Sci Total Environ. 409:2211–2221. Guinder VA, Popovich CA, Molinero JC, Perillo GME. 2010.
Long-term changes in phytoplankton phenology and community structure in the Bahía Blanca Estuary, Argentina. Mar Biol. 157:2703–2716.
Jeppesen E, Søndergaard M, Jensen JP, Havens KE, Anneville O, Carvalho L, Coveney MF, Deneke R, Dokulil MT, Foy B, et al. 2005. Lake responses to reduced nutrient loading – an analysis of contemporary long-term data from 35 case studies. Freshwater Biol. 50:1747–1771.
Jones RI. 2000. Mixotrophy in planktonic protists: an overview. Freshwater Biol. 45:219–226.
Komárek J, Komárková J. 2002. Review of the European Microcys-tis-morphospecies (Cyanoprokariotes) from nature. J Czech Phycol, Olomouc. 2:1–24.
Komárek J, Zapomělová E. 2007. Planktic morphospecies of the cya-nobacterial genus Anabaena = subg. Dolichospermum – 1. Part: coiled types. Fottea, Olomouc. 7:1–31.
Komárek J, Zapomělová E. 2008. Planktic morphospecies of the
cya-nobacterial genus Anabaena = subg. Dolichospermum – 2. Part: straight types. Fottea, Olomouc. 8:1–14.
Komatsu E, Fukushima T, Harasawa H. 2007. A modeling approach to forecast the effect of long-term climate change on lake water quality. Ecol Model. 209:351–366.
Lionello P, editor. 2012. Introduction. Mediterranean climate: background information. In: The Climate of the Mediterranean Region - from the past to the future. Elsevier.
Lionello P, Malanotte-Rizzoli P, Boscolo R. 2006. The Mediterranean climate: an overview of the main characteristics and issues in Med-iterranean Climate Variability. Elsevier.
Liu X, Lu X, Chen Y. 2011. The effects of temperature and nutrient ratios on Microcystis blooms in Lake Taihu, China: an 11-year in-vestigation. Harmful Algae. 10:337–343.
Lugliè A, Aktan Y, Casiddu P, Sechi N. 2001. The trophic status of Bidighinzu Reservoir (Sardinia) before and after the diversion of waste waters. J Limnol. 60:135–142.
Lugliè A, Sechi N. 1993. Trophic status and phytoplankton in Lake Bidighinzu. Giorn Bot Ital. 127:765–785.
Marchetti R, Barone R, Calvo S, Lugliè A, Naselli-Flores L, Sechi N. 1992. Studies on Italian reservoirs. Mem Ist Ital Idrobiol. 50:37–363.
Marchetto A, Padedda BM, Mariani MA, Lugliè A, Sechi N. 2009. A numerical index to evaluate the phytoplankton response to changes in nutrient levels in deep Mediterranean reservoirs. J Limnol. 68:106–121.
McCarthy MJ, James RT, Chen Y, East TL, Gardner WS. 2009 Nutrient ratios and phytoplankton community structure in the large, shallow, eutrophic, subtropical Lakes Okeechobee (Florida, USA) and Taihu (China). Limnology. 10:215–227.
Messineo V, Bogialli S, Melchiorre S, Sechi N, Lugliè A, Casiddu P, Mariani MA, Padedda BM, Di Corcia A, Mazza R, et al. 2009. Cyanotoxins occurrence in Italian freshwaters. Limnologica. 39:95–106.
Mosello R, Sechi N, Cossu A. 1989. Il carico chimico veicolato al Lago Oschiri [The chemical load to Lake Oschiri]. In: conference proceedings, La qualità dell’acqua in Sardegna. Il problema dell’eutrofizzazione: cause, conseguenze, rimedi. Cagliari (CA): Provincia di Cagliari editions: p. 117–130.
Moustaka-Gouni M, Vardaka E, Tryfon E. 2007. Phytoplankton species succession in a shallow Mediterranean lake (L. Kastoria, Greece): steady-state dominance of Limnothrix redekei, Microcystis aeruginosa and Cylindrospermopsis raciborskii. Hyd-robiologia. 575:129–140.
Mozetic P, France J. 2010. Phytoplankton in the Gulf of Trieste, 1984-2007: trends, community changes, and links to recent envi-ronmental changes. CIESM Workshop Monographs. 40:43–48. Naselli-Flores L. 2003. Man-made lakes in Mediterranean semi-arid
climate: the strange case of Dr. Deep Lake and Mr. Shallow Lake. Hydrobiologia. 506/509:13–21.
Naselli-Flores L. 2014. Morphological analysis of phytoplankton as a tool to assess ecological state of aquatic ecosystems: the case of Lake Arancio, Sicily, Italy. Inland Waters. 4:15–26.
Naselli-Flores L, Barone R. 2005. Water-level fluctuations in Medi-terranean reservoirs: setting a dewatering threshold as a management tool to improve water quality. Hydrobiologia. 548:85–99.
Naselli Flores L, Lugliè A. 2014. Laghi artificiali dell’Italia meridionale e delle isole maggiori. Biol Ambient. 28:1–8.
[OECD] Organisation for Economic Co-operation and Development. 1982. Eutrophication of waters: monitoring, assessment and control. OECD Publications, N° 42077, Paris. 154 p.
Padisák J, Crossetti LO, Naselli-Flores L. 2009. Use and misuse in the application of the phytoplankton functional classification: a critical review with updates. Hydrobiologia. 621:1–19.
Padisák J, Soróczki-Pintér É, Rezner Zs. 2003. Sinking properties of some phytoplankton shapes and the relation of form resistance to morphological diversity of plankton: an experimental study. Hyd-robiologia. 500:243–257.
Poikane S, editor. 2009. Water Framework Directive intercalibration technical report. Part 2: Lakes. Luxembourg: Office for Official Publications of the European Communities.
Provini A, Mosello R, Pettine M, Puddu A, Rolle E, Spaziani FM. 1979. Metodi e problemi per la valutazione dei carichi dei nutrienti. Atti Conv. L’eutrofizzazione in Italia, Roma, 1978. p. 121–158. Pulina S, Suikkanen S, Satta C, Mariani MA, Padedda B, Virdis T,
Caddeo T, Sechi N, Lugliè A. 2014. Multiannual phytoplankton trends in relation to environmental changes across aquatic domains: a case study from Sardinia (Mediterranean Sea). Plant Biosystems. doi.org/10.1080/11263504.2014.989283
R Core Team. 2014. R: A language and environment for statistical computing. R Foundation for Statistical Computing. Vienna (Austria). ISBN 3-900051-07-0. Available from: http://www. Rproject.org/
Reynolds CS. 1996. The plant life of the pelagic. Int Ver Theor Angew Limnol. 26:97–113.
Reynolds CS. 1997. Vegetation processes in the pelagic: a model for ecosystem theory. Oldendorf/Luhe (Germany): Ecology Institute. 371 p.
Rogora M, Arisci S, Marchetto A. 2012. The role of nitrogen deposition in the recent nitrate decline in lakes and rivers in Northern Italy. Sci Total Environ. 417–418:214–223.
Romo S, Miracle R, Villena MJ, Rueda J, Ferriol C, Vicente E. 2004. Mesocosm experiments on nutrient and fish effects on shallow lake food webs in a Mediterranean climate. Freshwater Biol. 49:1593– 1607.
Romo S, Villena MJ, Sahuquillo M, Soria JM, Gimenez M, Alfonso T, Vicente E, Miracle MR. 2005. Response of a shallow Mediter-ranean lake to nutrient diversion: does it follow similar patterns as in northern shallow lakes? Freshwater Biol. 50:1706–1717. Salmaso N. 2011. Interactions between nutrient availability and
climatic fluctuations as determinants of the long-term phytoplank-ton community changes in Lake Garda, Northern Italy. Hydrobio-logia. 660:59–68.
Salmaso N, Naselli-Flores L, Padisák J. 2012. Impairing the largest and most productive forest on our planet: how do human activities
impact phytoplankton? Hydrobiologia. 698:375–384.
Sardegna Ambiente. 2015. Available from: http://www.sardegnaam-biente.it
Scheffer M, Brock W, Westley F. 2000. Socioeconomic mechanisms preventing optimum use of ecosystem services: an interdiscipli-nary theoretical analysis. Ecosystems. 3:451–471.
Sechi N. 1986. Il problema dell’eutrofizzazione dei laghi artificiali della Sardegna. In: Atti convegno Internazionale la qualità dell’acqua in Sardegna. Eutrofizzazione: cause, conseguenze, rimedi. Cagliari, Italy, 15–16 May 1986. p. 71–82.
Sechi N, Botti P, Vacca S, Mosello R. 1992. Deflusso e rilascio di nutrienti nel bacino del Rio Uvini (Sardegna centro-meri-dionale). Estratto da: 3° Seminario della seconda sezione tecnica dell’A.I.G.R. “Insediamenti zootecnici e protezione dell’ambiente.” Udine, Italy, 25–27 Sep 1991. p. 609–616.
Sechi N, Botti P, Luglié A, Vacca S, Mosello R. 1996. Bilancio di azoto e fosforo dei laghi artificiali Medio Flumendosa e Mulargia (Sardegna centro-meridionale). Acqua-aria. 4:409–413.
Sechi N, Lugliè A. 1992. Limnological studies on manmade lakes in Sardinia (Italy). Mem Ist Ital Idrobiol. 50:365–381.
Sechi N, Lugliè A. 1996. Phytoplankton in Sardinian reservoirs. Giorn Bot Ital. 130:977–994.
Servizio Idrografico di Cagliari. 2015. Available from: http://www. sardegna-clima.it/index.php/pluviometrie
Smayda TJ. 2005. Eutrophication and phytoplankton. In: Wassmann P, Olli K, editors. Drainage basin nutrient inputs and eutrophica-tion: an integrated approach. Tromsoe (Norway): University of Tromsoe. Available from: www.ut.ee/~olli/eutr/
Strickland JDH, Parsons TR. 1972. A practical handbook seawater analysis. Bull Fish Res Board Can. 310 p.
Suda S, Watanabe MM, Otsuka S, Mahakahant A, Yongmanitchai W, Nopartnaraporn N, Liu Y, Day JG. 2002. Taxonomic revision of water-bloom-forming species of oscillatorioid cyanobacteria. Int J Syst Evol Micro. 52:1577–1595.
Suikkanen S, Laamanen M, Huttunen M. 2007. Long-term changes in summer phytoplankton communities of the open northern Baltic Sea. Estuar Coast Shelf Sci. 71:580–592.
Sun J, Liu DY. 2003. Geometric models for calculating cell biovolume and surface area for phytoplankton. J Plankton Res. 25:1331–1346.
Ter Braak CJF, Šmilauer P. 1998. CANOCO reference manual and user’s guide to CANOCO for Windows. Wageningen (Netherlands): Centre for Biometry.
Thackeray SJ, Nõges P, Dunbar MJ, Dudley BJ, Skjelbred B, Morabito G, Carvalho L, Phillips G, Mischke U, Catalan J, et al. 2013. Quantifying uncertainties in biologically-based water quality assessment: a pan-European analysis of lake phytoplankton community metrics. Ecol Indic. 29:34–47.
Utermöhl H. 1958. Zur vervollkhung der quantitativen phytoplank-tonmethodik. Mitt Internat Verein Limnol. 9:1–38.
Vacca A, Loddo S, Ollesch G, Puddu R, Serra G, Tomasi D, Aru A. 2000. Measurement of runoff and soil erosion in three areas under different land use in Sardinia (Italy). Catena. 40:69–92.
DOI: 10.5268/IW-5.4.868 © International Society of Limnology 2015
Viaroli P, Nizzoli D, Pinardi M, Rossetti G, Bartoli M. 2013. Factors affecting dissolved silica concentrations, and DSi and DIN stoichi-ometry in a human impacted watershed (Po River, Italy). Silicon. 5:101–114.
Villena M-J, Romo S. 2003. Phytoplankton changes in a shallow Mediterranean lake (Albufera of Valencia, Spain) after sewage diversion. Hydrobiologia. 506–509:281–287.
Wetzel RG. 2001. Limnology: lake and river ecosystems, 3rd ed.
Academic Press, USA.
Zhang J, Yu ZG, Raabe T, Liu SM, Starke A, Zou L, Gao HW, Brockmann U. 2004. Dynamics of inorganic nutrient species in the Bohai Sea waters. J Mar Syst. 44:189–212.
Zohary T, Ostrovsky I. 2011. Ecological impacts of excessive water level fluctuations in stratified freshwater lakes. Inland Waters. 1:47–59.
Supplementary Material
Supplementary Material is available for download via the Inland Waters website, https://www.fba.org.uk/journals/index.php/IW: