Spain
Francesco Calderoni Monica Angelini Marina Mancuso Martina Rotondi THE FACTBOOK ON THEILLICIT TRADE IN TOBACCO PRODUCTS
Directed by: Ernesto U. Savona
Spain
Francesco Calderoni Monica Angelini Marina Mancuso Martina Rotondi
Series: The Factbook on the Illicit Trade in Tobacco Products Issue 7
Series editor: Ernesto U. Savona
Transcrime – Joint Research Centre on Transnational Crime
Università Cattolica del Sacro Cuore di Milano – Università degli Studi di Trento Milan office (headquarters): Largo Gemelli, 1 – 20123 Milano (Italy)
Phone: +39 02 7234 3715 / 3716; Fax: +39 02 7234 3721 www.transcrime.it
2014
ISBN 978-88-8443-567-5
Suggested Citation: Calderoni Francesco, Monica Angelini, Marina Mancuso, Martina Rotondi. Spain. The Factbook on the Illicit Trade in Tobacco Products 7. Trento: Transcrime – Università degli Studi di Trento, 2014
© 2014 Transcrime – Joint Research Centre on Transnational Crime
All rights reserved. No part of this publication may be reproduced, stored in a retrieval system or transmitted in any form or by any means electronic, mechanical, photocopying, recording or otherwise, without the prior written permission of the author.
Credits: Raúl Gómez (cover), Antonio Gil (image p.17), Santiago S.V. (image p.23), Geca Industrie Grafiche (image p.33), ·Larme·(image p.41), [email protected] (image p.47) creative commons license
Transcrime
1
The Factbook on the Illicit Trade in Tobacco
Products
3
Acknowledgements
5
Executive summary
7
Introduction
13
Why focus on the ITTP in Spain?
13
What can be found in this report?
14
Chapter 1: the five drivers
16
Society and economy
17
Legal market
23
Regulation
33
Crime environment
41
Enforcement
47
Chapter 2: the four components
56
The demand
57
The supply
61
The products
67
Modus operandi and geographical distribution
75
Chapter 3: framing the components in the drivers
82
Introduction: the four key factors
83
Economic accessibility
84
Availability
85
Profitability
87
Risk
88
Conclusions
91
References
97
TABLE OF CONTENTS
1
The factbook on the illicit trade in tobacco products
SP
AIN
The factbook on the illicit trade in tobacco products
SP
AIN
TRANSCRIME
Transcrime is the Joint Research Centre on Transnational Crime of Università Cattolica del Sacro Cuore of Milan and the University of Trento. The Centre, directed by Ernesto U. Savona, Professor of Criminology at Università Cattolica, represents the multiannual union between experience and innovation in the field of criminological research.
Its offices are located in Milan and Trento. In each office there is a team of researchers and secretariat/ management personnel. Transcrime aims at being a national and international point of reference in the criminological field.
The vision of the Centre is to increase knowledge in the criminological field and in the prevention of crimes, developing innovative ideas and cutting-edge techniques. Transcrime.
Transcrime combines its experience in applied research with the consolidated scientific tradition of Università Cattolica del Sacro Cuore in Milan and University of Trento, mixing a practice-oriented approach with a profound understanding of criminal phenomena. Through this experience, it developed a solid network of relationships in the academic field, institutions, international organisations and businesses.
The Centre also plays an important role in the support and development of educational activities at Università Cattolica del Sacro Cuore of Milan. Its principal aim is to achieve close integration between scientific innovation and academic education. In particular, since the academic year 2005/06, Transcrime has managed a MA programme dedicated to crime and security (until academic year 2012/13 the curriculum Crime&Tech: Crime Sciences and Technologies for Security within the MA in Applied Social Sciences; since the 2013/14 academic year curriculum POLISI: Policies for security within the MA in Public Policy). In addition, the Centre has contributed to the development of the International Ph.D. programme in Criminology, coordinated by Professor Henk van De Bunt of Erasmus University (Rotterdam), which is currently the only doctoral course dedicated to Criminology in Italy.
Transcrime is an independent academic centre. It pursues an autonomous research agenda, which may be developed also through contracts and funding by private and public local, national and international institutions. The source of funding is always made public through Transcrime’s website.
3
The factbook on the illicit trade in tobacco products
SP
AIN
This report is part of the project The Factbook on the Illicit Trade in Tobacco Products (henceforth ITTP)
The project has been developed by Transcrime after the Round Table on Proofing EU Regulation against the
Illicit Trade in Tobacco Products hosted by Università
Cattolica of Milan, on 5 May 2011. During the Round Table, participants (researchers and policymakers with experience in the field of the illicit trade in tobacco products) agreed on a research agenda concerning the ITTP (Transcrime 2011). Items 3 and 6 of the research agenda focused on the need for better analysis of the tobacco market taking account of its dual nature (i.e. legal and illicit) and how licit and illicit markets vary across different countries and regions. Given these considerations, Transcrime has developed the ‘Factbook on the ITTP’, a multi–annual research plan providing detailed analyses of the ITTP and of its relations with the legal market and other socio-economic and political factors in a number of countries around the world.
The aim of the Factbook is to provide an innovative instrument able to shed light on the complex mechanisms behind the ITTP in different countries. This report focuses on Spain.
THE FACTBOOK ON THE ILLICIT
TRADE IN TOBACCO PRODUCTS
Tobacco consumption is undoubtedly a danger for human health, and governments should carefully regulate the tobacco market. Illicit tobacco avoids state regulation and taxation and may jeopardize tobacco control policies.
The Factbook will contribute to raising awareness about the global importance of the ITTP and about the strategies available to prevent it. The Factbook
has been developed for a wide readership ranging from policymakers, through academics, to interested stakeholders, the intention being to provide a support to develop knowledge-based debates and policies on the ITTP.
The information gathered for this report originates from
unofficial sources, academic literature, grey literature, open sources, questionnaires and interviews with experts and stakeholders. Law enforcement authorities’
reports and press releases were also a valuable source of information for the study.
The results of the report do not claim to be exhaustive, nor an accurate reflection of criminal practices. They provide an initial assessment of the ITTP in Spain and
a starting point for future research.
As a concerned stakeholder in the fight against the illicit trade in tobacco products, Philip Morris International (PMI) welcomed Transcrime’s initiative to develop the Factbook on the ITTP with financial support and the provision of data. However, Transcrime retained full control and stands guarantor for the independence of the research and its results. Information and data for the study have been collected by Transcrime and have not been shared with PMI.
5
The factbook on the illicit trade in tobacco products
SP
AIN
Especial thanks go to (in alphabetical order) José María Espinar,
Unión de Asociaciones de Estanqueros de España, Mónica Dopico Martínez, Unit for specialised and violent crime of the
Policía de España, Ángel Alonso Miranda, Fiscal Department of
the Spanish Guardia Civil, Cabinet of the Director-General of the
Agencia Estatal de Administración Tributaria.
7
The factbook on the illicit trade in tobacco products
SP
AIN
This report is part of the project The Factbook on the Illicit
Trade in Tobacco Products (hereafter ITTP). It focuses on
Spain, where the illicit trade in tobacco products is an emerging issue, particularly in certain regions. After
tax increases in 2009-2010, Spain became a destination market of illicit tobacco and the ITTP penetration peaked
at 8.8% in 2013. Nevertheless, the ITTP level is lower than the European average. In the past, ITTP penetration had decreased from 6% to almost 1% between 1998 and 2010, due to the successful enforcement actions against contraband. Spain used to be a transit country.
Non-domestic cigarettes are widespread mainly in two Spanish regions, Andalusia and Extremadura. These
regions are close to Gibraltar, where cigarettes cost half
the price of Spanish cigarettes. Moreover, Spain also comprises the Canary Islands, which have a different
tax regulation, making cigarettes cheaper than on the Spanish mainland. Indeed, Gibraltar and the Canary Islands are the main sources of illicit cigarettes.
WHAT CAN BE FOUND IN THIS
REPORT?
This report is organised into three chapters:
•• Chapter one deals with the five drivers of the ITTP: society and economy, legal market, regulation,
crime environment and enforcement. The drivers are important areas whose structures may positively or negatively impact on the ITTP. To enable comparison with other country profiles, four key indicators have been selected for each driver. The data for the driver indicators come from comparable sources (latest available years). When possible, the report provides the most up-to-date data from national sources.
•• Chapter two focuses on the four components of the ITTP: demand, supply, products, modus
operandi and geographical distribution. •• Chapter three identifies the key factors of the
ITTP in Spain and frames the drivers in the components, analysing how different elements of the drivers influence the components of the ITTP.
8
Executive Summary
THE FIVE DRIVERS
•• Society and Economy: Spain has been hit hard by the global financial crisis. The unemployment rate has increased while both GDP per capita and household consumption have decreased. The Spanish Government is currently being aided by the EU and international organisations to accelerate economic recovery. Health and education expenditures are below the EU average and income inequality is among the highest among EU member states.
•• Legal Market: The Spanish tobacco market is relatively large on a global scale. However, legal cigarette sales have fallen in the past decade while hand rolling tobacco (HRT) sales have grown significantly. Cigarette prices are high in global terms, but cigarettes are relatively affordable. Smoking prevalence is high and varies according to the region. Andalusia, Murcia and the Valencian Community have the highest prevalence.
•• Regulation: Taxation on tobacco products has increased since 2005, and is among the highest on a global scale, both as tax incidence on the retail price and as monetary value per 1,000 sticks. However, the Canary Islands have a different taxation regime, enabling lower taxation to be levied on tobacco. There is a medium-low level of control on the tobacco supply chain and medium-high control on tobacco marketing and promotion, and tobacco consumption and sales.
•• Crime Environment: Crime rates have decreased in recent years. There is a medium presence of organised crime activities mainly centred on drug trafficking, property crimes and human trafficking. Drug consumption is high, especially for cannabis and cocaine. The shadow economy is medium-low in extent, while corruption is a growing concern.
•• Enforcement: Since 2011, Spain has implemented two awareness campaigns against the ITTP.
Moreover, law enforcement agencies and the Spanish Customs have stipulated cooperation agreements with foreign customs and law enforcement agencies to tackle the ITTP. The average penalty for tobacco contraband is low, between 0 and 2 years of imprisonment. Overall, anti-ITTP action is medium-low due to the absence of official estimates on, and a national action plan against, the ITTP.
THE FOUR COMPONENTS OF THE
ITTP
•• The demand: The demand for illicit tobacco products in Spain responds to the economic crisis, rising unemployment, and higher cigarettes prices. Indeed, a pack of illicit cigarettes, especially of the most popular brands, is sold for half the price of a pack sold in the legal market. Illicit tobacco is easily available and generally tolerated by Spaniards.
•• The supply: Individual smugglers and large-scale criminal organisations are the main suppliers of illicit tobacco in Spain. Price differentials and proximity to Gibraltar, Andorra and the Canary Islands, together with the current economic crisis, are conditions favourable for the supply of illicit tobacco in the country.
•• The products: The main tobacco products smuggled into Spain are illicit whites and genuine contraband cigarettes. In particular, Ducal, American Legend and Elixyr are the most widespread illicit whites brands. Counterfeit cigarettes have a low incidence within the Spanish ITTP. The main source countries of illicit cigarettes are the Canary Islands, Andorra and Gibraltar.
•• Modus Operandi and Geographical Distribution:
Several modi operandi are used to traffic illicit tobacco in Spain. Both sea routes and inland routes are employed: the former for large-scale smuggling, the latter for small-scale smuggling. Andorra, Gibraltar and the Canary Islands are source hotspots of the Spanish ITTP. Finally, the incidence of non-domestic cigarettes is higher in the Southern region of Andalusia and particularly in the ports on the Mediterranean Sea.
9
The factbook on the illicit trade in tobacco products
SP
AIN
Executive Summary
FRAMING THE COMPONENTS IN
THE DRIVERS: THE FOUR KEY
FACTORS OF THE ITTP
The report identifies four key factors of the ITTP in Spain.
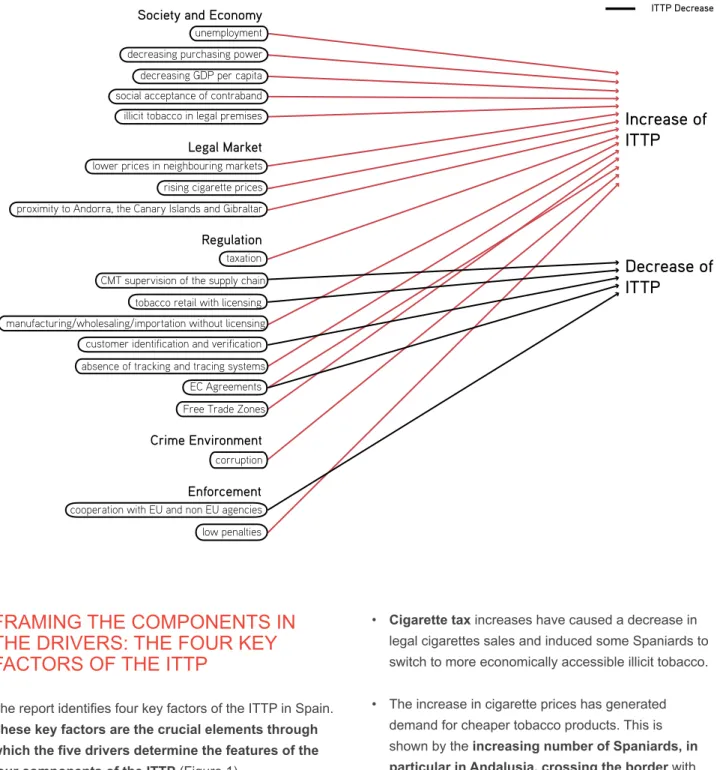
These key factors are the crucial elements through which the five drivers determine the features of the four components of the ITTP (Figure 1).
•• Economic accessibility: the price of illicit tobacco and particularly its relative price compared to the price of legal products.
• The economic crisis in Spain, the high
unemployment rate, and the decreased purchasing power of Spaniards are conditions favouring the
demand for illicit tobacco due to its greater economic accessibility.
• Cigarette tax increases have caused a decrease in
legal cigarettes sales and induced some Spaniards to switch to more economically accessible illicit tobacco.
• The increase in cigarette prices has generated demand for cheaper tobacco products. This is shown by the increasing number of Spaniards, in particular in Andalusia, crossing the border with
Gibraltar in search of cheaper cigarettes.
•• Availability: the relative ease with which both smugglers and consumers can obtain illicit tobacco products.
• The availability of illicit tobacco in bars, shops, street vendors and small markets in Spain impacts
positively on the demand for and supply of illicit tobacco.
Figure 1. The main interactions between the drivers and the ITTP
Source: Transcrime elaboration
decreasing purchasing power
Decrease of
ITTP
Increase of
ITTP
Society and Economy
unemployment
illicit tobacco in legal premises social acceptance of contraband decreasing GDP per capita
cooperation with EU and non EU agencies
Enforcement
low penalties
Legal Market
proximity to Andorra, the Canary Islands and Gibraltar rising cigarette prices lower prices in neighbouring markets
Regulation
EC Agreements Free Trade Zones customer identification and verification absence of tracking and tracing systems
tobacco retail with licensing manufacturing/wholesaling/importation without licensing
taxation CMT supervision of the supply chain
Crime Environment
corruption
ITTP Increase ITTP Decrease
10
• The widespread social acceptance and tolerance of contraband are factors important in boosting the
availability of illicit tobacco and favouring its demand.
• Cigarettes with lower prices in the Canary Islands and in neighbouring countries (Gibraltar and Andorra) increase the availability of tobacco products
to be bootlegged and smuggled.
• The regulation or deregulation of the tobacco sector impacts both positively and negatively
on the availability of illicit tobacco. Indeed, on the one hand, the presence of a licensing obligation for tobacco retailers may reduce the availability of
illicit tobacco products, as well as the faculty of the CMT (Comisionado para el Mercado de Tabacos) to request any documents concerning the origin and
destination of tobacco products. On the other hand,
the absence of a licensing system for tobacco manufacturers, wholesalers and importers may
increase the diversion of tobacco from the legal supply chain. Furthermore, the agreements on supply chain control between the EC and the four major tobacco companies are legally binding only on the signatory parties, not on smaller manufacturers; which may increase the diversion of products into illicit channels.
• A high level of perceived corruption in Spain
impacts positively on the availability of illicit tobacco.
•• Profitability: the ability of the ITTP to generate profits that exceed its operational costs.
• The proximity to markets such as Andorra, the Canary Islands and Gibraltar, where there is a
significant tax and price differential on tobacco products, favours the smuggling of tobacco products, increasing the profits of the ITTP.
• Cigarettes price differentials between Spain and other markets make the ITTP in Spain a profitable
activity.
•• Risk: the threat of detection/accusation/conviction and the sanctions imposable on the actors involved in the ITTP.
• Spaniards’ tolerance of contraband activities may
boost the demand for and the supply of the ITTP by diminishing the risks for the actors involved.
• The controls of the CMT, providing for customer
identification and verification of the tobacco supply chain, increase the risks for the ITTP. However, the presence of loopholes in supply chain controls
(e.g. the absence of a tracking and tracing system of all tobacco manufacturers) impacts on the ITTP by decreasing the risks for smugglers.
• The presence of Free Trade Zones (FTZs), Vigo, Barcelona, Cádiz and Grand Canaria, boosts the
supply of illicit tobacco by decreasing the risks for smugglers.
• Border permeability between Spain, Andorra, the
Canary Islands and Gibraltar decreases the risks for the illicit suppliers of tobacco.
• Law enforcement cooperation in the fight against tobacco smuggling may increase the risk for
smugglers. Indeed, the bilateral and multilateral
agreements signed by the Spanish Customs with other countries impact negatively on the supply of illicit tobacco by increasing the risks for smugglers.
• The low penalties imposed for tobacco smuggling
in Spain (between 0 and 2 years of imprisonment)
may decrease the perception of risk among smugglers.
11
The factbook on the illicit trade in tobacco products
SP
AIN
CONCLUSIONS
The ITTP in Spain has increased in recent years,
reaching 8.8% of total consumption in 2013. From 1995
to 2000, the ITTP strongly decreased, remaining stable at about 1% of the market until 2011. Thinkcom, a
research centre of the University of Madrid, reports that the ITTP penetration is between 10.23% and 11.75% of the cigarettes market in 2013. Illicit whites are the most widespread products. Genuine contraband
cigarettes are the only other product smuggled.
According to Empty Pack Surveys – henceforth EPSs– the regions of Andalusia and Extremadura have the
highest incidence of non-domestic packs collected in Spain. In particular, cities in Andalusia, especially those with ports, are more likely to receive illicit flows.
Smugglers exploit sea routes for large-scale smuggling
and inland routes for small-scale contraband. Studies
indicate that individual smugglers and large-scale criminal organisations are the main suppliers of illicit
tobacco in Spain.
This report demonstrates that more research and accurate data would enable better assessment of the ITTP in Spain. Indeed, there are no publicly available official estimates of the ITTP in Spain. Furthermore, there is no research on the socio-economic characteristics of illicit tobacco consumers.
The ITTP varies according to regulatory and law
enforcement actions. For example, enforcement
actions against tobacco smuggling in the late 1990s
contributed to decreasing the ITTP. However, in 2009-2010 the Government increased taxation on tobacco products. As a result, the ITTP in Spain has increased.
Moreover, in 2011 and 2013, two awareness campaigns
were launched; the former at national level, the latter at regional level, in Andalusia. However, no action plan against the ITTP has been implemented to date. Furthermore, the retail, manufacturing, wholesaling and importation of tobacco products is no longer subject to licensing in Spain. This may create loopholes in supply chain control at these levels.
Effective action against the ITTP requires comprehensive strategies including criminal law, administrative sanctions, and other indirect measures aimed at reducing crime opportunities.
The evolution of the project showed that countries have very different situations in relation to the available data on the ITTP. In some cases, the quality of the available data is low and there are no official, regularly updated, data. Inevitably, this affects the quality and reliability of the results. In these cases, institutions, businesses and other stakeholders concerned with the ITTP should consider how to improve data collection on illicit tobacco. This will result in improved knowledge about the ITTP and, in turn, in better tobacco control policies, since the impact of specific policy measures upon crime may quite often be overlooked owing to the lack of reliable data.
After completion of the first phase of the project focused on collecting facts and data through the country profiles, Transcrime will conduct comparative analysis among the countries selected. This will yield additional insights into the complexity of the ITTP and allow for the elaboration of policy recommendations.
12
Source: The World Bank
Location:
Spain, officially the Kingdom of Spain, is located in the Iberian Peninsula in Southwestern Europe. It borders on France (Northeast), Andorra (Northeast), Portugal (West), Atlantic Ocean (Northwest), Gibraltar (South) and Mediterranean Sea (South). The Spanish territory also includes the Balearic Islands (in the Mediterranean Sea), the Canary Islands (in the Atlantic Ocean), and three exclaves in North Africa (Ceuta, Melilla, and Peñón de Vélez de la Gomera). The country consists of 17 autonomous communities. Its capital and largest city is Madrid. Spain covers an area of 505,600 square kilometres.
Population: 46,647,421 (2013)
Male: 23,043,826 (49.4%)
Female: 23,603,595 (50.6%) Growth Annual Rate: -0.2% (2013)
Age Structure: (0–14) 15.0%; (15–64) 67.0%; (65+) 18.0% Fertility Rate: 1.3 children born/woman (2012)
Life expectancy at birth (years): 82.0 (2012) GDP: US$ 1,358.26 billion (2013)
GDP growth: -1.2% (2013)
Inflation consumer price: 1.4% (2013) Income level: High
PT MA DZ FR AD Balearic Sea Alboran Sea Atlantic Ocean Marbella Algeciras Granada Toledo Parla Fuenlabrada Almería Córdoba Jaén Dos Hermanas Albecete Murcia Valencia Málaga Cádiz Getafe Móstoles Alcorcon Leganés Spain Salamanca Valladolid Burgos Ourense Zaragoza Pamplona San Sebastián
Reus BarcelonaBadalona Terrassa Sabadell L’Hospitalet Santa Coloma de Gramenet León
OviedoGijón Santander Bilbao Barakaldo Badajoz Seville Huelva Ceuta GBT Melilla Canary Islands Balearic Islands Mataró Madrid Castellón de la Plana Elche Alicante Cartagena Logroño Vitoria-Gasteiz Tarragona Lleida Alcobendas A Coruña Torrejón de Ardoz Alcalá de Henares
13
The factbook on the illicit trade in tobacco products
SP
AIN
WHY FOCUS ON THE ITTP IN SPAIN?
There are several reasons for studying the ITTP in Spain.
First, Spain’s geographical position makes it a transit
country for illicit tobacco. Indeed, due to its location on the Mediterranean Sea, and considering the lower price of cigarettes in comparison with other European countries,
Spain is an important gateway for the illicit tobacco trade bound for Northern European countries.
Second, Spain borders on countries such as Gibraltar
and Andorra, where cigarettes are significantly cheaper.
Moreover, the Spanish Canary Islands have a different
taxation regime on tobacco products, resulting in cheaper tobacco products. These issues together have an impact on cross-border purchases of tobacco products and consequently on the ITTP from these countries/areas to Spain’s mainland.
Third, the ITTP in Spain has a regional concentration.
Indeed, the highest share of non-domestic cigarettes was found in the regions on Andalusia and Extremadura.
Fourth, the social acceptance and tolerance of
cigarettes smuggling, a severe economic situation and
the reduced purchasing power of Spaniards have a
significant impact on the ITTP.
According to the available estimates, the ITTP in
Spain ranged between 7.5%, 8.2% and 10.3% in 2012
(KPMG 2013; Euromonitor International 2013a; Ipsos 2013). In 2013, according to KPMG data, the percentage
increased to 8.8% (KPMG 2014). Thinkcom provides two other estimates for 2013, reporting a lower bound ITTP penetration (10.23%) and an upper bound (11.75%)
(ThinkCom 2013).
Tobacco is a dual market consisting of a legal and an illegal part (Figure 2). The two sides of the market are
connected with each other. Actions affecting one side of the market influence the other side as well.
Figure 2. The dual tobacco market
Legal Market
Illegal Market
Overlap in
demand
The ITTP comprises different activities and products:
Smuggling (or contraband): the unlawful movement or transportation of tobacco products from one tax jurisdiction to another without the payment of applicable taxes or in breach of laws prohibiting their import or export (Joossens and Raw 2008).
14
Counterfeiting: the illegal manufacturing of a product bearing or imitating a trademark without the owner’s consent. Illegally manufactured products can be sold in the source country or smuggled into another country (Joossens and Raw 2008).
Bootlegging: the legal purchase of tobacco products in a low-tax country and their illegal retail in a high-tax country. Bootlegging concerns individuals or small groups who smuggle smaller quantities of cigarettes, taking advantage of tax differentials, with the aim of making extra income (Hornsby and Hobbs 2007).
Illegal manufacturing: cigarettes manufactured
for consumption, which are not declared to the tax authorities. These cigarettes are sold without tax and may be manufactured in approved factories or illegal covert operations (Joossens et al. 2010).
Unbranded tobacco: manufactured, semi-manufactured
and even loose leaves of tobacco (also known as ‘chop-chop’ (Geis 2005)), illegally sold by weight (e.g. in large plastic bags, also known as ‘baggies’), with no labelling or health warnings and consumed in roll-your-own cigarettes or in empty cigarette tubes (Walsh, Paul, and Stojanovski 2006).
Cheap Whites or Illicit Whites: cigarettes produced legally in one country, but normally intended for smuggling into countries where there is no prior legal market for them. Taxes in production countries are normally paid, while they are avoided/evaded in destination countries (Allen 2011).
WHAT CAN BE FOUND IN THIS
REPORT?
This report is organised into three chapters.
Chapter 1 is composed of five subsections analysing the five drivers of the ITTP:
1) Society and economy 2) Legal market
3) Regulation 4) Crime environment 5) Enforcement
The drivers are important areas whose structures may influence the ITTP positively or negatively. Transcrime selected the drivers based on a review of the literature on the ITTP and discussions with relevant stakeholders and experts. Each subsection provides information on the key aspects of each driver.
To enable comparison with other country profiles, each driver has four indicators. The data for the drivers’ indicators come from different sources and ensure comparability among different countries in regard to the last available years (e.g. World Bank, WHO, UN). When possible, the report provides the most up-to-date data from national sources. For four indicators, Transcrime has developed composite indicators (see Regulation and Enforcement, pp. 33 and 47). Composite indicators assess the presence of specific policy measures in the country and range from 0 (no measure is present) to 5 (all measures are present). A higher value on the composite indicators does not always imply a better situation. The purpose of such indicators is rather to assess the intensity of policy measures in a specific field. The information used for the assessment is drawn from the literature, official sources (reports, websites, legislation), and experts.
Chapter 2 analyses the illicit trade in Spain, dividing it
into the four components of the ITTP:
1) Demand 2) Supply 3) Products
4) Modus operandi and geographical distribution.
Chapter 3 combines the results of the two previous
chapters to identify the four key factors of the ITTP and
show how the various elements of the drivers influence the illicit trade. The four key factors are the following: 1) Economic accessibility
2) Availability 3) Profitability 4) Risk.
These factors are pivotal for demonstrating how the various elements of each driver influence the illicit trade.
15
The factbook on the illicit trade in tobacco products
SP
AIN
Chapter 1
17
The factbook on the illicit trade in tobacco products
SP
AIN
SOCIETY AND ECONOMY
S
pain has been hit hard by the global financial
crisis. The unemployment rate has increased while
both GDP per capita and household consumption have
decreased. The Spanish Government is currently been
aided by the EU and international organisations to
accelerate its economic recovery. Health and education
expenditures are below the EU average and income
inequality is among the highest among EU member
states.
Low %
18
Society and Economy
0.32
13 out of 34 countries
(late 2000s)
Income Inequality
GINI coefficient after taxes
Source: OECD
Education System
Education expenditure
as % of GDP
Source: The World Bank
4.5%
28 out of 163 countries
(2011)
13.8%
49 out of 213 countries
(2010)
Unemployment
Total unemployment
rate (% of labour force)
Source: OECD
25.2%
1 out of 35 countries
(2012)
Adult Population
Population aged 15+
Source: The World Bank
84.8%
26
out of 225 countries
(2012)
Migration
International migrant stock
as % of population
Source: The World Bank
High % Low % High Low High % Low % High % Low % High % Low %
Last national available data (2013):
26.4%
(INE 2014)
3.2 2008 -61,843 -89,331 -90,805 -82,734-75,357 -53,978-49,277 2006 2007 2008 2009 2010 2011 2012 4.4 2010 0.32 0.32 mid-2000s late-2000s 10.6 13.8 2005 2010 32 32 2006 2009 1.2 1.1 1.1 0.9 0.9 0.8 0.8 2005 2006 2007 2008 2009 2010 2011 22.4 22.4 22.5 22.4 22.4 22.2 2002 2003 2004 2005 2006 2007 9.9 9.7 9.9 9.8 9.9 10.2 10.5 2005 2006 2007 2008 2009 2010 2011 0.3 0.1 2.3 2.7 10.6 9.6 2013 2013Opioids Cocaine Cannabis
77.4
2008 2010 124.1
78.3 172.5
Tax % final retail price Tax per 1,000 sticks/Int.$, PPP 93,084 93,241 94,42285,961 76,400 63,577 52,391 2006 2007 2008 2009 2010 2011 2012 9.2 2005 8.6 2006 8.3 2007 18.1 2009 20.2 2010 11.4 21.825.2 2008 2011 2012 3.7 3.5 3.8 4.3 4.4 4.5 4.3 2005 2006 2007 2008 2009 2010 2011 6.5 6.1 6.1 6.2 65 59 28 32 30 31 40 30 2008 2009 2010 2011 2012 2013 Value Rank 85.5 85.5 85.3 85.2 85.0 84.9 84.8 2005 2006 2007 2008 2009 2010 2011 2012 85.4 365.5 349.4 340.9 330.2 2005 2006 387.4 2007 389.9 2008 2009 2010 2011 378.5 798.5 -61,843 -89,331 -90,805 -82,734-75,357 -53,978-49,277 2006 2007 2008 2009 2010 2011 2012 0.32 0.32 mid-2000s late-2000s 10.6 13.8 2005 2010 32 32 2006 2009 1.2 1.1 1.1 0.9 0.9 0.8 0.8 2005 2006 2007 2008 2009 2010 2011 22.4 22.4 22.5 22.4 22.4 22.2 77.4 2008 2010 124.1 78.3 172.5
Tax % final retail price Tax per 1,000 sticks/Int.$, PPP 4.5 2011 84.9 84.8 011 2012 3.2 2008 -61,843 -89,331 -90,805 -82,734-75,357 -53,978-49,277 2006 2007 2008 2009 2010 2011 2012 4.4 2010 0.32 0.32 mid-2000s late-2000s 10.6 13.8 2005 2010 32 32 2006 2009 1.2 1.1 1.1 0.9 0.9 0.8 0.8 2005 2006 2007 2008 2009 2010 2011 77.4 2008 2010 124.1 78.3 172.5
Tax % final retail price Tax per 1,000 sticks/Int.$, PPP 93,084 93,241 94,42285,961 76,400 63,577 52,391 2006 2007 2008 2009 2010 2011 2012 9.2 2005 8.6 2006 8.3 2007 18.1 2009 20.2 2010 11.4 21.825.2 2008 2011 2012 3.7 3.5 3.8 4.3 4.4 4.5 4.3 2005 2006 2007 2008 2009 2010 2011 6.5 6.1 6.1 6.2 65 59 28 32 30 31 40 30 2008 2009 2010 2011 2012 2013 Value Rank 85.5 85.5 85.3 85.2 85.0 84.9 84.8 2005 2006 2007 2008 2009 2010 2011 2012 85.4 -61,843 -89,331 -90,805 -82,734-75,357 -53,978-49,277 2006 2007 2008 2009 2010 2011 2012 0.32 0.32 mid-2000s late-2000s 10.6 13.8 2005 2010 32 32 2006 2009 77.4 124.1 78.3 172.5 7 52,391 1 2012 21.825.2 011 2012 4.4 4.3 4.5 09 2010 2011 85.2 85.0 84.9 84.8 09 2010 2011 2012 -61,843 -89,331 -90,805 -82,734-75,357 -53,978-4 2006 2007 2008 2009 2010 2011 0.32 0.32 mid-2000s late-2000s 10.6 13.8 2005 2010 32 32 2006 2009 93,084 93,241 94,42285,961 76,400 63,577 52,391 2006 2007 2008 2009 2010 2011 2012 9.2 2005 8.6 2006 8.3 2007 18.1 2009 20.2 2010 11.4 21.825.2 2008 2011 2012 3.7 3.5 3.8 4.3 4.4 4.5 4.3 2005 2006 2007 2008 2009 2010 2011 85.5 85.5 85.3 85.2 85.0 84.9 84.8 2005 2006 2007 2008 2009 2010 2011 2012 85.4
19
The factbook on the illicit trade in tobacco products
SP
AIN
Chapter 1: The Five Drivers
•• Spain is a developed country with a large percentage of adults in the population.
• Spain is composed of 17 autonomous communities including the Balearic Islands and the Canary Islands, two autonomous cities (Ceuta and Melilla) and three small Spanish possessions off the coast of Morocco (Chafarinas Islands, Peñon de Alhucemas, and Peñón de Vélez de la Gomera) (CIA 2012a).
• The Spanish Human Development Index was
0.885 in 2012 and the country ranked 23rd out of 186 countries (UNDP 2013).
• Spain has a population of 46.22 mn inhabitants
and it has a high percentage of adults in the total population. In 2012, Spain ranked 26th out of 225 countries, with 84.8% of its population aged over 15 (The World Bank 2012).
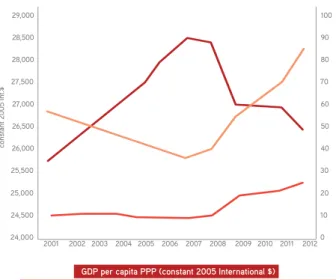
•• Spain has been hit hard by the global financial crisis. Since 2007, GDP per capita has decreased, while general public debt has increased
considerably (Figure 3).
• Before the crisis, the GDP per capita was rising in Spain. After almost 15 years of GDP per capita
increases, the Spanish economy began to slow down in late 2007 and entered into a recession in 2008 (CIA 2012a).
• The economy has undergone a prolonged recession
since the outbreak of the economic financial crisis in 2008. The burst of the housing bubble and structural
weaknesses, especially in the labour market, have been compounded by the European debt crisis (OECD 2012c).
• The average Spanish household has been severely affected by the crisis, with visible impacts on
household income, jobs, life satisfaction and civic engagement. Between 2007 and 2011, the
real household disposable income declined by 5%, which was one of the largest declines among the
OECD countries (OECD 2013a).
• In Spain, public debt as a percentage of GDP is
high, 84.10% in 2012. In Europe, only Greece, Italy,
Portugal, Ireland, Belgium and France have higher public debts. On a global level, Spain’s public debt is high and the country ranks 26th out of 155
countries (CIA 2012a).
• According to the Sociological investigation
‘Barometer’ of January 2014, in Spaniards’ opinion, unemployment is the main problem affecting the country (54.4% respondents). The second major
problem concerns corruption and fraud (18.3%) (CIS 2014).
• People’s trust in institutions and in how democracy
works has also declined during the crisis. The
percentage of Spanish people reporting that they trust the government fell from 48% to 34% between
2007 and 2012 (OECD 2013a).
Figure 3. GDP per capita PPP (constant 2005 International $), general government gross debt (as % of GDP), unemployment rate (persons aged +15), 2001-2012
Source: Transcrime elaboration on World Bank (2012) and Eurostat (2013) data
•• The adoption of international economic measures is aimed at helping the Spanish economy.
• In June 2012, a Memorandum of Understanding set out the conditions for the Spanish government to receive $130 bn in EU funds to recapitalise its banks and the real estate sector (CIA 2012a). The European Commission, the European Central Bank and
the International Monetary Fund are in charge of
monitoring the progress made within the framework of this recapitalisation (OECD 2012c).
100 90 80 70 60 50 40 30 20 10 0 2012 2011 2010 2009 2008 2007 2006 2005 2004 2003 2002 2001 29,000 28,500 28,000 27,500 27,000 26,500 26,000 25,500 25,000 24,500 24,000 % constant 2005 Int.$
General Government Gross Debt (% GDP) Unemployment rate (persons aged +15)
20
•• The global financial crisis has significantly affected unemployment (Figure 4).
• Spain has a very high unemployment rate. In 2012,
25.2% of the labour force was unemployed and Spain had the highest unemployment rate among 35 OECD countries (OECD 2012a). The unemployment
rate reached 26.3% in 2013 (OECD 2013b).
• In Spain, half the female labour force is
unemployed. In 2013, female unemployment reached
55%, increasing by around 3 p.p. from the previous year (51.9%) (OECD 2013b).
• The largest impacts of the crisis on people’s wellbeing consist in lower employment and deteriorating labour market conditions. Between 2007 and 2012,
the employment rate decreased by more than 10 p.p. in Spain, while the long-term unemployment rate increased by 9 p.p. (OECD 2013a).
• During the economic crisis, youth unemployment
has risen by 30 p.p., while it has grown by 12 p.p. for adult workers. This is mainly due to the high prevalence among young people of temporary contracts. The increase in youth unemployment in
Spain is the highest among OECD countries (OECD 2012c).
Figure 4. Unemployment rate in Spain, people aged +15, 2000-2013
Source: Transcrime elaboration on OECD (2013) data
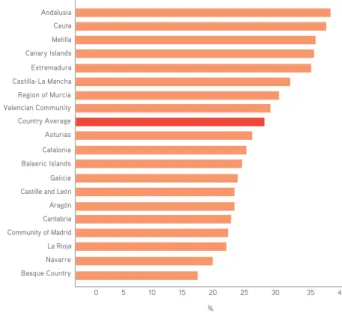
•• On the Spanish mainland, the regions with the highest unemployment rates are the southern regions of Andalusia and Extremadura (Figure 5).
• While the national unemployment rate in 2013 was 26.4%, Andalusia and Extremadura recorded the
highest unemployment rates with 36.3% and 33.7%
respectively (INE 2014a).
Figure 5. Unemployment rate in Spanish administrative regions (including Ceuta, Melilla, the Balearic and Canary Islands), 2013
Source: Transcrime elaboration on INE (2014a) data
•• After 14 years of successive increases in household consumption expenditure (1993-2007), since 2007 final household consumption expenditure has been decreasing (Figure 6, p. 21) (The World Bank 2012).
• Household expenditure grew until 2007. Between 2007 and 2012, it decreased by about 10.6% (The World Bank 2012). The largest decrease in household final consumption expenditure occurred in 2009, when
it decreased by 4.5% in comparison with 2008 (The
World Bank 2012).
• In 2011, most of household consumption concerned ‘Housing, water, electricity, gas and other fuels’ (21.5%), ‘Hotels, bars and restaurants’ (18.6%) and ‘Food and non-alcoholic beverages’ (14.6%). Since 2007, household final consumption expenditure has decreased in several categories. Between 2010 and 2011, the categories with the largest decreases were ‘Alcoholic beverages, narcotics and tobacco’ and
‘transport’ (-9.6% and -5.5% respectively) (INE 2013).
Female Male Total 2013 2012 2011 2010 2009 2008 2007 2006 2005 2004 2003 2002 2001 2000 60 50 40 30 20 10 0 % 0 5 10 15 20 25 30 35 40 Andalusia Canary Islands Castilla-La Mancha Valencian Community Asturias Balaeric Islands Ceuta Melilla Extremadura Region of Murcia Country Average Catalonia Galicia Aragón Community of Madrid La Rioja Basque Country Castille and León
Cantabria
Navarre
%
21
The factbook on the illicit trade in tobacco products
SP
AIN
Figure 6. Household final consumption expenditure (constant 2005 US$), 1994-2012
Source: Source: Transcrime elaboration on the World Bank (2012) data
•• As regards equality in the distribution of family income, Spain ranks 104th out of 136 countries
for income inequality (CIA 2012b). Among OECD countries, the country ranks 13th out of
34 countries. Together with the UK and Italy, which
record higher income inequality, Spain is the least equal among EU member states (OECD 2013b).
• In 2012, around 22.2% of Spanish people were at
risk of poverty. This figure has remained stable since
2011. However it has increased in the last decade. Indeed, the percentage of people at risk of poverty in 2003 was 19.0% (The World Bank 2012).
• The regions on mainland Spain with the largest risk of poverty are Extremadura (34.1%), Castilla-La Mancha (33.1%) and Andalusia (31.0%).
Considering the non-peninsular territory of Spain, Melilla, Ceuta and the Canary Islands are at high risk of poverty, 36.6%, 36.2% and 33.2% of the population respectively (INE 2012a).
•• Health and education expenditures are average on a global level, but below the EU average.
• Spain ranked 28th out of 163 countries in 2011
for education expenditure (4.5% of GDP in 2011).
This figure has increased steadily, rising from 3.7% in 2005 to 4.5% of GDP in 2011. The level of education expenditure is above the global average (3.0%), but below the EU average of 4.9% (The World Bank 2012).
• In 2011, total health expenditure was 9.44% of GDP. This figure is below the EU average of 10.14%
of GDP, but above the global average of 6.9% of GDP. Per capita government expenditure on health was US$3,027 in 2011 (The World Bank 2012).
• In 2011, life expectancy at birth was 82 years,
above the European average (79.0) (The World Bank 2012). During the same year, life expectancy was the lowest in Andalusia and Melilla (80.8 and 80.4 years respectively), and the highest in the Community of Madrid (83.7 years) (INE 2013).
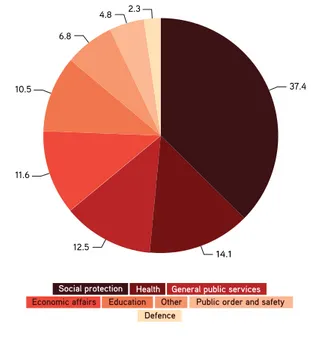
• In 2011, the largest share of government
expenditure was on social protection (37.4%), health
(14.1%) and general public services (12.5%) (Figure 7) (OECD 2013c).
Figure 7. Composition of total public spending, % of total government spending 2011
Source: Transcrime elaboration on OECD (2013c) data
•• Spain has a large and increasing migrant population.
• As regards migration stock, Spain ranked 49th
out of 213 countries in 2010, when the migrant population was 13.8% (The World Bank 2012).
This is a significant increase in comparison with 2005, when the migration stock was 10.6% of the population. 1994 1995 1996 1997 1998 1999 2000 2001 2002 2003 2004 2005 2006 2007 2008 2009 2010 2011 2012 18,000 16,000 14,000 12,000 10,000 8,000 6,000 4,000 2,000 0 constant 2005 US$ Defence
Public order and safety Other
Education Economic affairs
General public services Health Social protection 12.5 11.6 10.5 6.8 4.8 2.3 37.4 14.1
22
• In 2011, 86.5% of the population was Spanish, 13.5% was born abroad. In particular, foreigners were mainly from Latin America (5.0%), other EU member states (4.6%) and Africa (2.3%) (INE 2013).
• In 2012, the administrative regions or autonomous communities with the highest share of foreigners
were the Balearic Islands (21.7% of the population), the Valencian Community (17.2%), the Region of Murcia (16.2%), Catalonia (15.7%) and the Community of Madrid (15.6%) (INE 2013).
International organisations and the EU are supporting the Spanish government in recapitalising its financial sector and boosting the economic recovery. Indeed, since the beginning of the global financial crisis,
unemployment has been increasing, while GDP per capita and consumption expenditure have decreased. Health and education expenditure are below the EU average and income inequality is among the highest among EU member states.
23
The factbook on the illicit trade in tobacco products
SP
AIN
T
he Spanish tobacco market is relatively large
on a global scale and tobacco imports have always
exceeded exports. In the past decade domestic sales
of cigarettes have fallen, while HRT has grown
significantly. Cigarette prices are high in global terms,
but cigarettes are relatively affordable. Smoking
prevalence is high and varies among Spanish regions.
2.6%
100 out of 168 countries
(2010)
Market Size
Cigarette retail volume
(mn sticks)
Source: Euromonitor International
2,702
92 out of 209 countries
(2012)
13,661
11 out of 72 countries
(2012)
Balance of Trade
Cigarette exports–imports
(mn sticks)
Source: Euromonitor International
Price
Price of a pack of
the most sold brand
(Int.$, PPP)
Source: WHOInt.$, PPP 4.55
40 out of 166 countries
(2010)
Smokers
Current smoking of
any tobacco product
(age–standardised rate)
Source: WHO–Country reports
36%
15 out of 147 countries
(2009)
Low High Large Small High Low Positive NegativeLast available data (2012): 2.0%
(Euromonitor International 2012, International Monetary Fund 2012)Last available data (2012): Int.$, PPP 4.81
(Euromonitor International 2012, International Monetary Fund 2012)High %
Low %
Affordability
% of annual per capita
income needed to buy
100 packs of the cheapest
cigarettes
Source: Tobacco Atlas
24
Last available data (2012): Daily smokers
33%
(male),
13%
(female)
(Lithuanian statistics department 2013)Legal Market
1.5%
135 out of 168 countries
(2010)
Affordability
% of annual per capita income
needed to buy 100 packs of the
cheapest cigarettes
Source: Tobacco Atlas
Market Size
Cigarette retail volume
(mn sticks)
Source: Euromonitor International
52,391
18 out of 209 countries
(2012)
-49,277
70 out of 72 countries
(2012)
Balance of Trade
Cigarette exports–imports
(mn sticks)
Source: Euromonitor International
Price
Price of a pack of
the most sold brand
(Int.$, PPP)
Source: WHOInt.$, PPP 4.4
42 out of 166 countries
(2010)
Smokers
Current smoking of
any tobacco product
(age–standardised rate)
Source: WHO–Country reports
32%
24 out of 147 countries
(2009)
Low High Large Small High Low Positive NegativeLast national available data (2012):
22.8%
(Euromonitor International 2013)Last available data (2012):
1.7%
(Euromonitor International 2012, International Monetary Fund 2012)Last available data (2012):
Int.$ 5.56
(WHO Wold Tobacco Epidemic 2013)High % Low % -61,843 -89,331 -90,805 -82,734-75,357 -53,978-49,277 2006 2007 2008 2009 2010 2011 2012 mid-2000s late-2000s 10.6 13.8 2005 2010 32 32 2006 2009 1.2 1.1 1.1 0.9 0.9 0.8 0.8 2005 2006 2007 2008 2009 2010 2011 22.4 22.4 22.5 22.4 22.4 22.2 2002 2003 2004 2005 2006 2007 9.9 9.7 9.9 9.8 9.9 10.2 10.5 2005 2006 2007 2008 2009 2010 2011 10.6 9.6 013 Cannabis 77.4 2008 2010 124.1 78.3 172.5
Tax % final retail price Tax per 1,000 sticks/Int.$, PPP 3,577 52,391 2011 2012 20.2 0 21.825.2 2011 2012 4.4 4.3 4.5 2009 2010 2011 59 65 40 30 2012 2013 ank 2009 2010 2011 2012 387.4 389.9 2009 2010 2011 78.5 594.7 377.7 348.0 0 2011 2012 3.2 2008 -61,843 -89,331 -90,805 -82,734-75,35 2006 2007 2008 2009 2010 4.4 2010 0.32 0 mid-2000s late-2 10.6 13.8 2005 2010 32 32 2006 2009 1.2 1.1 1.1 0.9 0.9 2005 2006 2007 2008 200 22.4 22.4 22.5 22.4 22.4 22.2 2002 2003 2004 2005 2006 2007 9.9 9.7 9.9 9.8 9.9 10.2 10.5 2005 2006 2007 2008 2009 2010 2011 0.3 0.1 2.3 2.7 10.6 9.6 2013 2013
Opioids Cocaine Cannabis
77.4
2008 2010 124.1
78.3 172.5
Tax % final retail price Tax per 1,000 sticks/Int.$, PPP 93,084 93,241 94,42285,961 76,400 63,577 52,391 2006 2007 2008 2009 2010 2011 2012 9.2 2005 8.6 2006 8.3 2007 18.1 2009 20.2 2010 11.4 21.825.2 2008 2011 2012 3.7 3.5 3.8 4.3 4.4 4.5 4.3 2005 2006 2007 2008 2009 2010 2011 6.5 6.1 6.1 6.2 65 59 28 32 30 31 40 30 2008 2009 2010 2011 2012 2013 Value Rank 85.5 85.5 85.3 85.2 85.0 84.9 84.8 2005 2006 2007 2008 2009 2010 2011 2012 85.4 365.5 349.4 340.9 330.2 2005 2006 387.4 2007 389.9 2008 2009 2010 2011 378.5 -61,843 -89,331 -90,805 -82,734-75,357 -53,978-49,277 2006 2007 2008 2009 2010 2011 2012 0.32 0.32 mid-2000s late-2000s 10.6 13.8 2005 2010 32 32 2006 2009 1.2 1.1 1.1 0.9 0.9 0.8 0.8 2005 2006 2007 2008 2009 2010 2011 22.4 22.4 22.5 22.4 22.4 22.2 9.6 77.4 2008 2010 124.1 78.3 172.5
Tax % final retail price Tax per 1,000 sticks/Int.$, PPP 7 52,391 2012 21.825.2 11 2012 4.4 4.3 4.5 9 2010 2011 59 40 30 12 2013 85.2 85.0 84.9 84.8 09 2010 2011 2012 3.2 2008 -61,843 -89,331 -90,805 -82,73 2006 2007 2008 2009 4.4 2010 0.32 mid-2000s 10.6 13.8 2005 2010 32 32 2006 2009 1.2 1.1 1.1 0.9 2005 2006 2007 200 77.4 2008 2010 124.1 78.3 172.5
Tax % final retail price Tax per 1,000 sticks/Int.$, PPP 93,084 93,241 94,42285,961 76,400 63,577 52,391 2006 2007 2008 2009 2010 2011 2012 9.2 2005 8.6 2006 8.3 2007 18.1 2009 20.2 2010 11.4 21.825.2 2008 2011 2012 3.7 3.5 3.8 4.3 4.4 4.5 4.3 2005 2006 2007 2008 2009 2010 2011 6.5 6.1 6.1 6.2 65 59 28 32 30 31 40 30 2008 2009 2010 2011 2012 2013 Value Rank 85.5 85.5 85.3 85.2 85.0 84.9 84.8 2005 2006 2007 2008 2009 2010 2011 2012 85.4
25
The factbook on the illicit trade in tobacco products
SP
AIN
TOBACCO MARKET
•• The Spanish tobacco market on Spain’s mainland, the Balearic Islands, Ceuta and Melilla, has rules and a taxation regime different from the tobacco market in the Canary Islands.
• According to Law 13/1998, the retail of tobacco products on the Spanish mainland, the Balearic Islands, Ceuta and Melilla is under the Spanish state’s monopoly and is subject to an homogenous taxation regime. Instead, the retail of tobacco products in the Canary Islands is not under the Spanish monopoly and has a different taxation regime (CMT 2014a).
•• Spain has been a traditional producer of tobacco products (Figure 8). In 2011, it was the fifth producer of raw tobacco in the European Union (14% of European production) (European Commission 2011a).
• Since 2007, after the implementation of the reform of the CAP (Common Agricultural Policy) at the European level, tobacco production in Spain has declined due to the decrease in financial support for
the sector (Euromonitor International 2012).
• Production in Spain fell from 40,171 tonnes of raw tobacco produced (11.6% of European tobacco production) in 2006, to 29,275 tonnes in 2011 (14% of European production). The number of workers in the tobacco industry in Spain was 5,200 in 2012.
The number increased by 7.8 % in comparison with 2011, when it was 4,825 (Ministerio de Agricultura 2013).
• The cultivation of tobacco traditionally occurred in the southern regions of Extremadura and Andalusia. In 2011, 93% of the production of tobacco
occurred in Extremadura. The other regions had minor shares (between 0.1% and 5.8%) (Ministerio de Agricultura 2013).
Figure 8. Cigarette production, imports, exports and sales in mn cigarettes, 2002-2012
Source: Transcrime elaboration on Euromonitor International (2013a) data
•• In Spain, tobacco imports have always exceeded exports.
• Spain is one of the largest importers of tobacco products. Indeed, it has a negative balance of trade
and ranks 70th out of 72 countries. In 2012, the country exported around 973 mn cigarettes while it imported around 50,000 mn cigarettes. Since 2007, cigarette imports volumes have been in line with cigarette sales volumes (Figure 8) (Euromonitor International 2013a).
•• Tobacco sales have strongly decreased since 2008, with differences among regions.
• The Spanish tobacco market experienced a strong decrease in sales, falling from 97.1 bn cigarettes
in 2002 to 52.4 bn in 2012 (-46%). This reduction may be related to the economic crisis and to higher unemployment, but also to tobacco control measures such as the introduction of a Minimum Excise Tax on cigarettes and HRT in 2006 and 2009 respectively (see Regulation, p.33) (Euromonitor International 2012; 2013a).
• Cigarettes sales again decreased in 2013, reaching 47.5 bn cigarettes (-11% compared to 2012) (CMT 2014b). Indeed, 91% of tobacconists confirmed that their sales dropped by an average of 38% between 2012 and 2013 and they expected that sales
would continue to fall in 2014 (Millward Brown 2013).
• The decrease in cigarettes sales differs across Spanish regions (Figure 9, p.26). Indeed, the highest
decrease between 2008 and 2013 was recorded in Andalusia (-56.5%), Valencian Community
(-49.9%), the Balearic Islands (-49.6%) and Catalonia (-48.1%) (CMT 2014b). 100,000 2002 2003 2004 2005 2006 2007 2008 2009 2010 2011 2012 120,000 80,000 40,000 60,000 20,000 0 mn sticks Sales Export Import Production Chapter 1: The Five Drivers
26
•• The Spanish tobacco market is large in terms of retail volume on a global scale. Cigarettes have the largest share of the market (Euromonitor International 2013a).
• In 2012, the sales of tobacco products reached a value of €11.9 bn. The volume of the Spanish market was 52.4 bn sticks in the same year. The Spanish market is large in terms of volume of sales on a global scale (18th out of 209 countries)
(Euromonitor International 2013a).
•• Cigarettes are the most popular tobacco product, although the HRT share is increasing (Figure 10 and Figure 11, p.27).
• Cigarettes constituted almost 85% of the Spanish tobacco market in 2012. HRT is the second most
popular product, with a share of 10.2%; cigars have a 3.4% share. Moreover, pipe tobacco has a 1.4% share of the market (Euromonitor International 2013a).
• The share of HRT has increased in the past ten years, from 1.2%, to 10.2% in 2012. Conversely, the share of cigarettes has decreased from 97.5% to 85% in the same period. Cigars sales have also
increased in the past decade, mainly due to the growth of cigarillos consumption (favoured by a lower taxation) which has compensated for the decrease in cigars (from 1% to 3.4%) (Euromonitor International 2013a). Sales, % change 2008-2013 More than -56.5% From -48.1% to -56.4% From -43.7% to -48.0% From -40.1% to -43.6% PT MA DZ FR AD Andalusia Castilla-La Mancha Madrid Galicia Asturias Cantabria Basque Country Navarre Aragon Catalonia La Rioja Castile and Leon
Murcia Ceuta Melilla Balearic Islands Balearic Sea Alboran Sea Atlantic Ocean Canary Islands GBT Extremadura Valencian Community Figure 9. Cigarette sales per region, % change 2008-2013
Source: Transcrime elaboration on CMT (2014b) data
27
The factbook on the illicit trade in tobacco products
SP
AIN
Figure 10. Cigarettes, HRT, cigars and pipe tobacco volume shares, 2012
Source: Transcrime elaboration on Euromonitor International (2013) data
Figure 11. Cigarettes, HRT, cigars and pipe tobacco volume shares, 2002-2012
Source: Transcrime elaboration on Euromonitor International (2013) data
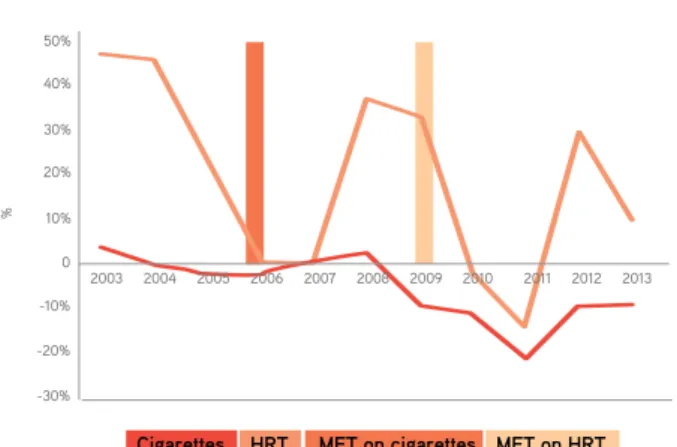
•• Cigarette sales have decreased by 46% in the past ten years (2002-2012) in Spain; conversely HRT sales have registered a 410% growth (Euromonitor International 2013a).
• The volume of cigarettes sales has decreased in the past decade (-46% between 2002 and 2012),
from 97.1 bn sticks in 2002 to 52.4 bn sticks in 2012 (Figure 12). The sharpest decrease was recorded between 2009 and 2010 (-11%) (Euromonitor International 2013a).
• The volume of HRT sales has increased (+410%
between 2002 and 2012), from 1,236 tonnes in 2002, to 6,307 in 2012. The sharpest increase, +45.8%, occurred between 2002 and 2003 (Figure 12) (Euromonitor International 2013a).
•• The introduction of a Minimum Excise Tax (MET) on cigarettes in 2006, and its subsequent hikes, lifted the cigarettes price-bottom and compressed the prices distribution. It reduced possibilities for downtrading to cheaper cigarette brands, and instead stimulated the switch to HRT (see Regulation, p.33) (López-Nicolás, Cobacho, and Fernández 2013).
• HRT bore no minimum tax on quantity until 2009, and the level of this new tax has not closed the price gap between manufactured and hand-rolled cigarettes.
The availability of a cheaper alternative (HRT) in a period when cigarettes were becoming more expensive may have deterred price-sensitive smokers from quitting and persuaded them to switch to HRT (Figure 12) (López-Nicolás, Cobacho, and Fernández 2013).
Figure 12. Cigarettes and HRT annual growth (%), 2003-2013
Source: Transcrime elaboration on Euromonitor International (2003-2012) and CMT data (2013)
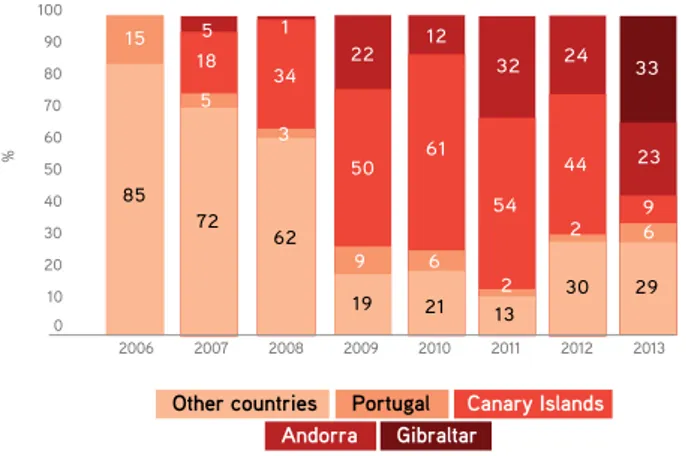
•• In 2013, the main source countries for legal non-domestic cigarettes were Gibraltar (33% of the legal non-domestic packs) and Andorra (23%) in 2012 (Figure 13, p.28, KPMG 2014).
• Andorra and the Canary Islands were major source countries of legal cigarettes between 2007 and 2012. In 2013, the share of the Canary Islands among legal non-domestic cigarettes declined, falling from 44% in 2012, to 9% in 2013. This decrease may be explained by the reduction in the number of packs that can be legally exported from the Canary Islands (2 cartons). Conversely, inflows from Gibraltar have increased. In 2013, Gibraltar accounted for a 33% share of legal non-domestic cigarettes in Spain (KPMG 2014). 85.0 10.2 1.4 3.4 Pipe tobacco Cigars HRT Cigarettes Pipe tobacco Cigars HRT Cigarettes 2002 2003 2004 2005 2006 2007 2008 2009 2010 2011 2012 100 90 80 70 60 % 50 40 30 20 10 0 11 12 96 95 93 90 88 86 98 97 96 96 96 1 4 1 3 1 3 1 3 3 1 16 2 3 7 1 27 1 3 10 MET on HRT HRT
Cigarettes MET on cigarettes
2003 2004 2005 2006 2007 2008 2009 2010 2011 2012 2013 50% 40% 30% 20% 10% 0 -10% -20% -30% %
28
Figure 13. Legal non–domestic packs by market of origin. Percentages of total non–domestic legal packs, 2006–2013
Source: Transcrime elaboration on KPMG 2014 data
•• Multinational companies lead the Spanish tobacco market (Euromonitor International 2012).
• The four major tobacco manufacturers accounted for 95.47% of cigarettes sales in 2013 (95.72% in 2012). (CMT 2014c). Other minor players were Grand River Enterprises (1.13% market share), HVL (1.12%), Von Eicken (1.01%), Karelia Tobacco Company (0.44%), Dos Santos (0.24%) and other companies (0.59%) (CMT 2014c).
• The Spanish subsidiary of Imperial Tobacco Group Plc, Altadis-Imperial, is the leading player in the Spanish tobacco market. Indeed, it has the largest
volume share in the cigarettes market (32% in 2013). The company also ranks first for the HRT segment, with a 27.76% volume share in December 2013 (CMT 2014c).
• In 2013, Philip Morris Spain SA ranked second in
cigarettes sales with 31.1% volume share., PMI’s
share in the HRT market, in December 2013, was 12.62% (CMT 2014c). The company was established in 1971 and, in 2007, it signed agreements with the Ministry of Agriculture and has increased its purchases of Spanish tobacco leaves (Euromonitor International 2013a; Philip Morris Spain 2014).
• JT International Iberia SL ranks third in cigarettes
with a 21.6% volume share in 2013. As for HRT, it
ranks second, with a 12.84% share in December 2013 (Euromonitor International 2013a).
• British American Tobacco España SA, founded in
1990, ranks fourth in cigarettes with a 10.75% volume share (yearly share for 2013) and fourth in HRT
with a 7.44% share in December 2013 (Euromonitor International 2013a).
•• Tobacconists and vending machines are the only legal distribution channels of tobacco products (Euromonitor International 2012).
• In Spain, there were 16,049 tobacconists in 2013.
They are distributed across the country according to the number of inhabitants per region. Indeed, five regions (Andalusia, Catalonia, Castile and León, Galicia and Valencian Community) comprise almost 60% of the Spanish retailers. In Andalusia there are 2,630 tobacconists (16.3% of the total), in Catalonia 1,953 (12.2%), in Castile and León 1,687 (10.5%), in Galicia 1,675 (10.4%) and in Valencian Community 1,491 (9.3%) (CMT 2013).
• According to a survey carried out in 2013, because of the strong reduction in cigarettes sales, 9.8% of tobacconists felt that their business was ‘hanging by a thread’ and 8.6% had ‘seriously considered closing their business’ (Millward Brown 2013). Tobacconists mainly attributed this decline to the illicit tobacco trade (86%), followed by the economic crisis (38%)
and the increase in tobacco prices (30%) (Figure 14). Only 3% of the tobacconists interviewed thought that tax increases negatively influenced cigarettes sales (Millward Brown 2013).
Figure 14. Tobacconists’ opinions on the decrease in cigarette sales, 2013
Source: Transcrime elaboration on Millward Brown (2013) data
5 18 5 12 61 6 22 50 9 9 6 2 29 30 33 23 44 24 32 54 2 13 21 19 1 34 3 62 72 85 15 2006 2007 2008 2009 2010 2011 2012 2013 % Canary Islands Portugal Gibraltar Andorra Other countries 100 90 80 70 60 50 40 30 20 10 0 100 90 80 70 60 50 40 30 20 10 0 Taxes/tax increases Anti-tobacco campaigns Buying HRT Purchase frequency has gone down
Electronic cigarettes Anti-tobacco laws Price increase Economic situation Contraband illicit tobacco
3 4 8 9 9 10 30 38 86 % Legal Market
29
The factbook on the illicit trade in tobacco products
SP
AIN
• The reduction in prevalence may be attributable to
smoking bans, price increases and the reduced purchasing power of the Spanish population
connected with the growing financial crisis in Spain (Euromonitor International 2012).
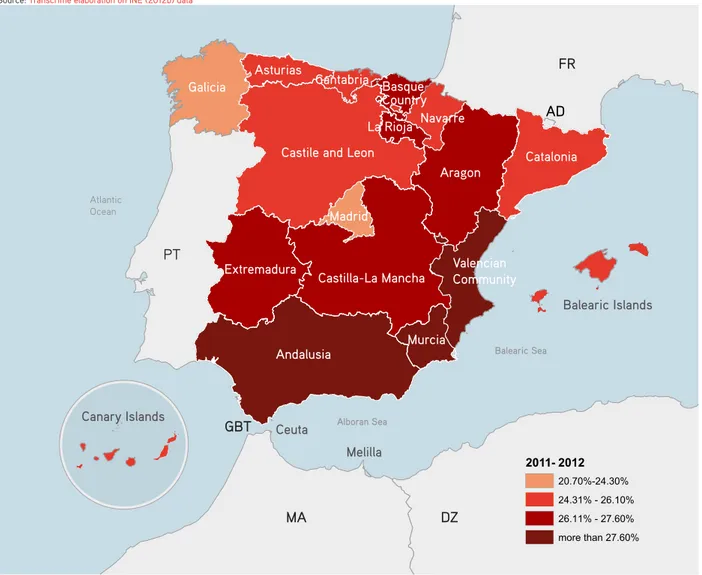
•• Smoking prevalence differs among Spanish regions (Figure 15).
• In 2011-2012, Andalusia was the region with the highest smoking prevalence (30.2%), followed by
the Valencian Community (30.1%) and Extremadura (27.6%). In the same years, the region with the lowest smoking prevalence was the Community of Madrid (24.1%) (INE 2012b).
TOBACCO CONSUMPTION
•• Smoking prevalence is high in Spain (Euromonitor International 2012).
• According to the WHO, in 2009 Spain had a smoking prevalence of 32%, the 24th highest among the 147 countries surveyed (WHO 2012). According to the Spanish nationwide health survey, the smoking prevalence in 2011-2012 was 26.9%. It had decreased by approximately 5 p.p. since 2003, when it was 31% (INE 2012b).
• According to other sources, smoking prevalence was 22.8% in 2012 (Daily smokers, +18) (Euromonitor International 2013a). During the last decade, the strongest reduction in cigarettes consumption was registered between 2002 and 2003, decreasing
from 31.7% of the adult population to 28.1% (Euromonitor International 2013a).
PT MA DZ FR AD Andalusia Extremadura Castilla-La Mancha Madrid Galicia Asturias Cantabria Basque Country Navarre Aragon Catalonia La Rioja Castile and Leon
Murcia Ceuta Canary Islands Valencian Community Balearic Islands Balearic Sea Alboran Sea Atlantic Ocean 2011- 2012 20.70%-24.30% 24.31% - 26.10% 26.11% - 27.60% more than 27.60% Melilla GBT
Figure 15. Smoking prevalence in 2011-2012 per region
Source: Transcrime elaboration on INE (2012b) data