UNIVERSITY OF PISA
PhD Course in
Molecular, Metabolic and Functional Exploration of Nervous and Sensory Systems
BIO/12 - Clinical Biochemistry and Clinical Molecular Biology
PhD Dissertation
Brain functional and structural reorganization induced by intensive training and exposition to extreme conditions:
a study on professional race-car drivers
Candidate Giulio Bernardi
Supervising Professor Prof. Pietro Pietrini
3
Table of Contents
Abstract ... 5
Preamble ... 8
Experiment I: functional correlates of visuo-spatial and motor processing ... 12
Introduction ... 12
Methods ... 13
Results ... 19
Discussion ... 26
Experiment II: functional correlates of (passive) race-car driving ... 30
Introduction ... 30
Methods ... 33
Results ... 37
Discussion ... 46
Structural correlates of expertise ... 51
Introduction ... 51 Methods ... 52 Results ... 53 Discussion ... 54 Conclusions ... 56 Acknowledgments ... 61 Bibliography ... 62
5
Abstract
The present work was designed to investigate the brain functional and structural correlates subserving top-level performances in highly skilled individuals. Specifically, we studied a particular class of elite athletes exposed to intensive psycho-physical trainings and extremely demanding conditions, namely Formula racing car drivers. As a matter of fact, these athletes ordinarily undergo intensive physical and mental trainings, and are exposed to extreme competitive conditions (e.g., accelerations 0-100 km/h in less than 2 seconds, top speeds up to 360 km/h, need for sustained attention and accurate sensorimotor control, etc.), and therefore represent an exceptional sample to study the brain correlates of skills acquisition.
In a first experiment, we used functional magnetic resonance imaging (fMRI) to measure brain activity while professional drivers and a matched group of ‘naïve’ volunteers performed two relatively simple visuo-motor tasks. Three different aspects have been examined to characterize the brain functional organization of these subjects: regional brain response, inter-regional interaction and blood oxygen level dependent (BOLD) signal variability. We demonstrated that, while behavioral performance levels were similar in the two samples, race-car drivers recruited to a smaller extent task-related areas, as compared to naïve drivers. Moreover, professional drivers showed reinforced connections among task-related areas and increased brain operative efficiency as reflected by a higher signal variability. The described results indicate that, during visuo-spatial and motor processing, professional drivers are characterized by distinctive functional correlates, with both ‘quantitative’ and ‘qualitative’ modifications, as compared to naïve drivers.
To further explore the brain functional organization developed as a consequence of expertise acquisition of a specific behavior, we designed a
6
second experiment during which ten professional race-car drivers and nine healthy naïve volunteers underwent fMRI scans while presented with four video-clips depicting a Formula One car racing on different official circuits. Analyses of functional brain response and inter-regional interaction revealed that professional drivers were characterized by a stronger recruitment of prefrontal and motor control devoted areas as compared to non-expert drivers. On the other hand, naïve drivers showed a robust response only in brain regions involved in visual information processing. As a matter of fact, previous studies demonstrated that passive observation of complex motor behaviors elicits a brain functional response that essentially overlaps with the one revealed during actual execution of the same activities, but only if the observer has acquired a certain degree of expertise in the specific task. In this perspective, our findings indicate that only professional drivers, that have been trained specifically in car racing, were able to effectively compare their motor repertoire with specific situations presented in a race-car driving task.
Finally, we investigated brain anatomical differences between expert and naïve drivers. Specifically, we measured and compared gray matter cortical thickness in the two groups, revealing that professional drivers are characterize by an increased gray matter volume in areas involved in visuo-spatial processing and motor control.
Overall, findings described in the present work indicate that skilled race-car drivers are characterized by distinctive functional and structural correlates as compared to ‘common’ individuals with an ordinary driving experience. We concluded that expertise acquisition is founded on a series of plastic changes that allow the storing of new motor and cognitive repertoires and the refinement of the existing ones. Specifically, we demonstrated the existence of at least three different potential markers of superior skills and expertise levels: an increased neural efficiency during relatively simple tasks in which experts show a higher degree of automaticity, a more distributed functional response
7
during passive observation of complex behavior in which only the professional group was specifically trained, and a greater cortical thickness in brain areas devoted to sensorimotor processing.
8
Preamble
To achieve exceptional levels of performance, such as in sport activities, likely requires a greater ability to process sensory information and to control motor functioning than ordinarily needed. In particular, so called ‘elite
athletes’ (also known as ‘sport experts’) usually have to cope with intensive
training programs and extremely demanding competitive conditions that can unquestionably influence both their physical and mental abilities.
In recent years, a growing number of studies explored the effect of expertise and skills acquisition [1, 2], or the consequences of exposure to extreme psychophysical conditions (e.g. [3]) on cerebral functional and structural correlates. Typically, functional studies investigating the consequence of practice, described different possible brain response modifications in areas involved in task execution [1, 4]. Specifically, it is usually possible to observe changes, either in extension or magnitude, of the regional neural response, with patterns of increased or decreased activity in task-related areas, or a combination of both. While a more general decrease in brain response is commonly interpreted as a sign of enhanced efficiency in regional resources utilization [1, 5], a functional reorganization indicates a reallocation of neuronal resources based on both an enhanced response in some task-relevant areas and on a decreased activity in cognitive control regions [4].
A reduction, or a reorganization, of the neural response has been reported in several experimental protocols using brain imaging [6-10] or electrophysiological evaluations [11-14] on various categories of experts and skilled individuals (e.g., musicians, golf players and archers). Interestingly, studies that investigated the effects of the acquisition of greater expertise and automaticity in a wide range of tasks, reported that functional changes in brain
9
response may also be accompanied by a modification in the way task-related regions interact. Specifically, approaches based on functional and effective connectivity analyses usually reveal a strengthening of the essential task-related couplings and/or a pruning of the ‘superfluous’ ones [1, 4, 15-20]. These observations led to the formulation of a ‘neural efficiency’ hypothesis, which postulates a more efficient cortical functioning based on both a reduced waste of resources and a qualitative improvement in information processing thanks to a better communication between task-related brain areas, in expert/skilled as compared to ‘ordinary’ individuals (e.g. [1, 21]). Consistently with this assumption, functional studies exploring age-related changes during distinct perceptual and cognitive tasks reported that older individuals often recruit a greater volume of brain cortical areas [22, 23], and show a reorganization of associated functional networks [24, 25], as compared to younger adults. Indeed, these modifications are commonly interpreted as an attempt of the brain to compensate for an age-related impairment in functional efficiency [26, 27].
On the other hand, a number of human studies that investigated the effect of practice and expertise reported an increment in extension and/or magnitude of brain response in certain, or even all, task-related brain areas [1]. The expansion of sensory and/or motor topographic representations, such as in the prototypical cases of the auditory and motor cortex of musicians [28, 29] are well-known examples of practice-related increased responses. However, other examples of strengthened brain activations in more experts or skilled individuals have been obtained using a variety of tasks and experimental conditions [1]. It has been hypothesized that the possibility of observing one scenario rather than the other, that is, a reduction/reorganization or an increase in functional response, may depend on a number of different factors, including task complexity, the specific task cognitive requirements, and the level of
10
expertise of the subjects [30, 31]. However, the functional mechanisms that can lead to one outcome or the other are not yet completely understood.
It is now clear that practice and expertise acquisition do not only affect the brain functional correlates, but can also lead to structural changes in brain gray and/or white matter. Learning and expertise are usually correlated with an increase in cortical thickness or gray matter volume in task-related regions, while pathological conditions have been associated with a ‘maladaptive
plasticity’, that is, a decrease (or less frequently, an increase) of the same
structural parameters in brain areas potentially involved in the development of neurologic or psychiatric disorders (i.e. [2, 32]). Using different methodologies, such as voxel-based morphometry (VBM) [33] or the analysis of cortical thickness [34], structural modifications have been identified in samples of highly skilled individuals, including musicians [35-37], jugglers [38], practiced Tetris players [39], medical students [40], fighter pilots [3] and golfers [41]. Results obtained by various animal and human studies support different mechanisms that may potentially mediate this sort of structural plasticity, including the formation of new neurons or glial cells, an increase of cell size, an increase in spine density or even an axonal growth in task related brain areas [2, 42]. Although their basis are still not completely understood, structural changes are commonly regarded as a potential signature of plasticity consequent to learning and expertise acquisition.
Given the above premises, aim of the present work was to investigate the plastic changes that take place in the human brain as a consequence of practice and expertise acquisition. In particular, elite athletes represent an exceptional sample to study the functional and structural correlates developed as a consequence of mental and physical trainings [6, 7, 10-14, 43-47]. In fact, these subjects undergo intensive training programs to maximize their motor abilities and have to cope with highly competitive and selective environments. In such conditions it is natural to expect that, together with physical abilities,
11
also cognitive skills would be potentiated, for example allowing faster or more accurate visuo-motor processing. Based on these premises, the current study enrolled a particular group of elite athletes, namely professional Formula racing car drivers. These top-level athletes undergo intensive physical and mental trainings and compete in extreme conditions: for instance, they are exposed to very rapid accelerations (0-100 km/h in 1.7 seconds) and decelerations (100-0 km/h in 15 meters), and can reach top speeds up to 360 km/h. Such extreme driving conditions unquestionably demand, among others, fast and accurate sensory-motor control, great anticipatory abilities and high concentration levels [48, 49].
Different approaches have been chosen to allow the identification of the functional and structural correlates that characterize the brain of intensively trained, skilled athletes, as compared to ‘common’ individuals. Specifically, we used functional Magnetic Resonance (fMRI) to compare brain activity of top level race-car drivers and of a sex and age matched group of ‘naïve’ healthy drivers in different experimental conditions. Moreover, high resolution Magnetic Resonance anatomical images have been obtained in the same subjects to calculate and compare brain gray matter cortical thickness.
12
Experiment I: functional correlates of
visuo-spatial and motor processing
Introduction
Based on results described in previous studies, we hypothesize that top-level professional drivers would be characterized by greater neural efficiency as compared to common individuals during relatively simple tasks based on general visuo-motor abilities. Given the highly competitive setting and the intensive trainings in which professional drivers are daily involved, in fact, we can expect to observe a superior level of automaticity and efficiency in sensory information processing during these tasks.
To test this hypothesis fMRI was used to measure brain activity during execution of a Motor Reaction (MR) task, and of a multiple target pursuit task in which subjects had to press a button when randomly moving balls entered a color-matched round target (Visuo-Spatial, VS). These tasks were selected to explore relatively simple perceptual and motor skills available to both groups, minimizing performance differences and thus reducing potential confounding factors linked to a different ability level [50]. Different approaches of data analysis were used to compare patterns of brain response, regional interaction (adopting a multivariate autoregressive approach [51-53]) and BOLD signal temporal variability, in professional car drivers and control naïve drivers. While the first two approaches are commonly used to study the effect of practice and expertise on the brain functional organization, the signal temporal variability is a relatively new measure in fMRI, regarded as a potential marker of complexity of information integration and functional efficiency [54, 55]. In line with this view, Garrett and colleagues [55] recently demonstrated that
13
during different cognitive tasks older, poorer-performer individuals were characterized by a reduction in BOLD temporal variability as compared to young adults. Therefore, since aging is commonly regarded as a condition in which neural efficiency naturally declines and the brain have to put in place a series of compensatory changes, we predicted that this measure could also be used to investigate the level of neural efficiency in ‘super skilled’ young adults.
Methods
Subjects. Eleven professional (mean age ± S.D. = 24 ± 4 years) and 11
naïve (28 ± 4 years) car drivers were studied. All subjects were right-handed healthy males. Professional car drivers have been recruited by the Formula Medicine® group (Viareggio, Italy), and were actively participating in a professional Formula racing tournament (as Formula One Championship, World Series, Formula 3, etc.) and had a minimum of four years of expertise in amateur and professional racing. All participants received medical, neurological and psychiatric examinations, and laboratory testing, including a structural brain MRI scan exam, to rule out history or presence of any disorder that could affect brain function and development. No participant was taking any medication. All volunteers gave their written informed consent after the study procedures and risks involved had been explained. The study was conducted under a protocol approved by the Ethical Committee at the University of Pisa Medical School (Protocol n. 020850). All participants retained the right to withdraw from the study at any moment.
Image Acquisition. Functional MRI data were collected using a 1.5T
14
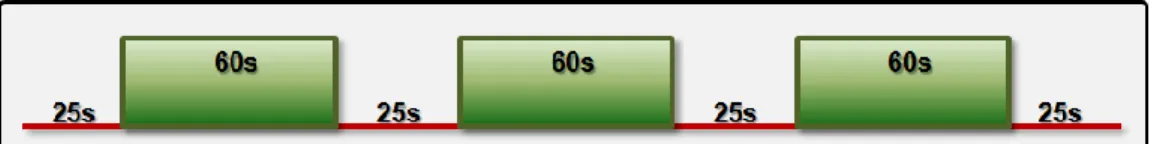
a GE Signa 1.5 Tesla scanner (General Electric, Milwaukee, WI) using following parameters: repetition time = 2500 ms, 21 axial-slices, slice thickness = 5 mm, field of view = 24 cm, echo time = 40 ms, flip angle = 90°, image plane resolution = 128 x 128. Subjects were presented with a six run block design study including randomly-alternated motor reaction and visual-spatial tasks. Every run was constituted by three task blocks (each 60 s duration) alternated with two inter-task intervals (ITI each 25 s duration). Each time series began and ended with 25 s of no stimuli, similarly to the ITI (Fig. 1). For each subject, we obtained 1-3 timeseries of 112 brain volumes (280 s) for the MR task and 3 time series for the VS task. Visual stimuli were presented on a rear projection screen viewed through a mirror (visual field: 25° wide and 20° high). Before the fMRI scanning, subjects assisted to a demonstrative session to become familiar with the task procedure. To enhance compliance and participation in the tasks, the experiment was presented as a competition, in which recorded performances would be used to measure individual abilities and to establish a ranking.
Fig. 1. Task Paradigm. Every run was constituted by three task blocks (each 60 s duration)
alternated with two inter-task intervals (ITI each 25 s duration). Each time series began and ended with 25 s of no stimuli.
For each subject we also obtained a high-resolution T1-weighted spoiled gradient recall image (slice thickness = 1 mm, echo time = 3.8 ms, repetition time = 20 ms, flip angle = 15°, field of view = 22 cm) to provide detailed brain anatomy for functional data localization.
15
Motor Reaction Task. During the MR task, the visual stimulus
reproduced a starting grid light on a gray background, and was constituted by five red circles arranged horizontally that turned to green after a random delay comprised between 2 and 4 seconds. This condition was repeated ten times for each task-block (total block duration of 60 seconds; 24 brain volumes per block). A central static white cross provided a fixation point (0.15° x 0.15°) during the entire run. Participants were asked to fixate the central cross and to press a response button held in their right hand as rapidly as possible when the starting grid color turned to green. Their reaction times, determined as the time from the stimulus onset to the key-pressure response, were automatically recorded. The intervals between the blocks presented a 25 seconds static image with the white fixation cross on the gray background. We collected 1-3 time series for each subject of the two experimental groups, with the exception of a professional driver that was excluded for technical problems during image acquisition (thus data were acquired in 11 naïve and 10 professional car drivers). Stimulus presentation was handled by using the software package Presentation (http://www.neurobehavioralsystems.com).
Visual-Spatial Task. During this VS task, subjects were asked to observe
a left-sided red and a right-sided blue circle inside a white ‘billiard table-like’ frame, arranged horizontally on a black background. Two red and two blue balls moved randomly within the ‘billiard’, and participants had to press the left or the right button when a ball run inside the color-matched circle. A vertically moving small green ‘barrier’ was also present in the center of the frame and contributed to slightly increase the difficulty of the task. For each subject, corrected, wrong and missed answers were automatically recorded. As in the MR task, in each run, three 60 seconds long task-blocks were separated by 25 seconds of static billiard frame. Stimulus presentation was handled by using the software Formula Test 2003 (Maxisoft®, Massa, Italy).
16
Behavioral Data Analysis. Behavioral data analyses were carried out
using StatView software 5.0 (SAS Institute Inc.). Reaction times collected during the MR task were used in a two-tailed unpaired t-test to look for differences in performance between the two groups. In VS task, error rates, defined as percent of errors on total given responses, were taken as an estimation of individual task accuracy. A two-tailed unpaired t-test was then used to search for differences in performance between the two groups.
Functional Images Analysis. We used AFNI and SUMA software
packages to preprocess, analyze and view functional imaging data (http://afni.nimh.nih.gov/afni; [56]). A general linear model based approach was used to define individual unthresholded responses for each of the two tasks. Then, individual functional maps and correspondent t-statistics were entered in a mixed-effect meta-analysis to identify task-related group maps and significant differences between professional and naïve drivers (whole brain corrected p < 0.05). For the two tasks, all volumes obtained in the respective runs were concatenated and coregistered (3dvolreg), temporally aligned (3dTshift), and spatially smoothed (FWHM = 6 mm). Individual run data were normalized by calculating the mean intensity value for each voxel during resting baseline timepoints, and by dividing the value within each voxel by this averaged baseline to estimate the percent signal change at each time point.
Statistical analysis was performed using multiple regressions to independently identify brain regions significantly involved in the MR and VS task (3dDeconvolve), by modeling each type of condition with a separate regressor, obtained by convolution of the task with a standard hemodynamic response model. The six movement parameters derived from the volume registration and the polynomial regressors accounting for baseline shifts and
17
linear/quadratic drifts in each scan series were included in the multiple regression analysis as regressors of no interest.
Individual unthresholded responses for each of the stimuli of interest were transformed into the Talairach and Tournoux Atlas [57] coordinate system, and resampled into 1 mm3 voxels for group analyses. Activations were anatomically localized on the naïve and professional group-averaged Talairach-transformed T1-weighted images, and visualized using normalized SUMA surface templates.
We used a mixed-effect meta-analysis approach (3dMEMA) [58] for group analysis by using the unthresholded-weights of each condition of interest to construct T contrasts and identify both significant pattern of neural response during each task (equivalent to one-sample group t-tests) and significant differences between the two groups (equivalent to a two-tailed unpaired t-tests). The MEMA approach assigns the weight of each subject contribution in the final result based on the precision of the β estimation from each subject, so determining a gain in statistical power for the group effect of interest at most regions, and less spurious isolated voxels in the final results.
The correction of both the one sample group maps and the unpaired t-contrasts for multiple comparisons across whole brain was made using Monte-Carlo simulations run via AlphaSim in AFNI with a voxelwise threshold p < 0.005 that resulted in a minimum cluster volume of 561 µL, cluster connection radius 1.73 mm for a corrected p value < 0.05 at a cluster level.
Multivariate Autoregressive Analysis. We computed a connectivity
analysis based on a multivariate autoregressive model to investigate task-related brain networks and identify potential differences between our two experimental groups. This analysis was carried out using the 1dGC program included in the AFNI package (37, 49). For each of the two tasks, we identified a set of ‘core’ regions consistently activated in both naïve and
18
professional drivers using group results obtained from functional analysis to compute a conjunction activation map (logical AND at an uncorrected voxel-wise p < 10-5, minimum cluster size of 100 µL). Regions of interest were defined as 5 mm radius spheres centered on across-group activation peaks (minimum distance between ROIs was set at 40 mm to obtain a reasonable number of regions). For each subject and ROI, concatenated task-related BOLD timeseries were extracted and used to compute connectivity networks at a single subject level. Applied preprocessing steps included slice timing correction, spatial smoothing for noise reduction, and signal normalization for each segment. The covariates used as input for the model included the six movement parameters, a polynomial functions modeling the BOLD drifting effect and the gray-matter signal. A lag order of one TR was chosen, according to the Schwarz information criterion for model selection. Finally, obtained path coefficients (indicative of both strength and direction of the temporal relation between ROIs) and corresponding t-statistics were used in a linear mixed-effect multilevel model to compute a group comparison for each task (p < 0.05).
BOLD Variability Analysis. The MSSD measure is based on differences
between successive observations and, for this reason, is more appropriate than the Standard Deviation (SD - based on the difference between single observations and the overall mean) to evaluate temporal variability in experiments with different task conditions [59]. Data preprocessing included slice timing and motion correction, spatial normalization and smoothing with a 6 mm Gaussian kernel. In addition voxel time series were further adjusted by regressing out motion correction parameters, a polynomial function modeling the BOLD drifting effect and white matter (WM) and cerebrospinal fluid (CSF) timeseries [54]. WM and CSF time courses were extracted from two small (1 voxel radius) ROIs respectively located in corpus callosum and
19
ventricles of the ‘common template’ obtained by merging spatially normalized anatomical images of all subjects. To optimize MSSD computation on our system, preprocessed functional data were resampled to obtain 3 m3 voxels.
For each individual run, MSSD was computed over the entire preprocessed activation time course using a custom built function in MATLAB (The MathWorks, Inc.). For each subject, obtained MSSD values were averaged across different runs of the same task and an unpaired t-test was used to look for any potential differences between professional and naïve drivers (significance threshold was set at corrected p < 0.05, obtained with a voxelwise threshold of p = 0.05 and cluster > 158 voxels). Given that previous studies demonstrated the fact that BOLD variability pattern is consistently conditioned by age, we wanted to exclude that potential differences in the ages of our subjects could account for any eventual difference found between the two groups. Thus, we carried out a multiple linear regression analysis (3dRegAna) for each task introducing individual age as a covariate.
Results
Behavioral Results. During the MR task, as expected, professional and
naïve car drivers showed no significant differences in performance (mean reaction time equals to 190.0 ± 28.6 ms and 190.1 ± 32.7 ms, respectively; T(1,19) = -0.08; p = n.s.) (Fig. 2a). Similarly, during the VS task the two groups
showed no significant differences in error rates (T(1,18) = 0.70; p = n.s.).
Averaged error rates for professional and naïve drivers were respectively 18.8% (± 9.2) and 21.2% (± 8.2) (Fig. 2b).
20
Fig. 2. Behavioural results. There were no significant differences in performance during both the
motor reaction task (a) and the visuo-spatial task (b) between professional and naïve drivers.
Task related functional brain responses. We first determined brain areas
functionally recruited during each task in professional and naïve drivers, and then tested between group differences.
Motor Reaction Task. During the MR task both naïve and professional
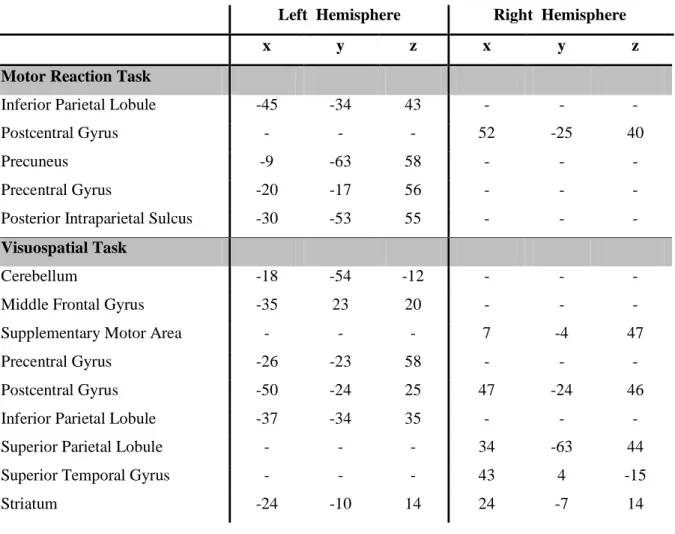
drivers recruited a network of bilateral regions, including middle and inferior frontal cortex, insula, striatum, cerebellum, cingulate, sensorimotor, temporo-occipital and parietal cortex (Fig. 3). In a mixed-effect analysis, as compared to professional drivers, naïve controls showed a significantly (whole brain corrected p < 0.05) stronger response in right postcentral cortex, left precentral area, left precuneus, left inferior and superior parietal lobules (Fig. 4 Table 1).
Visuo-Spatial Task. During the VS task both groups engaged a network
of bilateral regions, including middle and inferior frontal cortex, insula, striatum, cerebellum, cingulate, sensorimotor, temporo-occipital and parietal cortex (Fig. 3). Moreover, as compared to professional drivers, naïve controls showed a significantly (whole brain corrected p < 0.05) higher and more extensive response in supplementary motor area (SMA), left middle frontal and precentral cortex, bilateral inferior parietal lobule, right superior parietal,
21
and postcentral cortex, cerebellum, and bilateral striatum (Fig. 4; Table 1). Additionally, naïve drivers showed a greater reduction of BOLD response in the right temporopolar area as compared to professional car drivers.
Left Hemisphere Right Hemisphere
x y z x y z
Motor Reaction Task
Inferior Parietal Lobule -45 -34 43 - - - Postcentral Gyrus - - - 52 -25 40 Precuneus -9 -63 58 - - - Precentral Gyrus -20 -17 56 - - - Posterior Intraparietal Sulcus -30 -53 55 - - -
Visuospatial Task
Cerebellum -18 -54 -12 - - - Middle Frontal Gyrus -35 23 20 - - - Supplementary Motor Area - - - 7 -4 47 Precentral Gyrus -26 -23 58 - - - Postcentral Gyrus -50 -24 25 47 -24 46 Inferior Parietal Lobule -37 -34 35 - - - Superior Parietal Lobule - - - 34 -63 44 Superior Temporal Gyrus - - - 43 4 -15 Striatum -24 -10 14 24 -7 14
Table 1. Talairach coordinates of centers of mass of voxel clusters that show significantly different
22
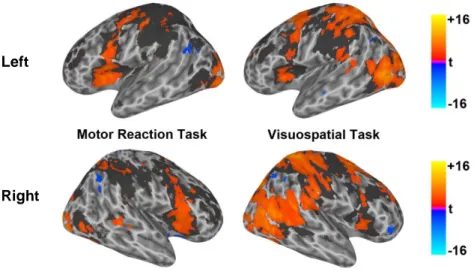
Fig. 3. Brain activations in left (top) and right (bottom) hemispheres of professional (blue/yellow
scale) and naive (gray shadow) drivers during MR (1st column) and VS (2nd column) tasks computed at whole brain corrected p < 0.05.
Fig. 4. Left (top) and right (bottom) hemispheres activation contrast maps for the two tasks, where
blue color corresponds to regions strongly activated in naive as compared to professional drivers, while red color corresponds to regions strongly activated in the professional drivers group (whole brain corrected p < 0.05).
Left
Right
Left
23
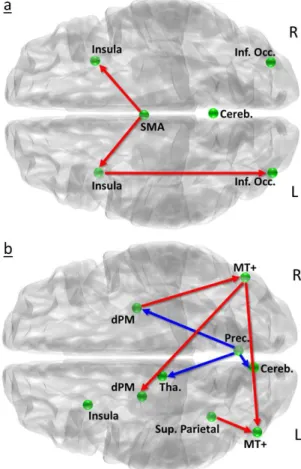
Brain functional networks. A multivariate autoregressive [60] analysis
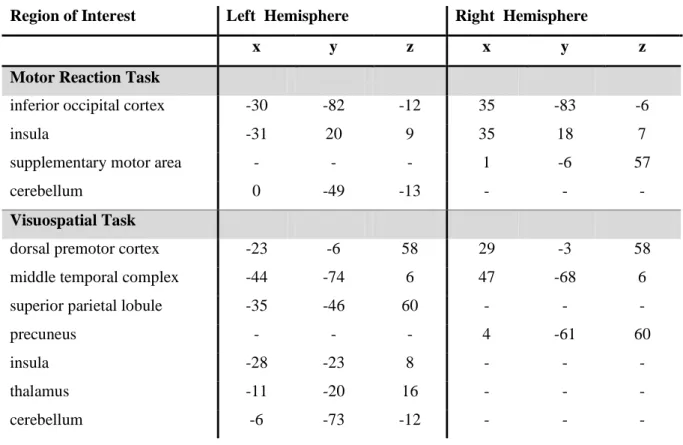
(MAR) was used to search for differences between task-related networks in professional and naïve car drivers. Specifically, we identified two sets of ‘core’ regions of interest (ROIs) on across-group activation peaks: SMA, biliateral insula, bilateral inferior occipital cortex and cerebellum, for the MR task; bilateral dorsal premotor cortex (dPM), bilateral human middle temporal cortex (hMT), right precuneus, left insula, cerebellum and thalamus for the VS task (Table 2).
Region of Interest Left Hemisphere Right Hemisphere
x y z x y z
Motor Reaction Task
inferior occipital cortex -30 -82 -12 35 -83 -6 insula -31 20 9 35 18 7 supplementary motor area - - - 1 -6 57 cerebellum 0 -49 -13 - - -
Visuospatial Task
dorsal premotor cortex -23 -6 58 29 -3 58 middle temporal complex -44 -74 6 47 -68 6 superior parietal lobule -35 -46 60 - - - precuneus - - - 4 -61 60 insula -28 -23 8 - - - thalamus -11 -20 16 - - - cerebellum -6 -73 -12 - - -
Table 2. Talairach coordinates of centers of mass of ROIs included in the multivariate
autoregressive analyses for the motor reaction and the visuospatial task.
During both tasks, the MAR analysis demonstrated numerous stronger (p < 0.05) connections in professional drivers brain networks as compared to naïve drivers (Fig. 5). Specifically, during the MR task, activity in SMA
24
predicted subsequent activation in bilateral insula, and activity in right insula predicted activation in right inferior occipital cortex to a significantly greater extent in professional drivers than in the control group (Fig. 5a). Similarly, during the VS task professional drivers showed stronger correlations between BOLD response in right hMT+ and in left hMT+ and left dPM, and between superior parietal cortex and left hMT+, and between right dorsal premotor cortex and right hMT+. Moreover, we observed stronger negative correlations between right precuneus and right dorsal premotor cortex, thalamus and cerebellum, in professional as compared to naïve drivers (Fig. 5b).
Fig. 5. Statistical map of between group comparisons derived from path coefficients and t-statistics
obtained using MAR during (a) the motor reaction and (b) the visuospatial task. Red and blue arrows respectively indicate significantly greater positive and negative influence on target regions for which a within group effect was also present. Here are shown connections that were significantly stronger in professional as compared to naïve drivers (we observed no stronger connections in this latter group).
25
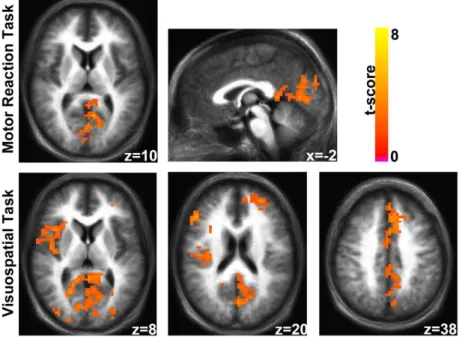
BOLD signal temporal variability. The mean squared successive
difference (MSSD) [59, 61] is a measure of temporal variability of the BOLD response and represent a potential index of functional efficiency. During both the MR and the VS tasks, professional, as compared to naïve drivers, showed a significantly higher BOLD signal temporal variability (whole brain corrected
p < 0.05) in various cortical regions, while no areas showed an increased
MSSD in naïve drivers (Fig. 6). Specifically, in both tasks, professional drivers showed a greater variability in medial visual areas and posterior cingulate cortex. In addition, during the VS task, professional drivers showed differences also in areas including cingulate cortex, bilateral medial and middle frontal areas, right insula and bilateral occipital cortex. For both tasks, additional analyses carried out to exclude potential confound effects of age revealed no significant (whole brain corrected p < 0.05) modulation of the MSSD pattern in our samples.
Fig. 6. MSSD Group Comparisons. MSSD contrast maps for MR (a) and VS (b) task. Yellow/red
regions indicate significantly (whole brain corrected p < 0.05) greater BOLD variability in professional as compared to naïve drivers. No regions showed significantly greater MSSD in naïve drivers.
26
Discussion
In the present study we used fMRI to measure brain functional response in athletes and naïve drivers during the execution of a Motor Reaction (MR) and a multiple target pursuit (VS) task. These tasks were selected to tap on basilar motor and visuo-spatial abilities available to everyone, in order to avoid any potential confounding effect related to different performance levels in the two groups [50]. As a matter of fact, behavioral performance did not differ on either task between professional and naive drivers.
We evaluated three potential markers of brain functional efficiency, that are, patterns of brain response, inter-regional interaction and BOLD signal temporal variability.
Brain functional response. Our results demonstrated that, in both
conditions, professional drivers recruited to a significantly smaller extent task-related brain areas, such as sensorimotor cortex, parietal, and prefrontal regions. These findings are in agreement with results obtained in other skilled groups, including musicians [8, 9, 62], golf players [6, 7, 13] and pistol shooters [14, 63], and indicate an increased efficiency in attentional and sensory information processing along with a reduced ‘resource consumption’ [21, 64, 65]. However, increased activations in experts as compared to ordinary individuals have also been reported [43, 66-68], and a number of factors have been claimed to play a role in determining these divergent results, including task complexity, specific task cognitive requirements and gender [31]. For instance, the increased cortical activation in elite archers as compared to non-athletes during a visuo-spatial working memory task [67] could be explained by the fact that the task did not directly reflect the specific skill domain of these athletes [1]. On the other hand, the more robust cortical recruitment during motor imagery or observation of sport-related activities in
27
divers [43] and archers [66], as compared to non-athletes, may be explained by the different confidence of the two groups with involved motor acts. In fact, it is now clear that a specific motor expertise is required to obtain an actual motor representation in the human brain [69-71] (see also Experiment II of the present work).
Inter-regional connectivity. Measures of connectivity have been used to
investigate whether differences in brain functional response were accompanied by modifications in the way task-related regions intercommunicate. Our results demonstrated that during both the MR and the VS task, brain networks recruited by the two groups were significantly different, and also evidenced that professional drivers are characterized by reinforced connectivity between a number of task-related areas. Thus, consistently with the most commonly accepted notion of neural efficiency, we demonstrated that skills and expertise of elite athletes are accompanied by both quantitative and qualitative brain functional modifications which emerge even during relatively simple visuo-motor tasks that did not require any specific skills.
While presented results allow a relatively straightforward interpretation, it is important to keep in mind that, as a number of studies have recently pointed out, the use of approaches based on the measure of time-lagged influence in fMRI have to be considered with caution, due to intrinsic technical and physiological limitations (e.g., [72]). Specifically, individual regional variability in hemodynamic and the sluggishness of hemodynamic response measured by fMRI may represent relevant potential confounding factors. Although we cannot completely exclude these issues in the present study, the fact that we obtained consistent results evaluating different networks recruited during two unrelated visuo-motor tasks, strongly support our interpretations. Moreover, reliability of our findings is supported by
28
previous studies which demonstrated that practice and expertise are commonly associated with increased neural efficiency, usually expressed by a reduced brain response extension and a network reorganization, with strengthened connectivity measures between key regions involved in a defined task (1, 4). However, while previous studies typically compared two or more groups characterized by different performance levels (e.g., [20]), the present work used non-specifically trained tasks, in which sport experts and non-athletes expressed the same level of performance.
Signal temporal variability. Finally, a greater temporal variability of
BOLD signal, as measured through the MSSD statistic, was observed in professional as compared to naïve drivers during both the MR and the VS task. Recently, BOLD signal variability has been proposed as a novel potential index of brain age and brain ‘operative’ efficiency. In fact, younger, faster and more consistent performers exhibited significantly higher signal variability in a number of brain cortical areas when compared to older, slower, individuals [54, 55]. Therefore, an increase in temporal variability may indicate a more sophisticated neural system, capable to better adapt to rapid changes in environmental demands, with a more efficient use of cognitive resources [73, 74]. Interestingly, the pattern of MSSD differences observed in the present study is similar to the one previously described in the comparison between young and older individuals [55]. Therefore, our results indicate that brain signal variability may represent a useful and reliable index not only to distinguish different age groups but, from a broader perspective, to individuate more general differences in the quality of brain operative functioning. These findings are in line with the existing literature (27, 28), and contribute to bridge the gap between the notions of neural efficiency in skilled individuals, and the main observations on age-related changes in brain functioning. In fact, as the brain of younger individuals is described as characterized by a greater
29
neural efficiency as compared to older individuals, we observed that the brain of elite athletes, such as race-car drivers, may be considered someway ‘younger’ (that is, more efficient) than the one of age-matched non-athletes.
Conclusions. Using two independent visuo-motor tasks we showed that,
in professional drivers, a reduced neural response was associated with reinforced connectivity among task-related areas as compared to naïve control subjects. In addition, race-car drivers were characterized by an increased BOLD signal variability, a feature previously described in younger individuals as compared to poorer performing older adults. These findings are the first to demonstrate that visuo-motor processing in highly-skilled individuals is sustained by a different brain functional architecture, with both ‘quantitative’ and ‘qualitative’ differences in brain recruitment as compared to naïve subjects. Indeed, the brain of highly skilled individuals processes visuo-motor information in a clearly distinctive manner even when engaging in relatively non-demanding tasks on which naïve individuals show similar levels of performance. These results are consistent with findings from other skilled groups, including musicians, and support the hypothesis of an increased ‘neural efficiency’ in highly skilled individuals [21, 31].
30
Experiment II:
functional correlates of
(passive) race-car driving
Introduction
In Experiment I we demonstrated that during relatively simple tasks based on visuo-motor abilities professional drivers recruited a smaller volume of task-related brain areas and showed reinforced regional interactions as compared to naïve drivers, despite a similar level of performance [48, 49]. While a greater brain efficiency in motor and visuo-spatial processing could be clearly relevant in supporting a high level driving performance, one can ask whether fast car racing is specifically associated with the acquisition of distinctive functional substrates. In fact, while driving a normal road-car in the traffic and driving a race-car on a circuit may share similar motor behaviors and may be based on similar visuo-motor processes, the differences in terms of physical and cognitive effort are immediately evident. Indeed, driving a race-car implies a number of additional skills, including the use of different controls and the management of braking and extremely rapid accelerations. As a matter of fact, while essentially any healthy individual can learn how to drive, very few become professional car drivers, such as Formula One drivers. Interestingly, while several studies investigated the brain correlates of driving behavior in general [75-84], none explored the functional correlates associated with top-level race-car driving.
Given the above premises, we planned a second experiment to investigate and compare the brain functional correlates associated with car driving in professional and untrained drivers. Specifically, we used fMRI to examine brain response in these two groups during a passive Formula One driving task.
31
A passive task, rather than an active one, was chosen for two main reasons: (I) to avoid potential confounds caused by the different skill level of the two groups, and (II) to minimize potential artifacts caused by movements. In fact, neuroimaging studies investigating car-driving or other complex behaviors encountered various relevant limitations related to their reproducibility in a laboratory setting, as movements are usually restricted and tasks have to be simplified to make results interpretable by researchers. To overcome these limitations, approaches based on motor imagery or passive observation of video-clips depicting different types of activities have been extensively adopted in the study of complex human behaviors [85]. It is now well known, in fact, that both approaches can evoke a brain response that largely overlap with the one observed during actual execution of the same activities [66, 69, 70]. However, studies that used passive observation paradigms to compare the brain functional response in expert (e.g., dancers and archers) and non-expert individuals also revealed that expertise in depicted activities is indispensable to obtain an actual motor representation in the human brain [66, 69]. Taking advantage of these brain functional properties, imaging experiments based on passive video-clip watching have been used to study motor and cognitive processes involved in car driving [75, 76]. These studies demonstrated that passive driving is associated with the recruitment of visual processing dedicated areas (striate and extrastriate cortex), superior and inferior parietal cortex, prefrontal cortex and sensorimotor cortex, and that this activation pattern is similar, although not identical, to the one observed in simulated active driving [76, 77, 80, 83, 84].
Another relevant limit for both passive and active paradigms aimed at investigating complex motor behaviors [76, 79, 80] lies in classical fMRI data collection and analysis methods, like those based on general linear model (GLM). Indeed, these approaches usually requires to use stimulation paradigms based on fragmented task blocks or to impose some relevant
32
approximation by forcing the definition of salient stimuli that potentially modulate brain response [85]. As a consequence, the naturalness of the task is usually dramatically compromised. To overcome these limitations, here we applied a relatively new data driven analysis method originally proposed by Hasson and colleagues, namely ‘Inter-Subject Correlation’ (ISC, [86]), that allowed us to adopt a more naturalistic stimulation paradigm. This approach is based on the assumption that some events included in naturalistic stimuli are able to evoke functionally selective, time-locked, brain response with high reliability across different subjects [87]. Thus, when recurrent activatory events specifically modulate localized brain response in a similar way in different individuals one can observe high ISC measures in recruited areas. Using ISC methods researchers are able to study brain response during naturalistic stimulation in a data driven fashion, with no constrains about type or duration of stimuli, and no assumption about which specific events are modulating regional activity. This approach has been successfully used to study brain response during movie watching (e.g. excerpt of movies or tv-programs) [86-96] and speech listening [97-99], but it has never been applied in studying functional brain response during observation of video-clips depicting complex motor behaviors, such as car driving.
To better characterize brain response in the two groups we computed ISC both on the entire time-series and within a defined ‘sliding’ time-window which have been moved forward by a single volume step (TW-ISC) [96]. Using this approach we have been able to look for specific phases in which regional modulation induced by the stimulus increased or decreased, and for the identification of particular moments in which within group correlation maximally differed between professional and naïve drivers. Finally, an explorative ‘within subject’ correlation analysis was used to characterize the functional networks recruited by the task and to look for potential
expertise-33
related modifications in the functional organization of the professional driver’s brain.
Methods
Subjects. Ten professional (mean age ± S.D. = 24 ± 5 years) and 9 naïve
(28 ± 4 years) car drivers were studied. Recruitment modalities and applied procedures are described in Methods section of Experiment I.
Image Acquisition. MRI acquisition parameters are described in the
Methods section of Experiment I. While in the magnetic resonance scanner participants were presented with four video-clips recorded by an on-board camera placed on a Formula One car running on different circuits: Spa-Francorchamps (Spa, Belgium), Magny-Cours Circuit (Nevers, France), Autodromo Enzo e Dino Ferrari (Imola, Italy) and Bahrain International Circuit (Sakhir, Bahrain). Visual stimuli were presented on a rear projection screen viewed through a mirror (visual field: 25° wide and 20° high). All four video-clips were presented in a single continuous sequence (with a 1 second black screen separating each clip from the following) overall lasting 340 seconds (136 volumes). A black screen was showed at the beginning of each functional time series for 15 seconds (6 volumes) that were subsequently discarded to allow for magnetic field stabilization. To maximize compliance and attention to the stimuli, before the fMRI scanning subjects were instructed to imagine themselves driving the racing car. For each subject we also obtained a high-resolution T1-weighted spoiled gradient recall image (slice
thickness = 1 mm, echo time = 3,8 ms, repetition time = 20 ms, flip angle = 15°, field of view = 220 mm) to provide detailed brain anatomy for functional data localization.
34
Functional Data Analysis. We used AFNI and SUMA software
packages to analyse and view functional imaging data [56]. All obtained functional volumes were coregistered (3dvolreg), temporally aligned (3dTshift), and spatially smoothed using a Gaussian kernel of FWHM 8 mm (3dmerge). Individual run data were scaled by calculating the mean intensity value for each voxel during the entire functional run, and by dividing the value within each voxel by this averaged baseline to estimate the percent signal change at each time point. Additional preprocessing steps included removal of other effects of no interest, specifically, head motion and drifting effects, from all timeseries. Individual preprocessed functional data were registered to the Talairach and Tournoux Atlas [57] coordinate system, and resampled into 2 mm3 voxels. Inter-subject correlation results were anatomically localized on the naive and professional group-averaged Talairach-transformed T1-weighted
images, and visualized on normalized SUMA surface templates.
Inter-Subject Correlation Analysis. The exploration of brain functional
responses during natural viewing condition is not easily attainable using classical analysis approaches based on general linear model (GLM), which requires the definition of specific events of interest circumscribed in time. We thus opted for an approach based on ISC, a model-free technique in which BOLD timeseries of voxels belonging to the reference brain are used as predictors for activations in correspondent voxels in a different subject’s brain, with no assumptions on the functional responses [86]. Pearson’s coefficient was used to determine the correlation between every pair of subjects within each group on a voxel by voxel basis. Thus, as we included 10 professional and 9 naive drivers, we obtained a total of 45 and 36 correlation maps respectively, that were then used to calculate the averaged correlation coefficient per voxel in each group. To identify significant correlations in
35
obtained group maps we performed a fully non-parametric voxel-wise permutation test using ISC-toolbox [91] in Matlab. This toolbox generated the permutation distribution by circularly shifting each subject’s time series by random amount so that they were no longer aligned, and then calculated the correlation values. The full permutation distribution has been approximated with 100,000,000 realizations for each group [95]. Correction for multiple comparisons was attained using false discovery rate (FDR) with independence or positive dependence assumption [91, 100, 101]. The significance threshold was set at FDR corrected p < 0.001.
To better characterize and visualize ISC differences between professional and naïve drivers we computed a contrast between group averaged correlation maps. Thus, we first applied Fisher’s z transformation to correlation coefficients obtained for each pair of subject to improve their normality (although for relatively small r values, such as those obtained in this study z transformation lead to minimal value changes). Then, we computed averaged correlation coefficients per voxel and per group, and calculated the simple mathematical difference between voxels of the two group correlation maps (‘professional – naïve’). To determine which of the contrast values were higher than what can be expected by chance, we generated a new ‘dummy’ contrast dataset applying the procedure described above after shifting timecourses of each subject and voxel by a random amount. The distribution of all correlation values, including those from ‘real’ results and those obtained in the ‘dummy’ contrast map, were used to determine the cut-off that produced a false alarm probability of p = 0.001 (e.g., [102]).
Time-Window Inter-Subject Correlation Analysis. Simple ISC allowed
us to obtain group averaged correlation maps showing all regions that were similarly modulated in professional or naïve drivers during the task, with no information about how correlation varies in time and is influenced by specific
36
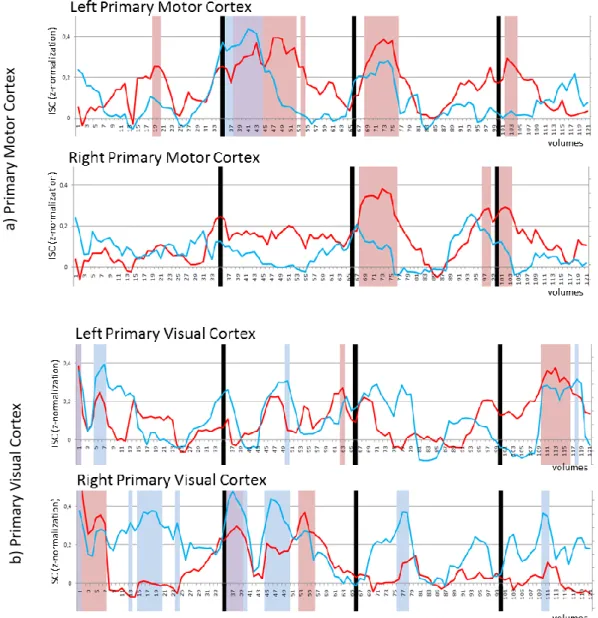
events. To further investigate this aspect we thus conducted a ‘time-window’ inter-subject correlation analysis (TW-ISC) using a specific function available in the ISC-toolbox. In this approach Pearson’s correlation coefficient is computed in a circumscribed ‘window’ of the entire time-series, that is then moved forward by a defined time-step until it reaches the last time-point (e.g. [96]). This approach was applied separately for professional and naïve drivers using a time-window of 10 volumes (25 seconds) and a time-step of a single volume (2.5 seconds), thus obtaining for each group 121 averaged correlation maps that were subsequently concatenated to define a unique correlation timecourse for each voxel. The significance threshold was set using the same method described for the simple ISC analysis (FDR corrected p < 0.05). In particular, we focused this analysis on two bilateral regions of interest, namely primary visual cortex (V1) and primary motor cortex (M1). These areas were chosen as they are involved in two different aspects related to car driving, that are visual perception and motor control. Thus, for each group, ISC-timeseries computed through the TW-ISC analysis have been extracted from ISC peaks located in left and right V1 and M1, and graphically plotted for qualitative comparison.
Functional Connectivity Analysis. Preprocessed data were low-pass
filtered (3dFourier) at 0.15 Hz to remove high frequency physiological artifacts including cardiac and respiratory pulsatility [103, 104]. In addition, the timeseries extracted from a single voxel located in lateral ventricles, the six motion correction parameters derived from the volume registration and the polynomial regressors accounting for baseline shifts and linear/quadratic drifts in each scan series were mathematically removed from the voxel timecourse (3dSynthesize) [105].
We divided each brain hemisphere into 44 regions using the Eickhoff-Zilles Atlas [106]. Thalamus and Cerebellum have been excluded from the
37
present analysis. To avoid the inclusion of areas that were not recruited during the task, only regions activated (as defined by the ISC analysis) in at least one of the two groups have been taken into account (logical OR). Thus, we obtained a total of 33 brain areas for each hemisphere. Regional mean timeseries were estimated for each individual by averaging the fMRI timecourses over all voxels in each of the 66 regions. For each subject an individual correlation matrix was obtained by computing the Pearson’s correlation coefficient between each ROI and all other areas of the brain. In order to determine significantly different regional correlations between the two experimental groups, we converted correlation coefficients of each subject into z scores using Fisher’s z transformation and then performed an unpaired t-tests at each location of the correlation matrix (p < 0.05, uncorrected). Even if none of the significantly different results survived a FDR correction for multiple comparisons, the number of observed results at = 0.05 was significantly greater than what should be expected using Poisson distribution as a model (p < 2.2*10-16).
Results
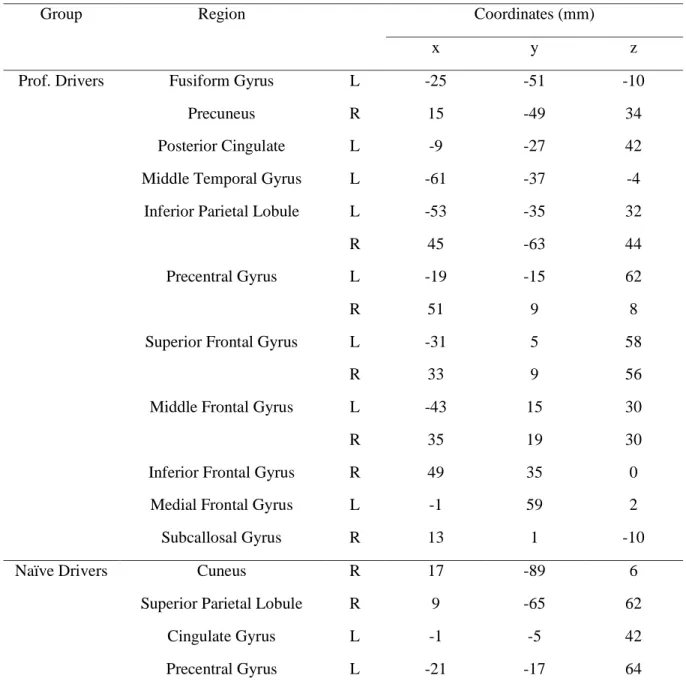
Inter-Subject Correlation Analysis. In both elite athletes and naïve
individuals passive driving significantly modulated regional activity in a set of cortical areas already described as involved in visual information processing, vigilance, attention, motor control and, more generally, in driving behavior [76, 80]. In fact, both groups showed significant functional brain response in bilateral visual cortex (BA17, BA18, BA19), precuneus, cingulate cortex, parahippocampal gyrus, superior parietal lobule, medial frontal gyrus (BA6), right dorsolateral prefrontal cortex (BA9) and left precentral gyrus (Fig. 7).
38
However, professional drivers showed additional significant correlations in bilateral inferior parietal lobule, inferior/middle temporal cortex, medial/superior frontal gyrus, inferior frontal gyrus, left middle frontal gyrus, and right precentral gyrus (Table 3).
Group Region Coordinates (mm) x y z Prof. Drivers Fusiform Gyrus L -25 -51 -10
Precuneus R 15 -49 34 Posterior Cingulate L -9 -27 42 Middle Temporal Gyrus L -61 -37 -4 Inferior Parietal Lobule L -53 -35 32 R 45 -63 44 Precentral Gyrus L -19 -15 62 R 51 9 8 Superior Frontal Gyrus L -31 5 58
R 33 9 56 Middle Frontal Gyrus L -43 15 30 R 35 19 30 Inferior Frontal Gyrus R 49 35 0
Medial Frontal Gyrus L -1 59 2 Subcallosal Gyrus R 13 1 -10 Naïve Drivers Cuneus R 17 -89 6
Superior Parietal Lobule R 9 -65 62 Cingulate Gyrus L -1 -5 42 Precentral Gyrus L -21 -17 64
Table 3. Talairach coordinataes of the ISC peaks during the Formula One passive driving task (p <
0.001, FDR corrected for multiple comparison). A threshold of 30 voxels has been used to filter smaller clusters.
39
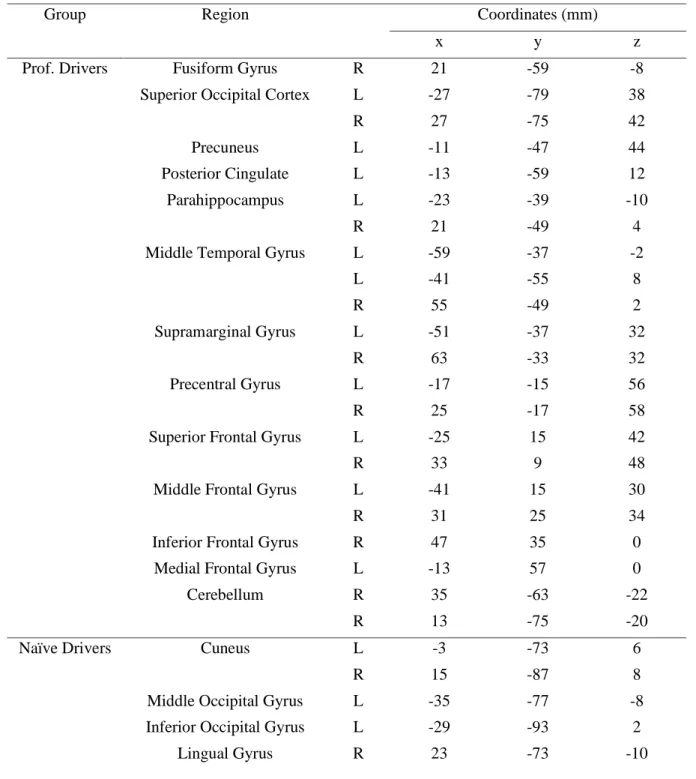
These observations were confirmed by the contrast carried out between the two groups, which revealed significantly stronger correlation in professional drivers, as compared to naïve drivers, in bilateral precuneus, inferior parietal lobule, bilateral precentral gyrus, middle temporal gyrus, parahippocampal gyrus, middle frontal gyrus, right inferior frontal gyrus, medial frontal cortex (BA10), and posterior cingulate cortex. On the other hand, naïve drivers showed stronger correlations in bilateral cuneus and lingual gyrus, left middle occipital cortex and left inferior occipital cortex (Table 4).
40
Fig 7. (a-b) Group Inter-Subject Correlation maps obtained by averaging Pearson’s correlation
coefficient computed between each pair of subjects within the same group at each location. Naïve drivers’ results (a) are shown in dark/light blue while professional drivers’ results (b) are shown in red/yellow. All results are FDR corrected p < 0.001. (c) Contrast between averaged correlation maps of the two groups; here dark/light blue indicate an higher correlation value in naïve drivers, while red/yellow colors indicate an higher correlation in professional drivers. The cut-off was determined to produce a false alarm probability of p < 0.005.
41 Group Region Coordinates (mm)
x y z Prof. Drivers Fusiform Gyrus R 21 -59 -8
Superior Occipital Cortex L -27 -79 38 R 27 -75 42 Precuneus L -11 -47 44 Posterior Cingulate L -13 -59 12 Parahippocampus L -23 -39 -10 R 21 -49 4 Middle Temporal Gyrus L -59 -37 -2 L -41 -55 8 R 55 -49 2 Supramarginal Gyrus L -51 -37 32 R 63 -33 32 Precentral Gyrus L -17 -15 56 R 25 -17 58 Superior Frontal Gyrus L -25 15 42 R 33 9 48 Middle Frontal Gyrus L -41 15 30 R 31 25 34 Inferior Frontal Gyrus R 47 35 0
Medial Frontal Gyrus L -13 57 0 Cerebellum R 35 -63 -22
R 13 -75 -20 Naïve Drivers Cuneus L -3 -73 6
R 15 -87 8 Middle Occipital Gyrus L -35 -77 -8 Inferior Occipital Gyrus L -29 -93 2 Lingual Gyrus R 23 -73 -10
Table 4. Talairach coordinataes of the ISC difference peaks obtained in the comparison between
professional and naïve drivers during the Formula One passive driving task (p < 0.005). A threshold of 30 voxels has been used to filter smaller clusters.
42
Time-Window Inter-Subject Correlation Analysis. Whole brain
correlation time-courses were computed separately for professional and naïve drivers. However, due to difficulties in the interpretation of correlation time-dependent variations in all brain areas, we limited our analysis to few regions of interest, namely left and right precentral gyrus (M1), and left and right primary visual cortex (V1). Computed ISC timecourses have been extracted from correlation peaks for each location and group and graphically plotted for subsequent evaluations and qualitative comparisons (Fig 8a).
We observed that in both left and right M1 professional drivers showed more significant (FDR corrected p < 0.05) ISC increases as compared to naïve drivers, which conversely showed only one significant increase in left M1 at the beginning of the second video-clip (Magni-Cours circuit). Specifically, professional drivers were characterized by increasing local activity correlation in left M1 during each of the four circuits. Right M1 showed a timecourse very similar to the one of left M1, with significant correlation peaks in the third and fourth video-clips (Autodromo Enzo e Dino Ferrari and Bahrain International Circuit). Interestingly, these correlation peaks were temporally located immediately before and/or in correspondence with particularly demanding traits of each circuit (e.g., a series of curves). On the other hand, naïve drivers showed increased correlations only in few occasions, that are, at the beginning of the first video-clip, and in the initial part of the second and the third circuits, for left M1, and near the end of the third circuit for right M1.
In V1 we observed mostly opposite results. In fact, in right primary visual cortex, while both groups showed a significant correlation increase at the beginning of the first video-clip (as expected, considering the initial transition from the black screen to the first scenes), naïve drivers showed additional correlation peaks during each of the four circuits. Conversely, professional drivers showed only two significant peaks at the beginning and in
43
the central part of the second circuit. Finally, in left primary visual cortex, we observed no clear differences between the two groups (Fig 8b).
Fig 8. Time-Window Inter-Subject Correlation (TW-ISC) analysis results obtained considering as
regions of interest the left and right (a) primary motor cortex and (b) primary visual cortex. The red and blue lines respectively indicate the time-related variation in ISC for professional and naïve drivers in the two brain areas. Red and blue bands represent statistically significant (FDR corrected p < 0.05) increases in ISC in professional and naïve drivers respectively, while the violet band indicates a significant increase in both groups.
a) P ri ma ry Mo tor C or te x b) P ri ma ry V is ua l C or te x
44
Functional Connectivity Analysis. Individual functional connectivity
matrices obtained with an explorative approach were used to calculate averaged group maps (Fig. 9a) and compute a comparison between professional and naïve drivers (Fig. 9b) via unpaired t-test (p < 0.05). Obtained results revealed a number of reinforced correlations in professional as compared to naïve drivers, mostly in left posterior cingulate, orbitofrontal cortex, superior frontal gyrus, middle temporal and angular cortex. On the other hand, naïve drivers showed fewer stronger correlations, mostly in areas belonging to occipital, parietal and temporal lobes (Fig. 9).
45
Fig 9. Individual functional connectivity matrices obtained with the ‘explorative’ approach have
been used to compute (a) group averaged matrices and (b) a comparison between professional and naïve drivers via unpaired t-test (p < 0.05). Results showed a number of reinforced correlations in professional as compared to naïve drivers, mostly in left posterior cingulate, orbital cortex, superior frontal gyrus, middle temporal and angular cortex. On the other hand, naïve drivers showed fewer stronger correlations, mostly between areas belonging to occipital and parietal lobes
b a