The S-H
OCK
Dataset: Analyzing Crowds at the Stadium
Davide Conigliaro
1, Paolo Rota
2, Francesco Setti
3, Chiara Bassetti
3, Nicola Conci
4, Nicu Sebe
4, and
Marco Cristani
11
University of Verona ,
2Vienna Institute of Technology ,
3ISTC–CNR (Trento) ,
4University of Trento
Abstract
The topic of crowd modeling in computer vision assumes a single generic typology of crowd, which is very simplis-tic. In this paper we adopt a widely accepted taxonomy for crowds, focusing on a particular category, thespectator crowd, which is formed by people “interested in watching something specific that they came to see” [5]. This can be found at the stadiums, amphitheaters, cinema, etc. In par-ticular, we propose a novel dataset, the Spectators Hockey (S-HOCK), which deals with hockey matches during an in-ternational tournament. The dataset considers 4 hockey matches, where hundreds of spectators are individually an-notated, capturing fine grained actions such as hands on hips, clapping hands, watching the cellphone etc., for a to-tal of more than 100 millions of annotations. Analyzing peo-ple at the stadium addresses different computer vision tasks, some of them are classic (crowd counting), while other are brand new (as thespectator categorization). For this reason, S-HOCKcomes also with a set of protocols for dealing with all of them, and a set of baselines and novel approaches that define the best scores on all the tasks. Anyway, the perfor-mances are far from being errorless, and this witnesses the difficulty of the problem and that much can be done in the future.
1. Introduction
Capturing and understanding crowd dynamics is a prob-lem which is important per se, under diverse perspectives. From sociology to public safety management, modeling and predicting the crowd presence and its dynamics, possibly preventing dangerous activities, is absolutely crucial.
In computer vision, crowd analysis focuses on model-ing large masses, where a smodel-ingle person cannot be finely characterized, due to the low resolution, frequent occlu-sions and the particular dynamics of the scene. Therefore, many state-of-the-art algorithms for person detection and
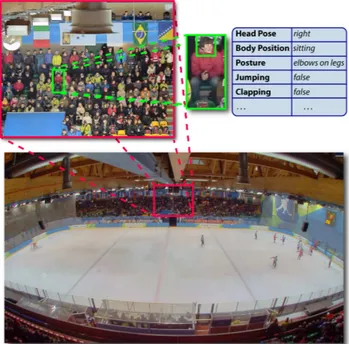
Figure 1. Example of images collected for both the spectators and the rink, plus the annotations.
re-identification, multi-target tracking and action recogni-tion cannot be directly applied in this context. As a con-sequence, crowd modeling has developed its own tech-niques as multiresolution histograms [44], spatio-temporal cuboids [23], appearance or motion descriptors [3], spatio-temporal volumes [27], dynamic textures [29], calculating on top of the flow information. Such information is then employed to learn different dynamics like Lagrangian par-ticle dynamics [35], and in general fluid-dynamic models. The most important applications of crowd analysis are ab-normal behavior detection [29], detecting/tracking individ-uals in crowds [24], counting people in crowds [7], identi-fying different regions of motion and segmentation [39].
All of these approaches assume a general and unique kind of crowd, while a thorough analysis of the sociological literature offers a taxonomy which could be very interesting
for computer vision. In particular, crowds – better defined as large gatherings [16,17,30] – can be divided into four broad categories:
1. prosaic [30] or casual [6,18] crowds, where members have little in common except their spatio-temporal lo-cation (e.g., a queue at the airport check-in counter); 2. demonstration/protest [30] or acting [6,18] crowd, a collection of people who gather for specific protest events (e.g. mob/riot/sit-in/march participants); 3. spectator [30] or conventional [6,18] crowds, a
col-lection of people who gather for specific social events (e.g. cinema/theatre/sport spectators), and within which one may find
4. expressive crowds [6,18], a collection of people who gather for specific social events and want to be mem-ber of the crowd, to participate in “crowd action” (e.g. flash-mob dancers, mass participants, sport support-ers).
Considering this taxonomy, we can certainly say that all the approaches in the computer vision literature focus primar-ily on casual [24,35,7], and protest crowds [25], with hun-dreds of approaches and ten of datasets, while none of them deals with the spectator crowd and its expressive segments. This is a critical point: from a recent statistics of 2014 conducted by UK Home Office1, disorders at stadiums caused 2,273 arrests only considering the FA competitions in the last year. Moreover, in the last 60 years 1447 people died and at least 4600 were injured at the stadiums during major events around the world2.
These statistics motivated in several countries emergency plans for ensuring a better safety and order management, and it is here where computer vision may consistently help. This paper goes in this direction, focusing on the analysis of the spectator crowd, and offering the first dataset on the subject, S-HOCK.
S-HOCKfocuses on an international hockey competition (12 countries from all around the world have been invited) which has been held in Trento (Italy) during the 26th Winter Universiade, focusing on the final 4 matches of the tourna-ment.
The dataset has many cues that make it unique in the crowd literature, and in general in the surveillance realm. The dataset analyzes the crowd under different levels of de-tails, offering labeling for each one of them: at the lowest level, it gives the number and position of all the spectators. At the medium level, it gives a fine grained specification of all the actions performed by each single person, such as bending, applauding, the head orientation etc. At the higher 1Football-related arrests and football banning order statistics, Season
2013–14, available online athttp://goo.gl/j9yYYQ.
2See athttp://goo.gl/xMU2Zf.
level, it models the network of social connections among the public (who knows whom in the neighborhood), what is the supported team, what has been the best action in the match, etc. This information is summarized by an impressive num-ber of annotations, collected over a year of work: more than 100 millions of double checked annotations. This permits potentially to deal with hundreds of tasks, few of them are documented here, all of them aimed at understanding and predicting the crowd behavior.
Other than this, the dataset is multidimensional, in the sense that offers not only the view of the crowd (at different resolutions, with 4 cameras) but also on the matches. This multiplies the number of possible applications that could be assessed, investigating the reactions of the crowd to the ac-tions of the game, opening up to applicaac-tions of summariza-tion and content analysis. Besides these figures, S-HOCK
is significantly different from all the other crowd datasets, since the crowd as a whole is mostly static and the motion of each spectator is constrained within a limited spatial sur-rounding of his position.
Together with the annotations, in this paper we discuss about some tasks which focus on the low and high level of details of the crowd analysis, namely, the people detection and the head pose estimation for the low level analysis, and the fan identification for the high level analysis. Fan identi-fication is a kind of crowd segmentation, where the goal is to find the team supported by each one of the spectator. This task is intuitively useful to segregate the different supporter teams, and individuates “hot” zones in which the two teams are mixed. For all of these applications, we define the ex-perimental protocols, so that future researches could easily and fairly compare with us.
From the experiments we conducted, we show how stan-dard methods for crowd analysis, which work well on state-of-the-art datasets, do not fit the type of data we are dealing with, thus requiring us to face the problem from a different perspective. For this reason, together with the baseline ap-proaches, we also propose customized approaches for the spectator crowd, which fit better the scenario at hand, defin-ing new upper bounds.
Summarizing, the contributions of this work are • A novel dataset for spectator crowd, which describes at
different levels of detail the crowd behavior with mil-lions of ground truth annotations, synchronized with the game being played in the field. Crowd and game are captured with different cameras, ensuring multiple points of view;
• A set of tasks for analyzing the spectator crowd, some of them are brand new;
• A set of baselines for some of these tasks, with novel approaches which define the state of the art;
• A sociologically motivated taxonomy of crowds, which individuates four different crowd types, two of
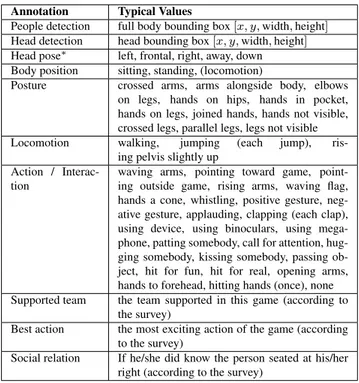
Annotation Typical Values
People detection full body bounding box [x, y, width, height] Head detection head bounding box [x, y, width, height] Head pose∗ left, frontal, right, away, down Body position sitting, standing, (locomotion)
Posture crossed arms, arms alongside body, elbows on legs, hands on hips, hands in pocket, hands on legs, joined hands, hands not visible, crossed legs, parallel legs, legs not visible Locomotion walking, jumping (each jump),
ris-ing pelvis slightly up Action /
Interac-tion
waving arms, pointing toward game, point-ing outside game, rispoint-ing arms, wavpoint-ing flag, hands a cone, whistling, positive gesture, neg-ative gesture, applauding, clapping (each clap), using device, using binoculars, using mega-phone, patting somebody, call for attention, hug-ging somebody, kissing somebody, passing ob-ject, hit for fun, hit for real, opening arms, hands to forehead, hitting hands (once), none Supported team the team supported in this game (according to
the survey)
Best action the most exciting action of the game (according to the survey)
Social relation If he/she did know the person seated at his/her right (according to the survey)
Table 1. The annotations provided for each person and each frame of the videos. These are only typical values that each annotation can have, a detailed description of the annotations is provided in the supplementary material. The meaning of the head pose at-tributes will be explained later in the paper. [∗] For the experi-ments in Sec. 3.2, away class has been further divided in far-left and far-right to discriminate the head pose even when a spectator is not looking toward the rink.
which have never been investigated in computer vi-sion, the spectator crowd and its expressive segments. The rest of the paper is organized as follows: The details of the data collection and labeling are reported in Sec. 2; the tasks of people detection, head pose estimation, and fan identification are introduced in Sec.3, focusing on contex-tualizing the problem, discussing the related state of the art, presenting the considered baselines and our approach, and discussing the results obtained. Finally, in Sec.4, other ap-plications worth investigating are briefly discussed, which will further promote our dataset as a future benchmark for spectator crowd analysis.
2. Data Collection & Annotation
The 26th Winter Universiade was held in Trento (Italy) from 11 to 21 of December 2013, attracting about 100,000 people from all over the world among athletes and spec-tators. The data collection campaign focused on the last 4 matches (those with more spectators) held in the same ice-stadium, and was conducted by a team of 6 people, 4 of them collecting questionnaires and the remaining at the
cameras: in particular we used 5 cameras: a full HD cam-era (1920×1080, 30 fps, focal length 4mm) for the ice rink and another one for a panoramic view of all the bleachers, and 3 high resolution cameras (1280×1024, 30 fps, focal length 12mm) focusing on different parts of the spectator crowd. In total, 20 hours of recordings have been collected, with inter-camera synchronization: this brougth to the in-teresting feature of having the crowd synchronized with the game on the rink.
After the match, we asked to a percentage of uniformly distributed spectators (30%) to fill a simple questionnaire with three questions (whose significance will be clear later in the paper):
• Which team did you support in this match?
• Did you know at the begin of the match who is sitting next to you?
• Which has been the most exciting action in this game? In this dataset we propose game segments from differ-ent hockey matches in order to stress the generalization ca-pability of the algorithms discussed in this paper, since in each match we have different people and illumination con-ditions. In particular, from each match we selected a pool of sequences highlighting different situations inside the rink (goals, saves, timeouts, etc.), with each video 31 seconds long (930 frames), for a total of 75 sequences: 15 for each one of the 4 cameras on the crowd and 15 sequences on the game. These sequences were chosen to represent a wide, uniform and representative spectrum of situations, e.g. tens of instances of goals, shots on goal, saves, faults, timeouts (each sequence has more than one event). [Paolo: The full annotation reported in Tab. 1 has been performed on one among the three close-field cameras, whereas in the other two are annotated only with the survey information. The forth view is a wide-field view of the previous three views and the fifth is oriented toward the ice rink in order to record the game events. The 5 cameras are synchronized.]
Each sequence has been annotated frame by frame, spec-tator by specspec-tator, by a first annospec-tator, using the ViPER for-mat [10]3. Such annotator had to perform three different macro tasks: detection (localizing the body and the head), posture and action annotation, respectively. [Paolo: This amounted to deal with a set of 50 labels, listed in Table14]. Among the whole set of possible features that can char-acterize the human dynamics, we selected the annotated el-ementary forms of action[30] as strictly connected with the analysis of social interaction, and related to our specific set-ting, i.e. sport spectator crowd. In particular, we drew from available literature on (a) social interaction, with particular attention to non-verbal conduct (proxemics, bodily posture, 3The toolkit is available at http://viper-toolkit.
sourceforge.net/
4The database is available athttp://mmlab.disi.unitn.it/
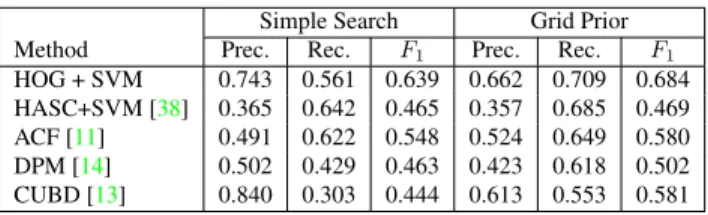
Simple Search Grid Prior
Method Prec. Rec. F1 Prec. Rec. F1
HOG + SVM 0.743 0.561 0.639 0.662 0.709 0.684 HASC+SVM [38] 0.365 0.642 0.465 0.357 0.685 0.469 ACF [11] 0.491 0.622 0.548 0.524 0.649 0.580 DPM [14] 0.502 0.429 0.463 0.423 0.618 0.502 CUBD [13] 0.840 0.303 0.444 0.613 0.553 0.581
Table 2. Quantitative results of people detection methods, with and without the grid-arrangement prior. [Davide: QUI CHIEDONO LA ROC]
gesture, etc.), especially in public places; and (b) the so-called crowd behavior, i.e. social interaction in large gath-erings [16,17,30], in particular sport spectator gatherings.
Each annotator had two weeks to annotate 930 frames, and was asked to do it in a lab, in order to monitor him/her and ensure a good annotation quality. After all the se-quences have been processed, producing a total amount of more than 100 millions of annotations[Paolo: Forse ci sono da rivedere sti numeri alla luce di quanto scritto 3 paragrafi sopra.], a second round of annotations started, with the “sec-ond annotators” that had to find bugs in the first-round an-notation phase. The whole work involved 15 annotators and lasted almost 1 year, with all annotators paid for their duties.
3. Evaluation
In this section we present a set of possible applications and analysis that can be conducted on the proposed dataset. In particular we focus on two classical applications, such as people detection and head pose estimation, and one more interesting application from the social point of view, such as crowd segmentation based on the behavior of its members. For each one of the mentioned topics we briefly present the state of the art taking into account only the methods appli-cable in this particular scenario and some preliminary ex-periments conducted on our dataset. We also propose some ways to improve the performance by exploiting the specific structure of the crowd and the relation between the crowd behavior and taking into account what is happening in the hockey rink.
3.1. People Detection
People detection is a standard and still open research topic in computer vision, with the HOG features [9] and the Deformable Part Models [14] as workhorses, and plenty of alternative algorithms [12]. Unfortunately, most of the methods in the state of the art are not directly usable in our scenario, mostly for two reasons: low resolution – a person has an average dimension of 70×110 pixels – and occlu-sions – usually only the upper body is visible, rarely the entire body and sometimes only the face.
Recently, some works studied how to improve the per-formance of detectors by means of an explicit model of the
visual scene. Specifically, focusing on people detection in crowded scenes, Barina et al. [4] used the Hough transform to overcome the non-maxima suppression stage for detect-ing multiple istances of the same object, while San Biagio et al. [38] proposed a new descriptor able to treat com-plex structural information in a compact way. To overcome occlusion issues, Wu and Nevatia [43] used a number of weak part detectors based on edgelet features and Eichner et al. [13] fused DMP [14] and Viola-Jones [33] detectors to identify upper bodies. Finally, Rodriguez et al. [36] pro-posed to optimize a joint energy function combining crowd density estimation and the localization of individual people. In this work we provide 5 different baselines for people detection, from the simplest algorithms to the state of the art method for object detection, showing how in this sce-nario the simplest method get very high scores due to the problems listed above.
The first method we consider is a simple detector based on HOG [9] features (cell size of 8×8 pixels) and a linear SVM classifier (HOG+SVM). Similarly, the second method only differs in the descriptor we use, which in this case is the Heterogeneous Auto-Similarities of Characteristics (HASC) descriptor [38]. We use the same sliding window as in the previous case to generate the map and the detec-tions. We will refer to this method as HASC+SVM.
We also test 3 state-of-the-art methods for people de-tection: (1) the Aggregate Channel Features (ACF) detec-tor [11] uses the Viola-Jones framework to compute integral images (and Haar wavelets) over the color channels, fusing then together; (2) the Deformable Part Model (DPM) [14] combines part’s templates arranged in a deformable config-uration fed into a latent SVM classifier; and (3) the Calvin Upper Body Detector (CUBD) [13], a combination of the DPM framework trained on near-frontal upper-bodies – i.e. head and upper half of the torso of the person – and the Viola-Jones face detector.
On top of all these methods, we propose an extension based on the strong prior we have in our kind of crowd, i.e. the people are “constrained” by the environment to arrange in a grid – the seats on the bleachers. Assuming a regular grid (considering the camera perpendicular at the plane of the bleachers and ignoring distortion effects) and consider-ing the fact that since people are more likely to locate on the same rows and columns, we can just add to the detec-tion confidence map the average of the map over the rows and the columns. Consider D(x, y) the output of the de-tector for the patch (x, y), the modified output for a target location (ˆx, ˆy) is: ˜ D(ˆx, ˆy) = D(ˆx, ˆy) +X i D(xi, ˆy) + X j D(ˆx, yj)
In the case there is a distortion due to the camera point of view, this could be easily recovered by using Hough
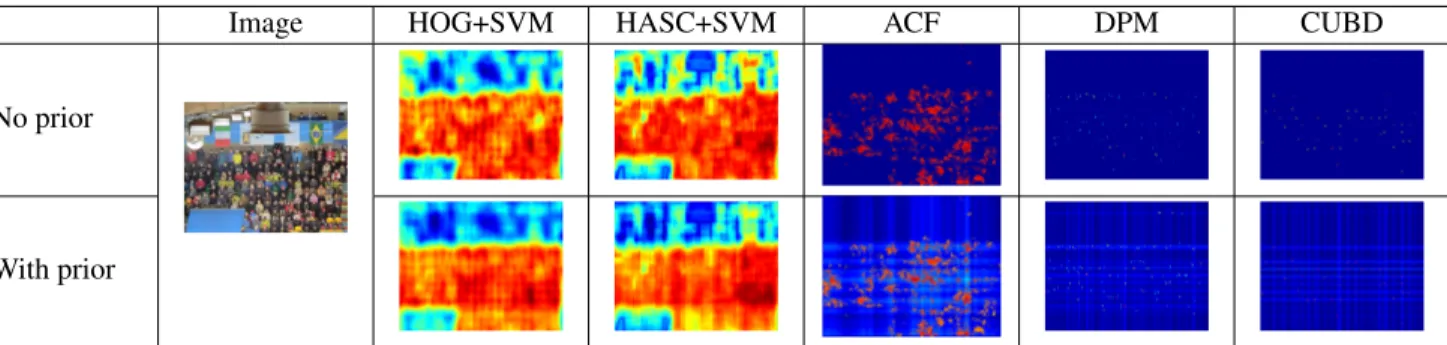
trans-Image HOG+SVM HASC+SVM ACF DPM CUBD
No prior
With prior
Figure 2. Qualitative results for people detection algorithms. Detection confidence map for each method with and without imposing the grid-arrangement prior. (best viewed in color)
form for detecting the “principal directions” and summing over these new lines.
As experimental protocol, we use two videos from a sin-gle game for training and two from different games for val-idation, leaving the 11 sequences from the final for testing. A set of 1,000 individuals randomly selected from the train-ing videos are used as positive samples, while a background image is used to generate the negative samples for training. Then, 20 random frames from the validation videos are used to tune the best parameters for minimum detection score threshold and the non-maxima suppression parameters. A subsampling of 1 frame every 10 for each video is used for testing, resulting in 1,000 images and 150,000 individ-uals. While ACF, DPM and CUBD have their own search-ing algorithms to generate candidate boundsearch-ing boxes, for HOG+SVM and HASC+SVM we consider a sliding win-dow of 72×112px with a step of 8px, generating a detec-tion confidence map of 160×118 patches. A threshold on the minimum detection score and a non-maxima suppres-sion stage have been applied to generate the predicted de-tections.
We consider an individual as correctly identified if the
[Davide: intersection area between the predicted and anno-tated bounding boxes is more than 50% of the union of the two rectangles by the formula
Bp∩ Bgt>
(Bp∪ Bgt)
2 (1)
]where Bp∩ Bgtdenotes the intersection of the predicted and ground truth bounding boxes and Bp∪ Bgttheir union. As performance measures we use precision, recall and F1 scores.
A qualitative evaluation of the baselines and the grid ar-rangment prior contribution is in Fig.2, while quantitative results are in Table 2. We can notice how the best per-forming method is the HOG+SVM, while part based frame-works (i.e. DPM and CUBD) perform poorly in their stan-dard version; this is probably due to the low resolution of the person bounding boxes which makes it very difficult to detect single parts like arms and legs. By introducing our
proposed prior, we can see how all the methods increase their performances, and in particular CUBD increases of about 10%, becoming one of the best detectors for this kind of scenario. As a result of the introduction of our grid-arrangement prior, an average improvement of about 5% in F1score is achieved.
3.2. Head Pose Estimation
Once the body has been detected, and the head has been localized, a consequent operation to be carried out is the head pose estimation. It represents another low-level oper-ation, essential for many medium and high level tasks, for example capturing the focus of attention of the spectators, correlating it with the action in the ice rink.
The literature on head pose estimation is large and het-erogeneous as for the scenarios taken into account; most of the approaches assume that the face is prominent in the im-age, as in a multimodal interaction scenario, and rely on the detection of landmark points [47,22,8]. Here these solu-tions are inapplicable since the faces are too small (50x40 pixels on average). In a low resolution domain the work proposed by Orozco et al. [32] seems to fit better, relying on the computation of the mean image for each orientation class. Distances w.r.t. the mean images are used as de-scriptors and fed into SVMs. In [42], the authors exploit an array of covariance matrices in a boosting framework. The image of the head is divided into different patches, that are weighted depending on their description capability. On S-HOCKthese methods are performing roughly the same in terms of classification accuracy, with a huge time consump-tion (see Tab.3).
In order to overcome this issue, we propose two novel approaches based on Deep Learning, with comparable re-sults but much faster. The choice of Deep Learning is moti-vated by the large number of effective approaches in the ob-ject recognition literature, witnessing its versatility in many scenarios [28,21,26,41,40].
In particular, we evaluate the performance of the Con-volutional Neural Network (CNN) and the Stacked Auto-encoder Neural Network (SAE) architecture. In both
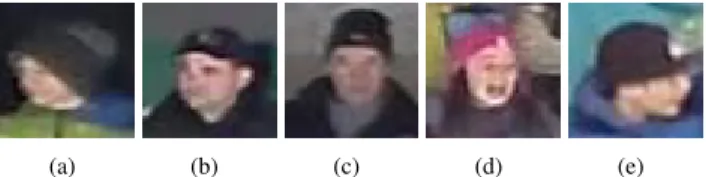
meth-(a) (b) (c) (d) (e)
Figure 3. Examples of the five head poses considered for the ex-periments in Sec.3.2; in order (a) to (e): far left, left, frontal, right, far right.
AVG Accuracy Training time Testing time
Method [sec] [sec]
Orozco et al. [32] 0.368 105303 6263 WArCo [42] 0.376 186888 87557 CNN 0.346 16106 68 SAE 0.348 9384 3 CNN + EACH 0.354 16106 68 SAE + EACH 0.363 9384 3
Table 3. Classification accuracy for state-of-the-art methods aver-aged on the five classes and the computation time. The time used to refine the prediction through EACH is negligible comparing to the one used to train and test the neural network.
ods we feed the Neural Network with the original image, resized to a standard size of 50x50 pixels, so as to have uni-form descriptors. The CNN is composed by 5 layers: an input layer followed by 2 sets of convolution-pooling layers (see Fig. 4 (a)). Both kernels in the convolutional layers are 5 × 5 pixels, the scaling factor of the pooling layer is 2 and the training has been performed over 50 iterations. The SAE architecture is depicted in Fig.4(b), the input im-ages are fed into an auto-encoder with hidden layers of size h = 200, trained separately. A second training phase is per-formed on the neural network initialized with the weights learned in the previous stage. Both training procedures are refined in 100 epochs.
As for the experimental protocol is the same as in the previous case, except for the fact that there is no valida-tion set; all the training sequences are employed to extract a total of 107299 heads while the testing set is composed by 34949 heads from the testing sequences. In this experi-ment, we take as input the head locations coming from the ground truth, in order to derive a sort of upper bound on the estimation perfomances. In this respect, faces are anno-tated as frontal, left, right, far left and far right. In a more quantitative fashion, frontal faces are considered roughly in the range between −10◦and 10◦, left and right spans from −10◦to −80◦and 10◦to 80◦ respectively. The heads ex-ceeding those angles in both directions are considered as far leftand far right. This has been detailed to the annotators during the data labeling (see Fig.3).
In Tab. 3 shows the results of the current state of art methods compared with the two proposed approaches. The overall accuracy spans within a range of 3% for Orozco et
al. [32], WArCo [42], CNN and SAE but in neural networks approaches the computation workload is much less. This speed up in classification time for both training and testing phases makes our method more suitable for real life appli-cations where a quick response and an imminent decision is required. As a further remark, we trained WArCo by ran-domly sampling 5000 samples among all those available for training, this has been necessary for the huge computation time required to learn the model in case of using the whole set of data.
In case of large sport events the spectator crowd atten-tion tends to be attracted by the locaatten-tion of the acatten-tion. This observation can be exploited to benefit the final classifica-tion. For this reason we propose an additional experiment named EACH (Event Attention CatcH). In order to accom-plish this task we consider the ice rink as our universe of locations where the puck can be. We are not interested in the pitch information of the head so we reduce the rink to a monodimensional space. We model the position of the puck such as a Gaussian distribution over all the possible locations and we consider it as a prior probability in order to refine the final head pose estimation. This probability PA(c)is formalized in Eq. (2) PA(c)= U(c) X i=L(c) 1 σ√2πe −(xi−m2σ(c) ) (2)
where L(c)and U(c)are the lower and the upper boundaries of the rink for the specific class c respectively, m(c)is the position of the puck.
c = arg max c
(αPA(c)+ (1 − α)PN(c)) (3) The final decision is taken according with the Eq. (3), where α is a weighting parameter, PN(c)is the probability of the head pose being assigned to class c computed by the Neural Network.
We observe that this model is much more beneficial when players are playing with respect to when the game is paused by a foul. This particular aspect suggests us to tune the α parameter according to the game phase. The re-sults reported in Tab. 3are computed using σ = 15 and α = 0.3. The ice rink information increases the accuracy by approximately 2% on both CNN and SAE frameworks.
3.3. Spectators Categorization
In our dataset the spectators categorization task consists in finding different groups of people among the spectators. The result of this segmentation is strictly related to the be-havior of the people and thus we are able to cluster peo-ple supporting different teams by considering their reaction during specific game actions, e.g. goals, saves, etc.
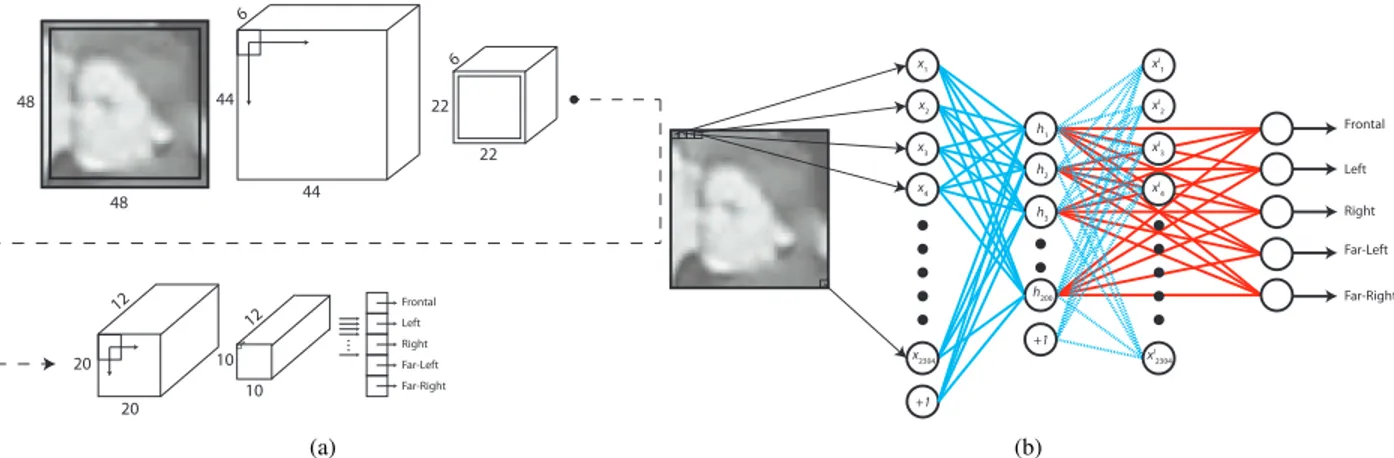
6 6 12 12 48 48 44 44 22 20 10 10 20 22 Frontal Left Right Far-Left Far-Right (a) Frontal Left Right Far-Left Far-Right x1 x I 1 xI 2 xI 3 xI 4 xI 2304 h1 h2 h3 h200 x2 x3 x4 x2304 +1 +1 (b)
Figure 4. (a)Architecture of CNN. (b) SAE architecture: in cyan are pictured the interconnections between the auto-encoder that must be trained separately, in red instead there are the interconnections of the final NN.
Method Accuracy
AS2007 [2] 0.592 MMS2010 [31] 0.559
Our 0.621
Table 4. Spectators categorization accuracy obtained from the nor-malized confusion matrix.
Spectators categorization can be considered a subtask of the crowd behavioral analysis, which is generally associ-ated with human activity analysis [19,34,1]. As stated by Jaques et al. [20], in computer vision there are two main approaches for crowd behavior analysis: the object-based where the crowd is considered as a collection of individu-als, and the holistic approach which treats the crowd as a single entity. This second approach is the one that best suits the spectator crowd analysis because it directly tackles the problem of dense occluded crowds. The holistic approaches usually start from optical flow to extract global information from the crowd. In [2], the authors use Lagrangian parti-cle dynamics to segment the flow; here the notion of a flow segment is equivalent to a group of people that perform a coherent motion.
More recently, Mehran et al. [31] propose a streakline representation of flow to address various computer vision problems, including crowd flow. They use a simple water-shed segmentation of streaklines to cluster regions of coher-ent motion.
Both these works and several datasets proposed in the literature focus on pedestrian crowds [37,2], instead with S-HOCKwe propose a crowd with different dynamics and behavior, where the people are assumed to stay near a fixed location for most of the time and their movements are lim-ited to their position. For this reason, the works listed above require some adjustments in order to be applied to the spec-tators categorization task.
In this paper we also present a new method for
specta-tors categorization, whose framework can be extended to previous methods. As most of the holistic approaches, our method also starts from dense optical flow computation. Then we decompose the flow map into a set of overlapping patches and we describe each patch with five features: x and y coordinates of the patch’s centroid, the average flow intensity I (over all the pixels belonging to the patch), the entropy of flow intensity EI and directions ED(both direc-tions and intensities are quantized to compute the entropy). These feature vectors are then passed to a Gaussian clus-tering with automatic model selection [15], obtaining an in-stantaneous spatial clustering of the patches for each frame. Following, we perform a temporal segmentation based on the similarity between patches: we will call it Patch Simi-larity History (PSH).
Let consider the matrix Hf
τ where each entry Hτf(i, j) mea-sures the similarity between patches pi and pj considering the evolution of patches’ labels until frame f of the video. Hf
τ(i, j) can be computed as: Hτf(i, j) =
(
Hτf −1(i, j) + τ, if Ψf(i, j) = 1 max(0, Hf −1
τ (i, j) − δ), otherwise where τ decides the temporal extent of the similarity in term of frames duration, δ is the decay parameter and Ψf(i, j) is an update function defined as:
Ψf(i, j) = (
1, if Labfi = Labfj 0 otherwise
Labfi and Labfj indicating the labels associated to patches piand pj at the same frame f , during the previous spatial clustering. In such way PSH represents a similarity matrix since it describes how much two patches are similar over time, depending on the spatial cluster to which they belong. By computing the reciprocal of PSH we can obtain a dis-tance matrix and use it to perform a complete linkage
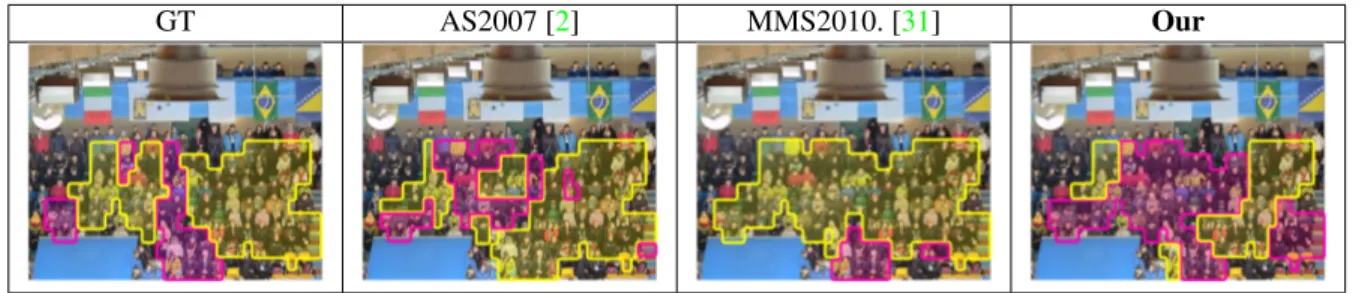
hier-GT AS2007 [2] MMS2010. [31] Our
Figure 5. Qualitative results for spectators categorization. The colored areas represent the two groups of spectators supporting different team.
archical clustering. The result is a dendrogram where clus-ters are defined by cutting branches off the tree. Depending on the height of the cut we can obtain diverse spectators cat-egorization where the clustered patches could represent the whole crowd or a subset of it.
In order to set up the same test protocol for all the meth-ods we divide the scene into overlapping patches. We cre-ated a grid of N p=585 patches with size 64×128px and half a patch size of overlap. Each patch is associated with a ground truth label of the person’s bounding box with the highest overlapping area (if any). The main difference be-tween our method and those in the literature, lies in the fact that the outputs of these methods are based on a frame-by-frame pixels-wise segmentation. So in order to adapt them to our test protocol, we assign to each patch a predicted la-bel corresponding to the most voted within the patch area.
Each method was tested using the standard setting given by the authors. The parameters of the PSH τ and δ have been set respectively to 30 and 1. For the methods that use optical flow it was computed every 10 frames. Table4 shows the accuracies resulting from the spectators catego-rization tasks. Instead Figure5shows the qualitative evalu-ation. The results show that the proposed method is able to categorize the spectator better than the other methods with an accuracy of 62.1%. Since the temporal segmentation was the same for all methods, the best result obtained by our method is probably due to the features extracted from each patch. In fact we are able to describe the behavior of the people from the patches, considering how much they move (with the intensity I) and describing the kind of move-ment (with the flow entropy EDand EI). Further results re-garding the confusion matrices of the experiments and other qualitative results could be found in supplementary materi-als.
4. Conclusions
This paper has introduced S-HOCK, a novel dataset fo-cusing on a brand-new issue, the modeling of the spectator crowd. Our main goal is to promote the potentialities of our benchmark, whose features have been barely exploited in the applications we have taken into account here: actually,
we have focused on some low-level, traditional tasks (peo-ple detection and head pose estimation) and a novel, high-level challenge, the spectator categorization. This choice has been motivated from the fact that on one side we wanted to show the impact that a similar scenario has on the realm of already existent classification algorithms; on the other side, we wanted to disclose one of the many new challenges that a spectator crowd scenario does offer, as the specta-tor categorization. At the same time, we have shown that many are the ways with which the performances of mod-ern algorithms can be improved, and that novel challenges request novel solutions, making the spectator crowd an ex-citing problem to be faced. Many other are the open issues: at a medium level of detail, capturing actions as hugging, clapping hands etc. would be difficult due to the dimension and the dense distribution of the spectators; at a high level of details, understanding groups of people that know them-selves will be certainly hard for the classical approaches of group estimation; in facts, they are usually based on prox-emics principles, here not usable due to the fixed positions of the people.[Davide: Further high level analysis could be on excitement detection (detecting the peak of excitement of the crowd ), crowd/people action forecasting, which is also intriguing since in this case we may consider the be-havior of a person as being influenced by the neighbors and
by the game, etc. Such applications make S-HOCKricher
compared to all other crowd datasets, where usually only the position of the people is annotated (or in some cases
estimated, as in [46]), without ground truth obtained also
from the people in the crowd itself, and where only tasks of counting, tracking and event detection can be assessed, as in [45]. ] Therefore, we are confident that S-HOCKmay trigger the design of novel and effective approaches for the analysis of the human behavior.
[Davide:
Acknowledgments
F. Setti and D. Conigliaro are supported by the VIS
-COSOproject grant, financed by the Autonomous Province
References
[1] J. Aggarwal and M. Ryoo. Human activity analysis: A re-view. ACM Comput. Surv., 43(3):16:1–16:43, 2011.7
[2] S. Ali and M. Shah. A lagrangian particle dynamics approach for crowd flow segmentation and stability analysis. In CVPR, 2007.7,8
[3] E. L. Andrade, S. Blunsden, and R. B. Fisher. Modelling crowd scenes for event detection. In ICPR, 2006.1
[4] O. Barinova, V. Lempitsky, and P. Kholi. On detection of multiple object instances using hough transforms. PAMI, 34(9):1773–1784, 2012.4
[5] A. Berlonghi. Undestanding and planning for different spec-tator crowds. Safety Science, 18:239–247, 1995.1
[6] H. Blumer. Collective behavior. in: A. mcclung lee (ed.) principles of sociology. barnes & noble. In New Outline of the Principle of Sociology. 1951.2
[7] A. B. Chan and N. Vasconcelos. Bayesian poisson regression for crowd counting. In ICCV, 2009.1,2
[8] S.-C. Chen, C.-H. Wu, S.-Y. Lin, and Y.-P. Hung. 2d face alignment and pose estimation based on 3d facial models. In ICME, 2012.5
[9] N. Dalal and B. Triggs. Histograms of oriented gradients for human detection. In CVPR, 2005.4
[10] D. Doermann and D. Mihalcik. Tools and techniques for video performance evaluation. 2000.3
[11] P. Dollar, R. Appel, S. Belongie, and P. Perona. Fast fea-ture pyramids for object detection. PAMI, 36(8):1532–1545, 2014.4
[12] P. Doll´ar, C. Wojek, B. Schiele, and P. Perona. Pedestrian detection: A benchmark. In CVPR, 2009.4
[13] M. Eichner, M. Marin-Jimenez, A. Zisserman, and V. Ferrari. Articulated human pose estimation and search in (almost) unconstrained still images. Technical report, ETH Zurich, 2010.4
[14] P. F. Felzenszwalb, R. B. Girshick, D. McAllester, and D. Ra-manan. Object detection with discriminatively trained part-based models. PAMI, 32(9):1627–1645, 2010.4
[15] M. A. T. Figueiredo and A. Jain. Unsupervised learning of finite mixture models. Pattern Analysis and Machine Intelli-gence, IEEE Transactions on, 24(3):381–396, 2002.7
[16] E. Goffman. Encounters: Two studies in the sociology of interaction.1961.2,4
[17] E. Goffman. Behaviour in Public Places. 1963.2,4
[18] E. Goode. Collective behavior. 1992.2
[19] D. Gowsikhaa, S. Abirami, and R. Baskaran. Automated human behavior analysis from surveillance videos: a survey. Artificial Intelligence Review, 42(4):747–765, 2014.7
[20] J. Jacques, Junior, S. Raupp Musse, and C. Jung. Crowd analysis using computer vision techniques. IEEE Signal Pro-cessing Magazine, 27(5):66–77, 2010.7
[21] S. Ji, W. Xu, M. Yang, and K. Yu. 3d convolutional neural networks for human action recognition. PAMI, 35(1):221– 231, 2013.5
[22] I. Kemelmacher-Shlizerman and R. Basri. 3d face recon-struction from a single image using a single reference face shape. PAMI, 33(2):394–405, 2011.5
[23] L. Kratz and K. Nishino. Anomaly detection in extremely crowded scenes using spatio-temporal motion pattern mod-els. In CVPR, 2009.1
[24] L. Kratz and K. Nishino. Tracking with local spatio-temporal motion patterns in extremely crowded scenes. In CVPR, 2010.1,2
[25] B. Krausz and C. Bauckhage. Loveparade 2010: Automatic video analysis of a crowd disaster. CVIU, 116(3):307–319, 2012.2
[26] A. Krizhevsky, I. Sutskever, and G. E. Hinton. Imagenet classification with deep convolutional neural networks. In Advances in neural information processing systems, 2012.5
[27] I. Laptev. On space-time interest points. IJCV, 64(2-3):107– 123, 2005.1
[28] H. Lee, R. Grosse, R. Ranganath, and A. Y. Ng. Convolu-tional deep belief networks for scalable unsupervised learn-ing of hierarchical representations. In ICML, 2009.5
[29] V. Mahadevan, W. Li, V. Bhalodia, and N. Vasconcelos. Anomaly detection in crowded scenes. In CVPR, 2010.1
[30] C. McPhail. The myth of the madding crowd. 1991.2,3,4
[31] R. Mehran, B. Moore, and M. Shah. A streakline represen-tation of flow in crowded scenes. In ECCV. 2010.7,8
[32] J. Orozco, S. Gong, and T. Xiang. Head pose classification in crowded scenes. In BMVC, 2009.5,6
[33] M. J. P. Viola. Rapid object detection using a boosted cas-cade of simple features. In CVPR, 2001.4
[34] R. Poppe. A survey on vision-based human action recog-nition. Image and Vision Computing, 28(6):976–990, 2010.
7
[35] R. Raghavendra, A. Del Bue, M. Cristani, and V. Murino. Abnormal crowd behavior detection by social force opti-mization. In HBU, pages 383–411. Springer, 2011.1,2
[36] M. Rodriguez, I. Laptev, J. Sivic, and J.-Y. Audibert. Density-aware person detection and tracking in crowds. In ICCV, 2011.4
[37] M. Rodriguez, J. Sivic, I. Laptev, and J.-Y. Audibert. Data-driven crowd analysis in videos. In ICCV, 2011.7
[38] M. San Biagio, M. Crocco, M. Cristani, and V. Martelli, S. andMurino. Heterogeneous auto-similarities of charac-teristics (hasc): Exploiting relational information for classi-fication. In ICCV, 2013.4
[39] P. Sand and S. Teller. Particle video: Long-range motion estimation using point trajectories. IJCV, 80(1):72–91, 2008.
1
[40] J. M. Susskind, G. E. Hinton, J. R. Movellan, and A. K. An-derson. Generating facial expressions with deep belief nets. Affective Computing, pages 421–440, 2008.5
[41] Y. Taigman, M. Yang, M. Ranzato, and L. Wolf. Deepface: Closing the gap to human-level performance in face verifica-tion. In CVPR, 2014.5
[42] D. Tosato, M. Spera, M. Cristani, and V. Murino. Character-izing humans on riemannian manifolds. PAMI, 35(8):1972– 1984, 2013.5,6
[43] B. Wu and R. Nevatia. Detection and tracking of multi-ple, partially occluded humans by bayesian combination of edgelet based part detectors. IJCV, 75(2):247–266, 2007.4
[44] H. Zhong, J. Shi, and M. Visontai. Detecting unusual activity in video. In CVPR, 2004.1
[45] B. Zhou, X. Tang, H. Zhang, and X. Wang. Measuring crowd collectiveness. Pattern Analysis and Machine Intelligence, IEEE Transactions on, 36(8):1586–1599, Aug 2014.8
[46] B. Zhou, X. Wang, and X. Tang. Understanding collec-tive crowd behaviors: Learning a mixture model of dynamic pedestrian-agents. In Computer Vision and Pattern Recogni-tion (CVPR), 2012 IEEE Conference on, pages 2871–2878, June 2012.8
[47] X. Zhu and D. Ramanan. Face detection, pose estimation, and landmark localization in the wild. In CVPR, 2012.5