Scuola di dottorato Vito Volterra
Dottorato di Ricerca in Fisica – XXX Ciclo
Candidate
Giacomo Frangipane ID number 1264196
Thesis Advisor
Prof. Roberto Di Leonardo
A thesis submitted in partial fulfillment of the requirements for the degree of Doctor of Philosophy in Physics
Light controlled motility of Escherichia coli characterization and applications
Ph.D. thesis. Sapienza – University of Rome
2017 Giacomo Frangipane.
This thesis has been typeset by LATEX and the Sapthesis class.
Version: December 20, 2017
Introduction
Physicists have been placing an increasing effort to study living systems. The most natural way for a physicist to approach the complexity of these systems is to start from unicellular organisms such as bacteria. Bacteria are among the simplest form of life on Earth. Nonetheless these microorganisms contain all the molecular machinery to grow, sense the environment and convert energy into movement.
Since the molecular biology revolution in 1950, E. coli has been the bacterial model organism to work with, thanks to its versatility and ease of handling [1]. Indeed it grows easily and quickly, reproducing by binary fission with a doubling time shorter than one hour, and the E. coli derived by the K-12 strain have a biosafety level 1, which makes them manageable in all the laboratories. Quoting the words of Adam Arkin - a pioneer in Synthetic Biology, at the University of California, Berkeley - about E. coli: “Over the course of a hundred years of intense study, we have a huge amount of information about the organism, more than any other on Earth”1. Therefore, not surprisingly, it became the tool of choice in synthetic biology, an emerging field combining engineering principles and techniques of biotechnology to design and construct biological systems for useful purposes [2]. Living cells are like DNA software-driven biological machines, that can be hacked and reprogrammed implementing new features and functions (J.C. Venter 2012). The insertion of rationally designed, complex synthetic gene circuits [3], and the creation of entirely synthetic genomes [4] have been already demonstrated.
Furthermore, from the physics point of view, E. coli is a marvelous example of a self-propelled micro-machine. Bacteria, together with synthetic self-propelled colloids [5], represent the constituent units of most of active matter systems and are classified as ‘active colloids’[6]. These particles have sizes ranging from 5 nm to 5 µm and they can move against viscous forces of the surrounding low-Reynolds number environment by continuosly consuming ‘fuel’ [7]. This constant flow of energy sets them in a framework of non-equilibrium physics [8] where many unusual phenomena, not attainable by passive matter, may appear, such as rectification [9,10], reduced viscosity [11] and collective behaviors [12]. Self-organization, typical behavior in
1
bacterial colonies and flocks of birds, can rise-up in colloidal active systems, providing the route to new forms of micromachines [13] and new active materials reconfigurable at the microscale using external fields [14,15].
In the last 30 years, we witnessed an enormous development of light technologies for spatio-temporal shaping of light at microscale [16,17]. Light intensity patterns can now be almost arbitrarily designed with spatial resolution of micrometers and temporal resolution of microseconds. Combination of the synthetic biology toolkit and these light technologies, paves the way to a light controllable E. coli as active matter with reconfigurable and interactively tunable properties.
This PhD Thesis is divided into two parts. In Part I, after a general introduction to E. coli motility and propulsion mechanism (Chapter 1), we present the results we obtained combining tools from synthetic biology, advanced optical techniques for light shaping and 3D lithography along with digital video microscopy. Furthermore we present the research path we followed to create a novel light controllable mutant E.
coli, using the expression of a heterologous photoreceptor (Chapter2). We exploited these genetically engineered strains as units in bacterial samples whose density can be arbitrarily shaped with light (Chapter 3) and as propellers for light controlled 3D micromotors (Chapter 4).
In Part II we discuss the details of the main methods used in this PhD project. Some of these methods have been also crucial for projects which are not strictly related to the subject of the present Thesis (Section 5.4) and to which I have contributed during the last three years: (i) E. coli swimming in 1D confinement5.4.2
Contents
I Light controlled motility in Escherichia coli 1
1 Escherichia coli motility 3
2 Light controlled motility 7
2.1 Phototaxis - light modulates tumble rate . . . 10
2.2 Photokinesis - light modulates speed (HCB437 PR+ and HLK) . . . 13
3 Light controlled bacterial density 23 3.1 Theory . . . 23
3.2 HCB437 PR+in 2D geometry . . . 24
3.3 HLK in 3D geometry . . . 28
3.4 Discussion . . . 35
4 Light controlled 3D micromotors powered by bacteria 37 4.1 Results . . . 38
4.1.1 3D micromotor design . . . 38
4.1.2 Self assembly of hybrid micromotors . . . 39
4.1.3 Characterization of rotational dynamics . . . 41
4.1.4 Tuning global rotational speed with light . . . 43
4.1.5 Energy considerations . . . 44
4.1.6 Closed loop control of individual micromotor speeds . . . 46
4.2 Discussion . . . 46
II Methods 49 5 Optics 51 5.1 Fabrication using two-photon polymerization . . . 51
5.2 Tracking . . . 52
5.2.1 Reconstruct trajectories . . . 53
5.2.3 Method to distinguish motile and non-motile bacteria . . . . 56
5.3 Dynamic Image Correlation Spectroscopy (DICS) . . . 57
5.4 Microstructures . . . 59
5.4.1 The swimming pool . . . 59
5.4.2 Microtunnels . . . 61
5.4.3 Path invariance chamber . . . 62
6 Molecular Biology 65 6.1 Bacterial Growth . . . 65
6.2 Plasmid Transformation . . . 67
6.3 PCR . . . 70
Part I
Light controlled motility in
Chapter 1
Escherichia coli motility
Escherichia coli, the microswimmer model used in this Thesis, is a rod-shaped
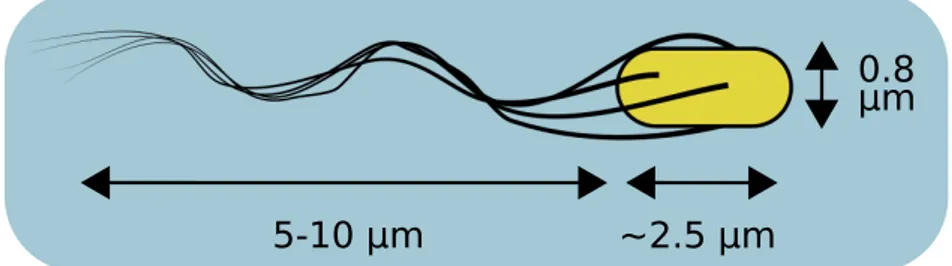
bacterium commonly living immersed in a fluid. It has a length ∼ 2.5 µm, a diameter of 0.8 µm and a mass of 1-2 pg (Fig.1.1). At this microscale, the locomotion strategies of the macroscopic world are ineffective. The world of microswimmers is the world of ‘low Reynolds number’, a world dominated by viscous forces where inertia plays little role [18]. The Reynolds number Re is an adimensional quantity representing the ratio between inertial and viscous forces in a fluid. It is defined as:
Re = ρLU/η, where ρ is the fluid density, η is the viscosity of the fluid, L and U
the characteristic length and velocity scales in the fluid dynamics, respectively. In water ρ ∼ 103 Kg/m3 and η ∼ 10−3 Pa · s, a bacterium moves with speed ∼ 10 µm/s thus Re ∼ 10−4− 10−5, while a small fish lives at Re ∼ 102 and a swimming man at Re ∼ 104− 105. In the microscopic world of E. coli, such small Re allows to neglect the inertia terms in the Navier-Stokes equations that simplifies to the Stokes equations [19]: −∇p + η∇2u = 0 ∇ · u = 0
where in an incompressible viscous fluid u is the velocity field of the fluid and p the pressure. The linearity and time-independence of this equation lead to two important properties of low Reynolds number locomotion [18]. The first is rate independence: the distance travelled by a swimmer undergoing a surface deformation does not depend on the configuration change rate. The second property is the scallop theorem: the net displacement of a swimmer, deformining its shape in a sequence that appear identical if looked back in time, is zero. This theorem cuts out ‘reciprocal deformation’ as possible locomotion mechanisms. However, microorganisms evolved to find different locomotion solutions to overcome these physical constraints, such as the flagellar corkscrew-like motion developed in E. coli [20].
~2.5 μm
5-10 μm
0.8
μm
Figure 1.1. Escherichia coli size and shape. The cell body is approximately a
spherocylinder of length ∼ 2.5 µm and diameter of ∼ 0.8 µm. The bacterium propel himself rotating a bundle of flagella, elongated filaments of variable length 5-10 µm attached to the body.
Indeed E. coli can propel itself at the speed of ∼ 10 bodylengths/s by rotating a bundle of multiple flagella [21]. Flagella are polymers of single proteins flagellin (FliC), forming helical filaments of variable length, tipically 5 to 10 µm, but with a constant diameter ∼ 20 nm [22]. Each of these filaments is connected through the hook to the rotor, the rotating component of the motor inserted in a protein complex forming the stator. The flagellar motor is embedded in the cell envelope, composed by a cell wall inserted between two plasma membranes, the cytoplasmic membrane and the outer membrane (Fig. 1.2). While the inner membrane is slightly permeable to protons, porins (ion channels) inserted the outer membrane make the membrane permeable to protons, setting the periplasm pH to that of the external environment [23]. Thus, as protons translocate to the periplasmic space, an electric potential develops across the inner membrane that acts as the dielectric in a condenser. This electrochemical potential, known as proton motive force (PMF), guides a flow of protons across the membrane powering the flagellar motor. The PMF is the combination of the transmembrane voltage potential ∆ψ, generated by the different concentration of ions species across the membrane, and the contribution of the H+ concentration gradient:
PMF = ∆p = ∆ψ + ln 10kBT
e ∆pH
where ∆pH denotes the difference of pH across the membrane, kB is Boltzmann
costant, T the absolute temperature and e the elementary charge. Adenosin triphos-phate (ATP), the “molecular currency” of intracellular energy transfer [24], does not play any direct role in powering the flagellar motor, differently from other molecular motors. However protons are accumulated against the electrochemical forces by the electron transport chain (the bacterial “respiration”) and by other metabolic
Figure 1.2. Bacterial flagellar motor. This nanoscale motor is embedded in the cell
envelope and powered by flux of proton crossing the inner membrane, rapidly rotate the flagellum (∼ 100 Hz). Modified from [25]
processes involving ATPase, which are enzymes able to release the energy conserved in the ATP phosphate bonds.
Thus, thanks to the motor, flagella spin clockwise (CW) or counterclockwise (CCW), and the direction of rotation influences the swimming behavior of the cell,
defining the characteristic run-and-tumble dynamics. When all flagella spin CCW (looking along a filament from its end toward the motor), they work in unison to propel the cell forming the flagellar bundle. In this “run” state, a cell swims steadily along the direction of its long axis. When one of the motor starts to spin CW the bundle disassembles and the independent motion of flagella induces an erratic dynamics and the reorientation of the cell, that is said to “tumble”. In homogeneous chemical environments, the transition times between these two swimming behaviors are well described by an exponential distribution with characteristic times of τrun∼ 1 s for runs and τtumble ∼ 0.1 s for tumbles [26].
This swimming pattern is coupled to an internal regulatory system that estimates chemical gradients in the local environment (input) and modulates the probability of the following tumbling event (output), resulting in a net movement towards favorite environments. The small size of E. coli bacterium hinders the possibility to sense chemical gradients using spatial measurements. Nonetheless, it developed a mecha-nism to make temporal comparisons of chemical concentrations [27]. E. coli takes its time to understand if the chosen direction is advantageous [28] and different ways of connecting the input and the output lead to a wide range of chemotactic behaviors including climbing gradients of nutrients (Fig.1.3) or ending up in stationary distri-butions that maximize the overlap between bacteria and chemoattractants [29,30]. The chemotactic signal trasduction network relies on the Che proteins and interacts with the motor via the response regulator protein CheY [31]. This protein is
phospho-Figure 1.3. Chemotaxis. E. coli makes temporal comparisons of chemical concentration.
A bacterium that swims up-gradient sense an increasing concentration of nutrients C, the chemotaxis machinery lowers its tumble rate thus increasing directional persistence in the motion. On the other hand when it moves away from nutrients its tumble rate is increased.
rylated (one phosphate group is added) by the kinase CheA and dephosphorylated by the phosphatase CheZ. The phosphorylated form of CheY (CheY-P) binds to the flagellar motor inducing a tumbling response. CheA is controlled by five chemore-ceptors (i.e. Tar, Tsr, Trg, Tap and Aer) reacting to different external input. Kinase activity is reduced when attractants are added inducing a decrease in the tumbling rate (for repellents results the opposite behavior) [32]. The deletion of CheY permits the creation of a mutant strain in which tumbles are suppressed. These bacteria are commonly named smooth-swimmers (e.g. HCB437 [32]). Recent experiments have shown that an unknown cellular pathway regulates E. coli swimming speed, improving the efficiency of chemotaxis, in presence of attractants [33,34] as well as of repellents [35]. This changes in swimming speed can be attributed to chemotactic receptors that directly control the ‘fuel’ available for the motor by regulating the intracellular pH of the cell [36].
Since this bacterium is the most studied organism on Earth, many mutations have been tested on it. The Coli Genetic Stock Center (CGSC) houses an entire database of E. coli mutant strains and, since 1971, has provided lab strains to the
E. coli community. The database contains thousands of strain included a set of E. coli with single-gene knockout of all non-essential genes (the Keio collection [37]). Among all these mutants, many E. coli with modified motility characteristics are present. Moreover the possibility to implement new genes from heterologous host in its the genome expands the possibility to control its swimming behavior for statistical and practical purposes.
Chapter 2
Light controlled motility
In the previous Chapter we talked about chemotaxis as a mechanism developed by bacteria through which they can sense and move along chemical gradients by modulating their tumbling rate (for instance, nutrients or repellents, like glucose or an antibiotic, respectively). Although temporal pulses or steps of chemical stimuli can be delivered with sufficient precision, the spatial structure of the attractant/repellent concentration is hard to control. On the other hand, light patterns can be shaped in time and space with a high degree of control by using spatial light modulators (SLM). The use of light to control microswimmers is a field in rapid growth [38, 15,39] and is appealing for applications [40,41,42].
Light is a source of energy and information for bacteria. Phototrophic bacteria, like all other organisms, need to find the best environmental conditions to grow and replicate. In the course of evolution they have developed many different photosensory proteins to respond to the main stimulus that characterizes their environment: light. These proteins were for a long time considered to be present only in phototrophic bacteria, but light-regulated responses have been demonstrated to be ubiquitous also in chemotrophic bacteria [43]. Photoreceptors are signal-transduction proteins characterized by a region responsible for light absorption, known as chromophore. Light in the visible spectrum can excite the photoreceptor, inducing its conformational change and activating a cascade of downstream events resulting in the signal transduction. Most of these photoreceptors can be classified in six families: rhodopsins, phytochromes, xanthopsins, cryptochromes, phototropins, and BLUF proteins. Each of these families is characterized by a different chromophore or a different photochemistry [44] (Table2.1).
Evolutionary pressure has generated a huge variety of mechanisms to react to changes of ambient light characteristics (i.e. , intensity, color, direction, and degree of polarization) [45]. Since the DNA sequencing was developed, biologists have placed much effort to discover the relevant genes underlying these mechanisms. So
Table 2.1. Classification of known photoreceptor families. Photoreceptors families
are classified on the basis of their chromophore, defining the light absorption spectrum, and of the chemistry underlying its photocycle. From [44].
far we know many molecular and functional characteristics of these receptors that allow microorganisms to exploit ambient light to control internal processes, such as the reorientation of their motion or protein production [45]. The response to light is not a prominent feature of wild-type E. coli. Nonetheless, E. coli expresses the photoreceptor protein YcgF, a BLUF type photoreceptor that, binding to flavin, activates a response mechanism to blue-light.
In recent years, synthetic biology has emerged as a cutting-edge field at the intersection of biology and engineering. Synthetic biology aims at designing and building novel biomolecular components, networks and pathways which are reliable, optimized and interchangeable1. The development of new technologies in DNA syn-thesis and editing offers the possibility to “program” bacteria, introducing synthetic genetic circuits, likewise new “softwares”, thus implementing novel bacterial features and functions. Using these modern tools, it is possible to extend the light response of
E. coli by introducing genes coding for photoreceptors that natively belong to other
organisms. Such genetically engineered E. coli has the ability to “see light” [46]. Furthermore the possibility of expressing in the same bacterium three photoreceptors whose excitation spectra just minimally overlap has been recently demonstrated. This lead to three different responses depending on the wavelength of the light perceived by the bacterium [47]. In this Chapter we discuss the application of the
1
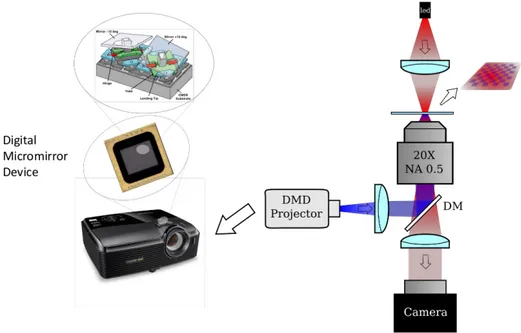
Figure 2.1. Experimental set-up. Combinination of bright/dark field microscopy and a
digital light projector (DLP). The DLP has is core in a digital micromirror device, a chip covered of several thousand of microscopic mirrors corresponding to pixels in the image to be displayed. The DLP has the share the same focal plane of the camera such that we can project arbitrary pattern on the observed region. The sample is confined between two glass slide.
key idea of synthetic biology to set up new methodologies to manipulate a strain of
E. coli thus to obtain light-contrallable motility. Herein we report the description of
the different approaches we used to obtain and characterize the different response to light of both phototactic and photokinetic engineered E. coli strains.
Figure 2.1 shows the set-up we used to characterize the response of these strains. Bright field and dark field illumination have been used to collect digital video on a custom-built inverted optical microscope equipped with a 20x (NA 0.50), 10x (NA 0.30) or 4X(NA 0.13) objective. The light reflected off the chip of a Digital Light Processor (DLP- Texas Instruments DLP Lightcrafter 4500) has been focused on the same focal plane of the camera to excite bacterial photoreceptors. The DLP has its core in a digital micromirror device (DMD), a chip covered of several hundreds of thousands of microscopic mirrors corresponding to pixels in the image to be displayed that can be flipped at high frequency to control light intensity. We wrote a C-library using the application programming interface (API) released by the producer of the DLP to control it through a Python shell. We exploit this library to switch between light patterns arbitrarily shaped in time and space. Moreover we could control the wavelength turning on the desired one of the three led present in the DLP and/or applying bandpass filters.
2.1
Phototaxis - light modulates tumble rate
Wild type (WT) E. coli has only a single photoreceptor protein that causes a modest response to blue light that, in turn, induces a tumbling event [48]. This effect may be due to exopolysaccharide synthesis [49] producing an instability in the flagellar bundle. In 1995 it was observed that E. coli strain with mutations in heme biosynthesis pathway (AW804) exhibits an enhanced photo-repulsive response [50]. The oxygen has to be present to obtain this effect. This was explained by the blue light-mediated sensitization of porphyrin which stimulates the generation of an oxygen species producing a signal for the tumbling response [50,51]. Moreover the fact that blue light has a reduced effect on E. coli mutants lacking the Tsr and/or Tar chemotactic receptors directly relates this effect to the chemotaxis-related function [52]. Since this strain is present in the CGSC we decided to characterize it and explore the possibility to use it to study the connection between the single cell response to external stimuli and the spatial stationary distribution of a population of bacteria.
The preliminary experiments were promising. By creating a blue light spot on the samples we could see an accumulation of bacteria inside the spot, after few minutes of light exposure. However, results were opposite to our expectation, since usually chemotaxis induces bacteria to deplete higher tumble rate regions [26]. Studying the literature on chemotaxis we found a possible explanation for these unexpected experimental results. Tactic behaviors are related to the response of bacteria to an external stimulus. Assuming that the tumble rate λ(t) has a linear relation with the concentration of the stimulus c(t) (the intensity in the case of light), we can write:
λ(t) = λ0[1 −
Z t
−∞
R(t − t0)c(t0)dt0]
where R(t − t0) is the response function and λ0 is the tumble rate value neglecting the environment. From this equation results that, if the shape of R(t) is such that the integral ofR+∞
−∞ R(t − t0)dt0 ≈ 0, waiting enough time, the value λ0 is recovered. The real behavior of bacteria is captured by an R(t) presents a bilobe shape (a positive and a negative lobe) such that bacteria can adapt to the environment. Experiments on mutant strains where the proteins responsible for this adaptation were deleted (∆CheB, ∆CheR) displayed an inverted chemotactic response with respect to the wild type strain [53,54]. Theoretical works also demonstrated that accumulation in high attractant (or low repellent) regions occurs since the response function of bacteria presents this characteristic bilobe response function [28,29,55].
Our results on AW804 could be explained with a blue-induced phototactic behavior lacking adaptation. Therefore we investigated the effect of a blue light
Figure 2.2. Behavioral response of AW804 to blue light. Speed (left) and fraction
of tumblers (right) in response to a step stimulus (at intensity of 2.7 mW/mm2) was given for a period of 30 s (shaded area). Each point represent the average over 1 s of ≈ 80 bacterial trajectories
step stimulus to measure the response function in this strain. We illuminated homogeneously the samples of AW804 with blue light and recorded through digital-video microscopy their motility behavior. Thanks to the tracking software we developed (described in Section 5.2), we analyzed videos and reconstructed the trajectories revealing tumbling events. To avoid oxygen depletion and to more easily track single bacteria, we worked with low dilution samples (≈ 107 cell/mL). The samples were prepared using a glass slide and a cover glass slide glued together with a UV photoresist using as spacer a nylon fishing wire of 70 µm diameter. To reduce impurities, the slides were immersed for at least 24h in a solution of sulfuric acid and a glass-cleaning compound (NOCHROMIX) and then washed with ddH2O.
Figure 2.2shows the change in speed during the run phases v(t) and the fraction of tumblers BCW in response to a blue light step stimulus of the duration of 30 s at blue light intensity of 2.7 mW/mm2. We observed a population average speed decrease of 30% and an 80% increase of the fraction of bacteria in tumbling phase. Our data indicate an extremely slow recovery process from this external perturbation.
Then we studied the role of different light intensities (I) on this effect. We show in Fig. 2.3 the relative jump in v(t) and BCW between the average values before light stimulus and in the last 1 s before the illumination is turned off. As first approximation, data are connected by a linear relation in the range of intensities explored.
We hypothesized that bacteria could not recover completely their motile behavior after light exposure, because of an irreversible photodamage. The restoration we measured is due just in minor part by the recovery of bacteria exposed to light, while the main explanation is that motile bacteria entered the field of view from not illuminated area. Therefore we concluded that if these bacteria are
Figure 2.3. Behavioral response of AW804 as a function of light Relative increment
of speed (left) and fraction of tumblers (right) when a sample of AW804 is exposed to a blue light step stimulus, respect to their values before that light is turned on. Data are reported as function of the light intensities. The light is kept on for 30 s and the last second in the blue response is used to evaluate the relative increment.
illuminated for more than few minutes, they become irreversibly non-motile. Using this method we can just temporarily accumulate bacteria in a region, irreversibly damaging their flagellar motors with light. But waiting longer, all the bacteria in the field of view would be non-motile and would behave as passive particles covering homogeneously the entire area. We concluded that this strain is not good for our purpose. Nevertheless, the study of this system was a challenge for me, since it was my first approach to bacterial motility, and we learned much on the light response of bacteria. First conclusion of this experiments is: when you work with E. coli avoid blue light!
Then we moved to another possible mechanism of light-control. We successfully trasformed E. coli RP437 [56] (WT for chemotaxis studies) with two different plasmids codifying chimeric receptor proteins that link light to the chemotaxis machinery. These proteins are a fusion of the sensory rhodopsin belonging to
N. pharaonis with the cytoplasmic domain of Tar or Tsr, both methyl-accepting
chemotaxis protein receptors (MCP) from enteric eubacteria such as E. coli [57]. As previously reported, we expected that the correct folding of these proteins in the membrane should induce a phototactic behavior, reducing the tumbling rate in the Tar-fusion case (NpSRII-NpHtrII-StTar) and increasing it for the Tsr-fusion one (NpSRII-NpHtrII-EcTsr) [57].
From preliminary experiments we established that light could just slightly influence the motility behavior of these strains. The strain expressing the Tar-fusion protein was already smooth-swimming in absence of the light stimulus, while the one expressing Tsr-fusion was tumbling continuously (data not shown). One hypothesis to explain this phenomenon is that this effect is induced by the overproduction of
in this system. But in parallel to this experiments we were working with the photokinetic E. coli, described in details in the next Section.
2.2
Photokinesis - light modulates speed (HCB437 PR
+and HLK)
Photokinesis is the regulation of speed in response to light stimuli, inducing a modification in the energy supply to the flagellar motor [60]. In the past, the only known way bacteria could harvest energy from light was through photosynthetic centers, complex structures executing the first step of photosynthesis. In 2000 the seminal discovery of proteorhodpsin (PR), a light-powered proton pump, changed the way to look at phototrophy in bacteria [61]. This discovery represented an early success story of community metagenomics, the study of genes recovered from environmental samples. It paved the way for further studies demonstrating that this phototrophy alternative mechanism, requiring much fewer genes as compared to the photosynthetic machinery, is extremely common in marine bacteria [62]. The world’s oceans contain an estimated 1028 PR-expressing bacteria, placing them among the most prevalent organisms on Earth [63]. Furthermore, differently to bacteriorhodopsin, another light-powered proton pump, PR may be correctly folded in E. coli membranes [64]. Moreover PR provenient from different bacteria can have various absorption spectrum [65], opening the possibility to tune the excitation wavelengths depending on the need. These characteristics make PR an ideal tool for a wide range of applications in synthetic biology, such as production of chemicals through microbial cell factories powered by light [66].
In 2007 Walter et al. [67] were able to use PR expressing (PR+) E. coli cells to power its flagellar motor absorbing light. The speed of the flagellar motor is proportional to the PMF [68,69], therefore, the outer proton flux created by PR, in presence of light, can power the rotation of the flagellum when H+ re-enter the cell through the motor. However cells can benefit of light-driven proton pumping just under certain environmental conditions [70, 71]. The authors [67] demonstrated that the flagellar motor speed can be controlled with green light (532 nm) in single smooth-swimmer cells PR+, tethered on a glass slide in an environment where the PMF could not be maintained by oxidative phosphorylation.
To clarify the relationships among PMF, respiration and light, they constructed a simplified model of E. coli H+ membrane fluxes. Multiple proton pumps can
contribute to the PMF buildup, such as the respiratory chain, the ATPase and the PR (Fig. 2.4a). This PMF is consumed by the flagellar motor and numerous transporters (e.g. Na+/H+ antiporter). In addition, the bacterial membrane has a basal permeability to protons [72]. In a simpler system, liposomes with only one kind of ion pump, the magnitude of the steady-state PMF is well approximated by a simple RC circuit [73]. Thus Walter et al. proposed the analogous circuit in Figure 2.4b to capture the functional relationship between PMF, respiration and PR inserted in a membrane with sinks. A voltage generator with a variable resistor in series is used to model both the variable PMF yield of respiration and PR. Those two components are posed in parallel with a resistance (Rsink) and a capacitor (C) representing proton sinks and the membrane, respectively. In absence of oxygen, respiration does not contribute to PMF, and this is equivalent to send
Rres→ ∞ cutting out that branch from the circuit. This model set the maximum speed proportional to PMF to just the one generated by the PR:
PMFPR= VPRRsink
Rsink+ RPR(I) (2.1)
where the dependence of RPR(I) from light intensity I is captured by Michaelis-Menten kinetics model:
RPR(I) = ( VmaxI
Km+ I
)−1 (2.2)
where Vmax set the maximum value at which the effect of PR is saturated. The
dynamics of this system, when the light is reduced is described by:
PMFPR(I, t) = V0exp (− t
τoff) (2.3)
where V0 is set by the initial condition t = 0, PMFPR is defined above (Eq. 2.1) and τoff= ReffC. The effective decay resistance Reff is the parallel of RPR(I) and
Rsink. The PMF thus decays exponentially to a steady state with a time constant determined by the new level of light I.
In the original work [67] oxidative phosporylation was blocked using azide, a poison inhibiting the cytochrome c oxidase, the last step of the oxydative phosphory-lation that transfer electrons from cytochrome c to oxygen. We reasoned that, rather than employing this poison it would be easier to let the cells deplete the oxygen directly from inside the sample, thus removing the last acceptor for the electron transport chain (respiration). This is supported also by data showing that in absence of anaerobically metabolizable nutrients (e.g. glucose, serine), when the oxygen ends, the PMF falls abruptly inducing a motility transition in the sample [74]. The inverse of the time necessary to obtain this transition and the concentration of cells
Figure 2.4. Proton fluxes. (a) Overview of transmembrane fluxes and proton pumping
in E. coli with proteorhodopsin (PR). Respiration and PR are responsible of proton gradient buildup, while rotation of the flagellar motor and ATP synthesis can consume this proton motive force. (b) Model including sources of PMF (respiration and proteorhodopsin), sinks (such as the flagellar motor and ATP synthase), and the membrane capacitance. The variable resistors Rresand RPR model the effect of azide and light on proton extrusion by respiration and PR, respectively. The voltmeter (top-most circuit element) measures the potential difference across the membrane (equivalent to the PMF). Modified from [67].
in the sample are linearly related [7]. Thus we work with high cell density samples (> 5 · 108 cells/mL), since the higher the cell density, the shorter the time to wait before the experiments can get started. Moreover, at low concentration bacteria would consume their reserves of energy before oxygen is depleted. This leads to a different linear decay of the speed for each bacterium, given the broad metabolic state in the sample. Consequently, the response to light will be broader in the population, since cells would be kept at ∼ 0 PMF at different times. It is known that when the flux of protons through the motor stops, the stator proteins MotB dissociate from the motor at an increased rate [75]. Motors disassemble and MotB molecules float around the cell. When the PMF is restored, MotB can be again recruited by the motor and the rotational speed recovers in stepwise increments, resulting in a process called motor ‘resurrection’ [76]. But if the cells are kept to zero PMF for more than few minutes, the disassembling of the motor becomes not completely reversible and some of the cells cannot recover their motility.
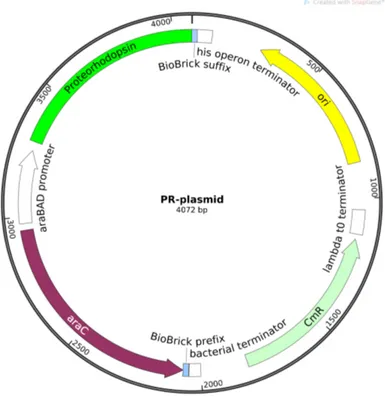
Keeping in mind all these mechanisms, in our laboratory we constructed a system inspired by the one described above. We introduced inside the smooth-swimmer HCB437 [32](RP437 gutted for all the chemotaxis genes) a plasmid codifying the proteorhodopsin by using plasmid transformation described in details in Section6.2. The plasmid is composed of the backbonepSB1C3(the standard cloning vector for iGEM parts), and the partBBa_K1604010 codifying the proteorhodopsin under an arabinose inducible promoter. Genes operably linked to this kind of promoters can
Figure 2.5. Map of the plasmid codifying the proteorhodopsin (PR). The
expres-sion system araC-pBAD increase protein production of PR in presence of L-arabinose. The chloramphenicol resistance (CmR) is used as selectable marker
be turned on adding L-arabinose from the external, while in its absence the gene is not expressed. The inducible regulation of gene expression is a key point for the correct operation of our system, since overexpression of the heterologous PR is toxic for the cell.
We then moved to characterize this strain, hereto referred to as HCB437 PR+. Preliminary experiments show that we were able to visibly see the speed increase induced by light exposure. We then combined the tracking software we developed (Section 5.2) with the “swimming pool” microstructure (Section 5.4.1), a device which let us to select only motile bacteria and to confine them in a pseudo-2D geometry. This allowed to obtain informations on the response dynamics to light of our HCB437 PR+ strain.
We activated the PR, exposing bacteria to a light square wave with a 20 s period. In these experiments the green light illumination has been achieved using the green led of the DLP, screened using a bandpass filter to obtain the excitation in the desired spectrum region (Thorlabs FBH520-40). We recorded the response using dark-field video microscopy at 50 fps. We analyzed these videos and tracked moving cells inside the “swimming pool” for different light intensities I (Fig. 2.6a). To filter out non-motile bacteria from the analysis, the trajectories that were slower
0
20
40
60
80
100 120 140 160 180 200 220
t (s)
0
1
2
3
4
5
6
v (µm/s)
a 0.4 mW/mm2 0.8 mW/mm2 1.5 mW/mm2 2.8 mW/mm2 5.0 mW/mm2 7.7 mW/mm2 10.1 mW/mm2 11.2 mW/mm20.0 2.5 5.0 7.5 10.0 12.5 15.0 17.5 20.0
t (s)
1
2
3
4
5
v (µm/s)
b0
5
10
I (mW/mm
2)
3
4
5
v
max(µ
m
/s)
c0
5
10
I (mW/mm
2)
0.5
1.0
on(s
)
d0
5
10
I (mW/mm
2)
5
10
15
of f(s
)
eFigure 2.6. HCB437 PR+ temporal response to light. (a)Speeds in response to a green light square waves of period 20 s (light is turned on at 10 s), each color represents a different levels of light intensity. The curves are averaged on the bacterial tracks whose speed is higher than 2 µm/s during light exposure. Cells are kept at 0.4 mW/mm2for t < 0. (b)
Speeds averaged over 9 periods, the line represent a fit with two exponentials. (c) maximum speeds, (d) raise and (e) decay characteristic times in function of intensity obtained from the fits.
than 2 µm/s during the light were not taken into account. Thus, we considered bacterial tracks that could be reconstructed for at least 2 s during illumination intervals. To avoid the possibility to include the motor “resurrection” dynamics in the measurements, the sample was kept at low light (0.4 mW/mm2) before measurement started. To quantify maximum speeds, raise and decay times, we compute the average over 9 periods, skipping the first, considering that in this period the cells have different starting states. The maximum speeds we obtained (Fig. 2.6c) show that PR pumping is saturated at high I as previously reported [67]. Furthermore, observing many HCB437 PR+samples, we realized that the electrical circuit model is not capturing the entire process. When the light is turned off after a prolonged exposure the speed decay present two time scales (data not shown). However the model (Fig.2.4b) predicts a speed decay with a single characteristic time τoff that does not depend on the intensity level. By contrast, the measured τoff actually increases with the duration of the illumination (data not shown), as well as with the intensity, while τon decreases (Fig.2.6d,e). In the circuit model (Fig. 2.4) the ATP-synthase is considered a sink without any difference with the flagellar motors. However, protons that translocate across membranes by proteorhodopsin, generate a PMF that can drive ATP synthesis as protons re-enter the cell through the ATP-synthase complex [77]. The ATP accumulated in the cell can later be used, thanks to ATPase, to fuel cell motility at low speed for prolonged time (∼ minutes). Both these effects are related to the ATPase and increase the response time, hampering the prediction of the light response dynamics.
To avoid this effect and to obtain a faster response swimmer, we explored the possibility to delete the ATPase gene from our strain. In a one-step transformation, we replaced the unc operon (encoding ATPase) with the PR gene. The switch between these two genes, both codifying transmembrane proteins, is obtained through the protocol described in Section 6.4.
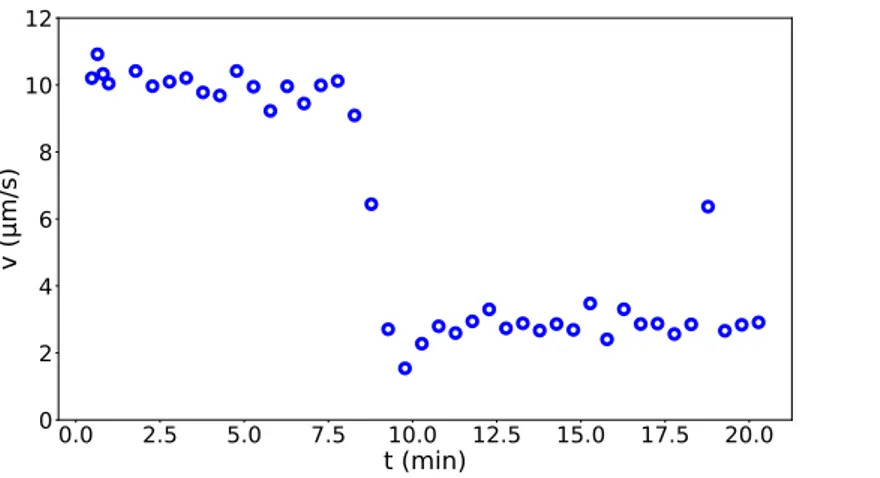
To statistically characterize the dynamics of the new strain we engineered, hereto referred to as HLK, we use dynamic image correlation spectroscopy (DICS). DICS allows to analyze digital microscopy videos of high concentrated samples and to extract information about the dynamics from the intermediate scattering function (ISF) [78] (Section5.3). Thanks to this technique we can easily monitor the cells during the oxygen depletion inside the sample and measure the speed during the motility transititon (Fig. 2.7).
We project onto a high concentrated sample (≈ 5 × 10⁸ cells/mL) a green light pattern composed of 4 × 3 squares with side length of 360 µm. Each square has a different level of green light intensity (Fig.2.8a). Image acquisition is performed after 1 min since pattern projection, to ensure that the stationary speed at that intensity
0.0
2.5
5.0
7.5 10.0 12.5 15.0 17.5 20.0
t (min)
0
2
4
6
8
10
v (µm/s)
Figure 2.7. Oxygen and the motility transition Average speed of Hulk monitored
after the sample is sealed. At high density cells (∼ 109cells/mL) the oxygen is depleted in a
short time and we can observe an abruptly fall in the speed caused by anaerobic condition.
is reached. Analysis is carried out by applying DICS separately to each different region. To avoid out-of-stationarity effects at the border, we crop inside each region another squared region of side length 232 µm, containing information about the dynamics of ≈ 2000 cells. The experiments have been repeated 15 times, between each measurement a homogeneous green pattern (≈ 6 mW/mm2) is projected to avoid density modulation induced by spatially modulated speed [79]. In Figure2.8b we show the intermediate scattering function Fq(t) at three different level of light.
Increasing the speed of bacteria with light we measure a faster decay in the Fq(t)
as we expect. By fitting the Fq(t) obtained from DICS, we extract informations about the fraction of motile bacteria, the average and the standard deviation of their speed distribution, and the thermal diffusion coefficient, respectively α, hvi, σ, and D in function of the intensity I (Fig.2.9). The hvi in function of I shows the typical hyperbolic behavior described in Eq.2.1 and Eq. 2.2. We added a baseline to the hyperbola since we could not reach complete zero motility in absence of light. Catabolism let bacteria propel themselves in absence of external nutrient. Fitted data result in a maximum speed jump of 6.13 ± 0.17 µm/s with a baseline of 2.31 ± 0.23 µm/s (Fig. 2.9a). The measured D is compatible with previous work [80](Fig.2.9b). Furthermore, we observe a slight enhanced diffusion induced by increased activity of the bacterial bath despite the reduced number of motile bacteria in the higher speed regions (Fig.2.9c) [81, 79]. We also note that the ratio
hvi
σ remains constant at all values of I explored (Fig. 2.9).
To explain this linear relation between hvi and σ we introduce a simple model that describes the variability in the response to light in the bacterial population. We represent each bacterium in the population by an analog circuit 2.4b with
Figure 2.8. (a) Pattern projected on the sample to study bacterial response at different
light intensities (b) Circle represents the recostructed ISFs of an HLK sample at three different light intensities. The line is the ISF fitted using the model described in Section 5.3 information at q = 1.61 µm-1. Increasing the light level the ISF decorrelate faster in
agreement with the cell speed-up.
0 2 4 6 8 10 12 14 16 I [mW/ mm2] 2 3 4 5 6 7 8 v [µm/ s]
a
σ [µm/ s] 0 2 4 6 8 10 12 14 16 I [mW/ mm2] 0.25 0.30 0.35 0.40 0.45 0.50 0.55 0.60 D [µ m 2/s ] 0 2 4 6 8 10 12 14 16 I [mW/ mm2] 0.2 0.4 0.6 0.8 1.0 α 0 2 4 6 8 v [µm/ s] 0 1 2 3 4 5 6 σ [µ m /s ]c
d
b
Figure 2.9. Strain characterization in function of light intensity The plots represent
bacterial (a) speed distribution average of hvi and standard deviation σ, (b) “passive” diffusion coefficient D and (c) fraction of motile α measured with DICS. (a) The line represents the hyperbola fitting the power density dependence of the speed. (d) We report the relationship between σ and hvi.
level of PR expression. Then we can define RPR(nPR) as the equivalent resistance for a bacterium expressing nPRPR. Follows that RPR(nPR) = RPR(1)/nPR, resulted from the parallel of nPR identical PR branches composed by a generator VPR and a a resistance RPR(1) (corresponding to that of a single PR). Assuming, as measured by [67], that Rsink<< RPR(nPR) independently by the light intensities, combining
this simple model to describe the variability in proteorhodopsin expression with equations Eq.2.1and Eq. 2.2, the speed at the stationary state is:
v(I) ∝ P M F (I) ∝ f (I)
RPR(nPR) ∝ nPRf (I)
where f (I) contains all the dependence of the speed by the light intensity and it is equivalent for each bacterium. This means that each speed in a bacterial population scale with the same factor depending only on the light intensity thus the speed distribution P (v, I) = P (f (I)v). This relation set a constant shape profile of the speed distribution as function of light, thus explaining the linear relation between hv(I)i and σ(I). This simple explanation does not depend on any assumption describing the variability in the bacterial population given by the system that transduce the PMF in swimming speed (e.g. number of flagella, length of the flagella).
When we illuminate a region, the more responsive bacteria exit from the border reaching a dark area that the light emitted by the DLP cannot reach. This effect induce depletion of bacteria from the field of view affecting the measurement. For this reason we decided to measure simultaneously the speeds for twelve different intensities using the pattern shown in Figure 2.8. As raw estimation, we can consider the system as a squared 2d space where the dark area is like a sink and the density inside the light area immediately re-equilibrate to be homogeneous. In this simple model the number of bacteria goes down following dNdt = ρLdt2 = −ρvL. Assuming as ρ0 the initial density we can write the time dependence of the density as ρ(t) = ρ0e−vLt. Using the reasonable values of L ∼ 1 mm, v ∼ 10 µm/s, we find that the density inside the circle is halved in ≈ 70 s. This estimation does not capture the whole process, since we do not take into account the counterbalance action of diffusion of non-motile bacteria from outside and the time required for cells in the illuminated area to travel to the borders. However, it gives us an idea of the order of magnitude of this temporal decay. Most importantly, we observed that the density modulation in our samples occurs on the minute scale. This effect will be
described in details in Chapter 3. We will also report how the HLK strain let us improve our results thanks to its quicker response compared to HCB437 PR+ strain.
To obtain the correct expression of PR in HCB437 PR+and HLK bacteria the presence of its chromophore, the all-trans-retinal, is required. Since these strains do not produce the chromophore autonomously, we supplement the growth medium with 20 µM all-trans-retinal when the culture reaches an OD590 ≈ 0.2 (Section 6.1
for details). For applications in self-sustaining sample it would be possible to let the bacteria produce this cofactor by itself, implementing the synthetic pathway “programmed” for this purpose [82,77]. In the last year two studies revealed the mechanism of two different xenorhodopsins, a new class of microbial rhodopsins, as light activated inward H+ pump. One is relative to the deep ocean marine bacterium Parvularcula oceani (PoXeR), while the other to the nanohalosarchaeon
Nanosalina (NsXeR) [83]. We believe that this kind of pump could reveal an alternative optogenetic approach substituting the PR in light controlled E. coli. We consider that, since these proteins do not require anaerobic environment to work properly, they could improve the speed control and the maximum working speed.
Chapter 3
Light controlled bacterial
density
Density modulation with light is a typical behavior of phototactic organisms [84,85]. Previous experiments show that density modulation of E. coli could only be obtained through temperature and chemical gradients [36]. However the control of these gradients is limited by spatial and temporal resolution. By contrast, complex light patterns with details at the single-cell scale (∼ 1 µm) can now be dynamically modified by projecting the DMD chip directly onto the sample. In this Chapter we (i) present a classical model describing the density evolution of run-and-tumble particles whose swimming speed is modulated in space; (ii) demonstrate that light controlled density modulations can be obtained using the HCB437 PR+photokinetic strain in 2D confinement; (iii) show that arbitrarily shaped density patterns can be built in the bulk, by the use of the HLK strain, furthermore improving their spatial definition by the implementation of a real-time feedback loop; (iv) discuss how our results can be exploited for novel applications in active matter.
3.1
Theory
In 1993, Schnitzer proposed a model to describe bacterial chemotaxis that established a relation between the velocity profile and the stationary density for run-and-tumble particles in 1D [79]. Particles move in a direction with speed module v(x) and change speed direction with a constant rate λ (tumble rate). The equations, derived from the continuity in the flow and the conservation of particle number, can be written
as: ∂R ∂t = − ∂(vR) ∂x − λR 2 + λL 2 ∂L ∂t = ∂(vL) ∂x + λR 2 − λL 2 (3.1)
where R and L both depend on (x, t) and represent the densities of the particles moving to the right and to the left, respectively. Defining the total density of particles ρ = R + L and the unbalance between right moving and left moving particles σ = R − L, Equations 3.1can be re-written as:
∂ρ ∂t = − ∂(vσ) ∂x ∂σ ∂t = − ∂(vρ) ∂x − λσ (3.2)
Defining the net flux of particles as J (x) = v(x)σ(x) and imposing it to vanish at the boundaries, the solution for the stationary state is σ = 0, which corresponds to a situation of a balanced density of right- and left-moving particles. Furthermore, it holds that:
ρ(x) = ρ0 v0
v(x) (3.3)
resulting in the possibility to tune the bacterial density, solely modulating their speed. These same results can be recovered by modeling bacterial dynamics as that of particles subjected to gaussian coloured noise in 1D [86].
The key idea to bear in mind for the experiments is that turning off the propulsion in a region of the system leads to an accumulation of particles, while increasing the propulsion leads to a depletion.
3.2
HCB437 PR
+in 2D geometry
Compared with the theory, the experiments are complicated by the biological nature of our microswimmer model, and are strongly affected by the delayed response to light. We started by projecting a green light pattern with a circular dark hole in the middle on samples of HCB437 PR+bacteria sealed in glass capillaries or between two glass slides, since at that time the HLK strain was not available yet. We tested the samples in different conditions, changing the distance between top and down surfaces in a range from 20 µm to 400 µm. In these geometries, the combination of 3D-swimming and the history-dependent light response dynamics (due to ATP production) flattens the observed velocity profile, despite the steep gradients in the projected light pattern. Indeed, we did not observe any relevant density modulation
entity, but it lives immersed in a liquid with other particles. There are many studies demonstrating that interacting systems at high density in homogeneous media give rise to a broad spectrum of interesting phenomena (e.g. motility-induced phase separation (MIPS) [87], collective behaviors [88]). We thought that combining steric interactions with our light-driven bacteria, we could obtain a relevant modulation of the density, in a similar fashion to that previous proposed in numerical works of ‘light-driven’ active particles [89,90]. However we could obtain a maximum density that of 1010cells/mL, corresponding to a cell-body volume fraction φ ≈ 0.02 (considering a bacterial volume of 2 µm3), too low to obtain relevant interaction effects. To taking advantage of these further interactions, we designed and fabricated a microstructure with quasi-2D geometry. This device (described in details in Section 5.4.1) allows to increase the density of motile bacteria in our field of view and make the most of steric interactions [91]. We believe that bacterial collisions, and consequently alignments and reorientations, change the shape distribution of path length of E. coli going through a dark area. The more bacteria follow longer path to find the exit from a given low motility region, the greater the probability that they finish their fuel (pmf) and get “trapped” inside the dark, low motility region. Moreover, as for MIPS, when the density of cells starts to increase in this region, then the probability to get “trapped” there becomes higher as well, establishing a positive feedback.
Figure3.1shows the results we obtained by projecting in the field of view a green light pattern (1.5 mW/mm2) with a circular dark region in the middle. We varied the radius of the dark area to see how the radial density profile could be affected by this change. We see that increasing the radius of the circle, the accumulation peak moves out from the center of the structure.
This phenomenon can be captured also by the simple RC circuit model described in Section2.2. According to this model, a bacterium is trapped in the dark if the path length of its trajectory in the dark reaches v0τoff, where v0 is its speed when it enters the dark region (otherwise it would escape) and τoff is the characteristic time of the speed exponential decay (Eq. 2.3). We simulated this system in the case of non-diffusing and non-interacting straight swimmers, and we observed the accumulation of all particles in the circle only for R > v0τoff, otherwise we could get just a slight density modulation. The next step was to put our effort in figuring out some model to fit the experimental data strongly chatacterized by the ATP production dynamics that increase τoff in an unknown way.
In the experiment just described the green light intensity corresponds to low speeds. Looking at the experimental data on the time response of this strain (Fig.2.6)
Figure 3.1. Projecting circles We show the accumulation of HCB437 PR+bacteria inside
the dashed circle induced by the green illumination pattern outside the (1.5 mW/mm2). We show the results for 6 different radii between 31 µm and 92 µm. For larger radii the accumulation of the cells at the boundary of the circle can be observed. Cells produce less ATP given the smaller illuminated area inside the structure and cells need less time to stop in the dark region. Bacteria are confined between a coverglass and a microfabricated roof in a pseudo-2D geometry. The white spots in the images represent columns holding up the roof and fixing the height of the chamber at ≈ 1.4 µm. The scale bar is 10 µm.
20
40
60
80
100
r [µm]
0.02
0.04
0.06
0.08
0.10
[µ
m
1]
0.00
0.25
0.50
0.75
1.00
1.25
1.50
1.75
2.00
r/R
0.02
0.04
0.06
0.08
0.10
[µ
m
1]
b
R=31 µm
R=46 µm
R=53 µm
R=61 µm
R=76 µm
R=92 µm
Figure 3.2. Radial density profiles. (a) Radial density profile obtained from the
analysis of the data shown in Fig.3.1. (b) Profiles plotted rescaling the x-axis with respect to the radius of the dark circular region R. It can be observed that the accumulation peak moves towards a value of 1.0 as the circle radius increases. This effect is due by the finite stopping time of bacteria in dark regions.
we realized that higher intensities would give a boost to the ATP production, thus increasing memory effects (τoff, τon). We started to study how the radial stationary distribution would be affected by light intensity, and how the memory effects would influence the final distribution. We observed that the accumulation did not have place when the light outside was increased. Unfortunately, during these measurements, we experienced some problem. First of all it was hard to define a stationary state since the chamber was continuosly depleted of motile bacteria. Since the DLP cannot power bacteria in all the sample but, just in a limited area, bacteria tend to escape from this area and accumulate at the boundary. To reduce this effect we projected just a green annulus with internal radius of 60 µm and the external of 120 µm (≈ the size of the structure), rather than projecting a full green pattern outside the circle. In this way we can increase the time for completely deplete the bacteria inside the chamber. After more than one year of experiments with the microstructure device and without any change to the fabrication protocol, we could not get anymore chambers perfectly adhering to the coverglass. This experimental complication, coupled to the idea of canceling out the ATP production (as described in Section 2.2) halted our work in this direction for the moment. We hope to solve this problem in the future, hopefully leading us to fully understand the connection between the PR and the ATP production.
Sample preparation and observation To prepare the samples for this ex-periment we fabricated the microstructure on a microscope cover glass. Then we dried on this same glass a solution of 10 µm-diameter silica beads (∼ the height of the structure). A drop of motility buffer (≈ 1 µL) is placed on the microstructure to prefill it, otherwise bacteria would be quickly sucked inside the structure for capillarity and the entrances would get clogged. The cover glass is placed on the glass slide and filled thanks to surface tension forces with a suspension of HCB437 PR+(∼ 5 · 109cells/mL). The right amount of liquid is used to avoid lifting of the glass from the microstructure roof. This accuracy allowed us to get rid of a relevant background from out-of-focus swimmers. We sealed the sample using vacuum grease. Dark field images are collected on an self-built inverted microscope equipped with a 20x (NA = 0.5) objective and a high-sensitivity CMOS camera (Hamamatsu Orca flash 2.8)
3.3
HLK in 3D geometry
The HCB437 PR+ strain is not the best strain to be used for obtaining density modulations and a model to predict the spatial speed field in presence of a light pattern is not available. This is due to the ATP dynamics, which introduces big
To reduce non-locality in cell dynamics we created the HLK strain by excluding the ATP dynamics from the process (Section2.2). A shorter τoffleads to an increased resolution of colony shaping. Actually, the first time we projected the green pattern with a dark circle on a hypoxic sample of HLK cells, we were surprised by the precision in the definition of the bacterial accumulation we could obtain.
We then immediately started to project more complex patterns in the sample. We applied this system to reproduce the bacterial portraits of people special for us, such as: Albert Einstein, Charles Darwin and the legendary captain of football club A.S. Roma, Francesco Totti. Figure 3.3 shows the average of one minute of dark-field microscopy images aquired (at 1 fps) after the sample is exposed for 3 min to the light pattern presented in the right panel. Similar to that observed for the 2D system, cells moving from illuminated area stop swimming and start accumulating at the boundary of the dark region, increasing the density in a 20 − 30 µm width band. Assuming the exponential decay predicted by the RC circuit analog and knowing the measured stationary speed (Figure2.9), we could estimate a maximum τoff∼ 3 s. We did not measure it directly since tracking is not available at the required density, and DICS is not optimal to obtain time dependent measures. However, looking at the samples with our own eyes, this estimated upper limit appeared not too far from the reality, although the larger part of the population responds with a shorter characteristic time <1 s.
Interestingly, we demonstrated that the assembled patterns are reconfigurable in real time. Tens of thousands of bacteria reproducing the image of Albert Einstein, an icon for physicists, are guided in few minutes to resemble Charles Darwin, an icon for biologists, (Fig. 3.4a) just changing the pattern illuminating the sample. To estimate the time necessary to obtain the reconfiguration, we have to define a quantity representing the distance between the obtained density ρ(x) and the desired one ρtarget(x). We chose the squared target distance:
χ2 = h∆ρ2i
where h · i stands for the average value over every pixel in the field of view and ∆ρ(x) = ρ(x) − ρtarget(x). To evaluate χ2 we first need to estimate the density ρ(x).
In dark-field microscopy, neglecting multi-scattering, all particles in the focal plane are visualized on the camera, and trasformed through the point spread function. Since each frame represents a configuration of particles, the average density of the particles (ρ) is related to the frame average over a time window (F ) by a linear
Figure 3.3. Density control with light. On the left we show the average density of
Hulk cells after the sample is exposed for ≈ 3 minutes to the light pattern (on the right). Cells moves away illuminated region, depleting them. When they swim into the dark, their motility goes down and they become trapped, creating an accumulation region of 20 − 30 µm width.
relation:
ρ(x) = aF (x) + b
where a is a scaling factor that makes ρ independent by the illumination level, and b takes into account for a baseline level given by bacteria out of the focal plane as well as impurities that may be present in the sample. To evaluate these two parameters we tested two different methods. The first one is based on the calculation of the two parameters minimizing the χ2(a, b) obtained by resolving the equations:
ahF i + b − hρtargeti = 0 ahF2i + bhF i − hF ρtargeti = 0
However, this method improves the χ2 giving big weight to the pixels found at the extreme of the intensity distribution, thus neglecting the grey scale dynamic range. Then, to avoid this problem, we decided to apply to our data the second method, more phenomenological and based on histogram stretching. We rescaled the histogram of pixel intensities such that the 10th and the 90th percentiles of ρ(x) are the same of ρtarget(x).
Figure3.4b shows the normalized χ2 measured relatively to the “Einstein” and “Darwin” pattern (Fig. 3.4c1,c2). The time evolution of χ2, after the pattern switch at t = 0, is well fitted by an exponential with a baseline. The dynamics of disassembly and assembly of a pattern are on the same time scale, the characteristic times fitted
0 50 100 150 200 250 300 time (s) 0.0 0.2 0.4 0.6 0.8 1.0 no rm al iz ed s qu ar ed d iff er en ce
b
c1
t =
0
t~4 min
1 mm
c2
a
Figure 3.4. Dynamical control of density. (a) About 50000 Hulk cells are made to
morph from Einstein to Darwin by spatially and dynamically modulating the swimming speed with light. Cells appear in white in dark field microscopy. At time t = 0 we switched the illumination pattern from (c1) to (c2). (b) Orange and blue circles represents normalized values of χ2 relative to the target density in Figures (c1) and (c2) respectively. Data are
well fitted by an exponential plus a baseline (solid lines). The time scale of this phenomenon is captured by the fitted characteristic times (τ1= 107.3 ± 6.4 s, τ2= 90.3 ± 6.6 s).
are τ1= 107.3 ± 6.4 s and τ2 = 90.3 ± 6.6 s, respectively.
Not satisfied with this result, we decided to improve the quality of our portraits by introducing a real-time feedback loop regulating the light pattern. We were able to refine the details of the images in the areas in which they diverged from the desired result. This approach allowed us to avoid to build a complicated model that hat to take into account all the biological complexities (e.g. τoff, stator disassembly [75] and aging of the sample) to optimize the illumination pattern for a ρtarget. The feedback
loop we designed stands on the key idea that increasing the light power I(x) on the area around x leads to a density decrease ρ(x). We found the transformations connecting the DLP and the camera, such that one pixel of the DLP resulted in a 1.94 µm-side square once projected onto the sample. At each step of the loop we recorded a 2 s video to capture the system configuration and to calculate ρ(x). We applied Gaussian filtering, with a standard deviation, of ≈ 1 µm to ρ(x), thus reducing the roughness of the “painting” due to the discrete nature of the “ink” (the body of the bacterium). Then we proceeded updating the illumination pattern such that the pattern at the step n + 1 is:
In+1(x) = In(x) + α∆ρ(x)
where α is a parameter that can be used to speed up the updating process (set to 0.2). We then applied this feedback loop system trying to reproduce as ρtarget a portion of the Mona Lisa portrait by Leonardo Da Vinci. Figure 3.5 shows the results we obtained. We projected the negative pattern (−ρtarget) on the sample and
we monitored the evolution of χ2(t) during the reconfiguration of bacteria (Fig.3.5e). When the χ2 became stationary we turned on the feedback loop (shaded area) to study the improvement of the quality of the image we could obtain. Fitting the
χ2(t) as two decaying exponential connected in the point where the feedback loop was started, we could estimate a 25% reduction of χ2. Figure 3.5a,b shows the recorded image before the beginning of the feedback loop and at its end, respectively. Figure 3.5c,d shows the patterns illuminating in the sample in the same intervals of Figure 3.5a,b. The improvement in the refinement of details (e.g. eyes, nose, mouth) can be clearly appreciated. Figures 3.5a,b,c,d are the averages over 7 steps of the feedback loop.
Furthermore we analyzed the frames collected before the beginning of the feedback loop to check if we could recover the classical Schnitzer relation (Eq. 3.3). The relation in Eq. 3.3 is valid for a population of bacteria, all moving with the same swimming speed. In the case of swimming speeds broad distributed Eq. 3.3 can be written as ρ(x) ∝ v−1(x) [92], where the bar stands for the value averaged over the population distribution P (v). We have shown in Section 2.2 that the
2 4 6 8 10 12 14 I[mW/ mm 2 ] 0 2 4 6 8 10 12
t [min]
2 2 2 1 20 2/
2 0a
c
e
d
b
a
Figure 3.5. Real-time feedback loop improvement. (a, b) Average of the dark field
images captured over the last 7 steps before the feedback loop is started and at the end, respectively. The scale bars are 200 µm. (c, d) patterns projected on the sample in the same intervals of (a, b), respectively. (e) The evolution of the squared distance from the target χ2(t) before and after (shaded area) the feedback loop is started. The feedback loop