1) Fondazione Policlinico Universitario A. Gemelli IRCCS, UOC di Radiologia, Dipartimento di Scienze Radiologiche, Radioterapiche ed Ematologiche, Rome, Italy 2) Fondazione Policlinico Universitario A. Gemelli IRCCS, UOC di Medicina Interna e Gastroenterologia, Dipartimento di Scienze Gastroenterologiche, Endocrino-Metaboliche e Nefro-Urologiche, Rome, Italy 3) Università Cattolica del Sacro Cuore, Roma, IUOC Istituto di Patologia Speciale Medica e Semeiotica Medica 4) Università Cattolica del Sacro Cuore, Istituto di Radiologia. Rome, Italy 5) Department of Clinical Medicine, School of Medicine, Trinity College Dublin, 2 Dublin, Ireland
Address for correspondence: Laura Maria Minordi Fondazione Policlinico Universitario A. Gemelli IRCCS, UOC di Radiologia, Dipartimento di Scienze Radiologiche,
Largo Francesco Vito 1, 00168 Rome, Italy
lauramaria.minordi@ policlinicogemelli.it
Received: 22.03.2019 Accepted: 02.05.2019
Assessment of Crohn’s Disease Activity: Magnetic Resonance
Enterography in Comparison with Clinical and Endoscopic
Evaluations
Laura Maria Minordi1, Luigi Larosa1, Alfredo Papa2,3, Veronica Bordonaro4, Loris Lopetuso3, Grainne Holleran5, Antonio Gasbarrini2,3, Riccardo Manfredi1,4
INTRODUCTION
Crohn’s dis eas e (CD) is a chronic inflammatory transmural disease of the gastrointestinal tract that runs an indolent course consisting of episodes of inflammatory exacerbation and regression [1]. Clinical symptoms do not always correlate with the presence of inflammatory lesions, so assessment of the bowel is essential in guiding therapeutic decisions. If inflammation is present, it is important to distinguish between
ABSTRACT
Crohn’s disease (CD) is a chronic inflammatory transmural disease of the gastrointestinal tract. The small bowel is the most frequently involved site. Assessment of the bowel is essential in guiding therapeutic decisions, medical or surgical therapy. Personalized medicine is a new concept that has the potential to improve therapeutic efficacy, reduce the risk of drug adverse events, and decrease costs if the therapy is the most suitable treatment for selected patients. Many techniques have been verified and standardised for small bowel CD. Among radiological techniques, CT enterography (CTE) and MRI-enterography (MRE) are the most widely accepted techniques, although MRI is generally preferable as it avoids radiation. In this review, we will present the current role and new innovative technological perspectives of MR enterography in comparison with clinical and endoscopic evaluations for the assessment of CD activity in adult patients. In particular, many studies have been performed to validate MRE signs such as biomarkers of active Crohn’s disease (such as mural thickening, mural T2 hyperintense signal, target sign, comb sign, ulceration and extramural mesenteric signs) and to select the most appropriate index for identifying active disease or severe inflammation (such as MaRIA score, Clermont index, and others). We conclude that MRE is a minimally invasive tool for the evaluation of disease activity and shows a very good correlation with the presence and severity of endoscopic lesions, so to allow a personalized medicine in patients with CD.
Key words: Crohn’s disease − clinical activity − MR enterography − endoscopic scores − personalized medicine. Abbreviations: ADC: apparent diffusion coefficient; CD: Crohn’s disease; CDAI: Crohn’s Disease Activity Index; CDAS: Crohn’s disease activity score; CDEIS: Crohn’s Disease Endoscopic Index of Severity; CDMI: Crohn’s disease magnetic resonance index; CT: computer tomography; DWI: diffusion-weighted imaging; HBI: Harvey-Bradshaw Index; IBDQ: inflammatory bowel disease questionnaire; MR: magnetic resonance; MaRIA: Magnetic Resonance Index of Activity; MEGS: Magnetic Resonance Enterography Global Score; MRE: magnetic resonance-enterography; SES-CD: Simple Endoscopic Score for CD.
mild, moderate and severe disease, as the management differs depending on stage. Personalized medicine is a new concept that has the potentiality to improve therapeutic efficacy, reduce the risk of adverse drug events, and decrease costs if the therapy is the most suitable treatment for selected patients. Personalized medicine requires the determination of patients with a high risk of progression and complications, and detection of patients who can respond preferentially to a specific therapy [2]. Medical treatment is the main therapy, and is modulated according to the stage. Once therapy has started, personalized medicine also includes a personalized support for the patient. Surgery is indicated if medical therapy fails or in the presence of complications. In recent years, the goals of therapy have gradually moved beyond clinical remission toward a new concept, deep remission, which is defined in CD patients as clinical, biological, endoscopic and radiological remission.
Ileocolonoscopy is the current gold standard reference for CD and is accurate for assessing mucosal abnormalities. However it has several drawbacks: it is invasive, carries a risk of bowel perforation, is incapable of assessing trans- and extra-mural disease, and is limited to the evaluation of the colon and terminal ileum only [3].
Many innovative radiological techniques have been standardised and verified to study small bowel CD. Tomographic techniques, such as ultrasound, magnetic resonance (MR) and computed tomography (CT), allow evaluation of thickness and structural characteristics, and adjacent structures including the mesentery, fibrofatty tissue, lymph nodes, and the peritoneal spaces. Many studies have evaluated the advantages of performing CT or MR enterography (MRE) techniques for personalized medicine in CD. Computer tomography provides a better spatial resolution than MR, it has greater availability and is less time consuming. Moreover, MR is characterized by a very high soft tissue contrast, a lack of ionizing radiation and a lower incidence of adverse events related to the intravenous contrast used, compared with CT.
Finally, as for MR, studies assessing the accuracy of CT in the evaluation of CD, focussing on detection of lesions in the small bowel, have been performed to evaluate the value of CT for the characterization of inflammatory lesions in the colon [4].
In this review, we present the current role and the new innovative technological perspectives of MR enterography in comparison with clinical and endoscopic evaluations to allow personalized treatment in adult patients with active CD.
SEARCH STRATEGY
A comprehensive literature search of active CD and MR was performed in January 2018 using Pubmed. Studies concerning MR were included only if they were published in the English language after the year 2000 in order to have modern MRE manufactures and protocols including spasmolytics and biphasic enteral contrast. In MR studies, the following data were extracted from the included studies: study design (prospective vs. retrospective), study population (number and age of patients with confirmed CD), MRE protocol (MRI scanner field, bowel preparation, intravenous gadolinium-based contrast agent, gastrointestinal tract segment examined and reference standard), scoring used to evaluate disease activity.
CLINICAL AND ENDOSCOPIC
EVALUATION OF CD ACTIVITY
Composite clinical scores such as the Crohn’s Disease Activity Index (CDAI) or the Harvey–Bradshaw Index (HBI) are used to assess the severity of disease activity [5, 6]. CDAI was introduced in 1976 in order to assess clinical symptoms in CD. It is widely used in clinical trials for quantifying disease response or remission. Although it does not include an evaluation of quality of life, endoscopic variables or systemic characteristics, compared to endoscopy, the CDAI can potentially give additional information by suggesting the presence of extra-luminal complications (i.e., strictures, fistula, abscesses), post-surgical complications and superinfections
(i.e., Cytomegalovirus). In contrast, several reports have underlined the significant impact of subjective symptoms, irritable bowel syndrome, anxiety and depression on the CDAI score [7, 8]. Following this, the HBI was developed in 1980 with the goal of simplifying the CDAI and giving a useful tool for disease evaluation to gastroenterologists. Additionally, the inflammatory bowel disease questionnaire (IBDQ) has been introduced more recently, to assess the quality of life in these patients, including social, systemic, and emotional factors and bowel related symptoms, and has been shown to have a good correlation with the CDAI. Finally, there is also a shorter version of the IBDQ (SIBDQ), which is more commonly used in the office setting [7]. Alongside clinical scores, two validated endoscopic scores are used for CD. The Crohn’s Disease Endoscopic Index of Severity (CDEIS) includes the evaluation of 4 kinds of lesions (superficial ulcers, deep ulcers, ulcerated or non-ulcerated stenosis) at 5 different ileo-colonic segments (terminal ileum, right colon, transverse colon, left colon, and rectum), the percentage of ulcerated mucosa in the colon, and the percentage of inflamed mucosa on a 10 cm visual analogue scale [9]. The Simple Endoscopic Score for CD (SES-CD) was subsequently validated to simplify the ulcer classification and evaluation of inflamed mucosa [10]. Ulcer depth was replaced with ulcer size, and the percentage of the inflamed surface was replaced by a score between 0 and 3. Both scores have been prospectively validated with a high level of reproducibility and inter-observer agreement [11-13] and their changes have been shown to correlate significantly with the efficacy of pharmacological treatment [14]. However, their use is mainly restricted to clinical trials and they are rarely applied in clinical practice, most likely due to their complicated format and the absence of formal validation for their thresholds [11]. Conversely, following ileo-colonic resection in CD patients, the Rutgeerts’ endoscopic score (from i0 to i4) is commonly used for the assessment of disease recurrence [15]. Despite the fact that it has not been objectively tested for inter-observer agreement, several studies have shown and validated its ability to predict prognostic outcomes in post-surgical settings [15, 16]. Indeed, within one year after surgery, i0 and i1 patients show a lower risk of recurrence than those with i3 and i4 [17]. Of note, there is a significant discrepancy between the CDAI and endoscopic scores. In fact, several studies have underlined a good correlation between fecal and serum biomarkers of inflammation (i.e., calprotectin, lactoferrin, C-reactive protein) and endoscopic disease activity assessed by CDEIS or SES-CD, but not with the CDAI [8, 18, 19].
Recent studies suggest that endoscopic mucosal healing, defined as a resolution of visible mucosal inflammatory changes in areas of prior inflammation, may be an important therapeutic endpoint [20]. In clinical studies, mucosal healing has been shown to be an independent indicator of sustained clinical remission, and is associated with reduced rates of hospitalization and surgery in CD patients undergoing medical therapy [19, 21]. Consequently, mucosal healing has become a therapeutic target of treatment algorithms and is an endpoint of several CD clinical trials [22].
Finally, in small bowel CD, the diagnosis is often difficult and a low correlation with symptoms is often seen. Small-bowel capsule endoscopy is a useful diagnostic tool in these cases,
especially for isolated lesions [23]. In this field, the Capsule Endoscopy CD Activity Index (CECDAI) has been validated by a large prospective study [24]. It evaluates the grade of inflammation, disease extension and presence of strictures, and distinguishes between proximal and distal small bowel lesions. Additionally, another score for small bowel capsule endoscopy called the Lewis score, evaluates villous edema, ulcerations and strictures, and assesses the size and extent of each of these characteristics [25]. Furthermore, this score has been validated and has a satisfactory inter-observer agreement for the evaluation of mucosal disease severity. Interestingly, neither scoring system is able to determine the aetiology of the mucosal changes assessed or the clinical impact; correlation with response to therapy has not yet been validated. Moreover, the well-known technical pitfalls of small bowel capsule endoscopy (i.e., uncontrolled movement, different transit times, bowel preparation) represent important limitations for diagnostic accuracy and inter-observer agreement [26, 27].
MRE TECHNIQUE
Many studies have evaluated the technological innovations of MRE in Crohn‘s disease.
The basic requirements of MR imaging of the small bowel include visualisation of the entire small bowel, adequate visceral distension, elimination of respiratory motion and peristalsis, and intra-venous administration of contrast medium agent to evaluate the extent and pattern of wall enhancement.
There are different modalities of administration and different types of contrast agents used to obtain distension of the small bowel [28]. In MRE, an oral biphasic contrast medium (water, polyethylene glycol, sorbitol, mannitol, dilute barium sulfate, and locust bean gum) is usually used to obtain small bowel loop distension [29, 30]. This produces low signal intensity on T1-weighted images and high signal intensity on T2-weighted images. The low signal intensity on T1-weighted images improves the contrast between the dark bowel lumen and the hyperintense intestinal walls after i.v. administration of contrast medium. The marked contrast between the lumen and the dark bowel wall on T2-weighted images ameliorates the detection of intraluminal abnormalities and more effectively highlights transmural ulceration [31]. In our hospital, we use a polyethylene glycol solution (PEG). We usually administer 1.5-2.0 L of PEG in doses of 100 ml starting 35 mins before the MR examination. Inadequate non-uniform distension of all small bowel loops, particularly jejunal loops, is the main problem encountered when using oral contrast agents. This problem can be overcome at the cost of a higher level of invasiveness, time and costs by using MR-enteroclysis, an innovative method in which variable amounts of contrast medium are administered via naso-jejunal tube by hand or with a peristaltic pump.
Typical MRE sequences include single-shot T2 weighted images and balanced steady-state free precession (bSSFP) sequences performed in axial and coronal planes to provide assessment of the bowel wall, mesentery and extraintestinal structures. Axial T2-weighted fat suppressed images are useful to evaluate bowel well oedema and intra-abdominal fluid collections; cinematic thick slab coronal bSSFP images to assess peristalsis and to distinguish under-distended from
inflamed bowel loops; coronal multiphase 3D T1-weighted fat-suppressed post-contrast images (45 and 74 seconds after i.v. injection of contrast medium agent) to assess intestinal mural enhancement and mesenteric vascularity; and more delayed axial T1-weighted fat-suppressed images (120 seconds) to evaluate the presence of complications such as fistulae and abscesses. Diffusion-weighted imaging (DWI) is an innovative sequence and may be performed with b values of 0–800s/ mm2 or 0–600s/mm2 to support the detection of bowel wall
inflammation and extra-luminal collections.
CURRENT ROLE OF MRE IN THE
EVALUATION OF CLINICAL ACTIVITY
Some MRE signs have been validated as biomarkers of active CD compared with clinical, endoscopic and histological assessments.
Bowel wall thickening in both the small bowel and colon has been extensively studied and validated as a sign of active inflammation and is present in 82% of patients with CD [32-39]. In particular, wall thickness seems to be increased with disease activity and some authors [39] suggest using a threshold of 6 mm to distinguish between patients with inactive disease and active disease, while a threshold of 11 mm provides a distinction between mild and severe active CD patients.
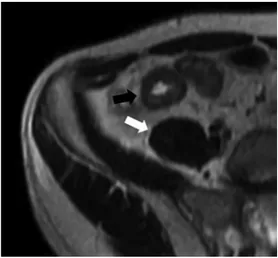
Bowel wall edema is another indicator of active inflammation and is detected by a mural hyperintense signal when compared with skeletal muscle on T2- weighted sequences [32, 40, 41] (Fig. 1). Parietal T2 hyperintense signal is best perceived on fat-saturation sequences [36, 42].
Fig. 1. Axial T2-weighted image shows hyperintense mural thickening of the last ileal loop with hyperintense signal (black arrow) compared with skeletal muscle (white arrow).
The degree and pattern of bowel wall enhancement are also associated with disease activity [43-46]. The pattern of enhancement can be assessed subjectively at each intestinal segment at 70 s and 7 min and divided as mucosal (enhancement of superficial layer), homogeneous (all bowel wall enhancing equally), or layered [43]. In particular, when
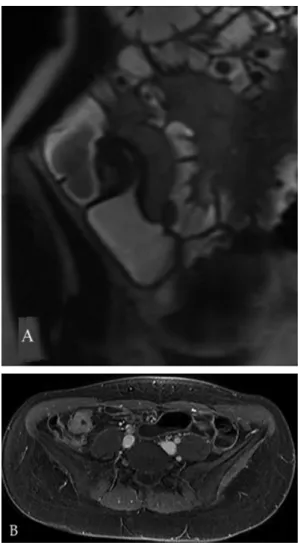
acute inflammation is present, the thickened wall often shows alternating rings of high and low intensity (layered enhancement or target sign), following contrast medium injection, in which the intermediate low-intensity ring represents submucosal edema or fat, while the inner ring of mucosa and outer ring of muscle layer and serosa show intense enhancement [45] (Fig. 2). The target sign was originally reported in CD, but it is not a specific finding; the differential diagnosis also includes ischemia, infectious enteritis, radiation enteritis, vasculitis and graft-versus-host-disease [45, 46]. In patients with longstanding disease and transmural fibrosis, mural stratification can be lost and the pathological intestinal wall can show homogeneous attenuation in the MR images [20] (Fig. 3). Moreover, more recent observations suggest that the pattern of contrast enhancement (layered vs homogeneous) in MRI depends on factors such as delay between contrast administration and imaging. In particular, some authors [43] found a significant association between the degree of histological fibrosis and presence of a homogeneous pattern of enhancement at 7 minutes.
Several extramural mesenteric MR findings of active disease have also been defined, though their performance has been variable in the literature. Fibrofatty proliferation presents itself as an alteration of the mesenteric fat with a loss of the normal sharp interface between the bowel wall and mesentery (Fig. 5). The hypervascularity of the involved mesentery with mesenteric arterial dilation, tortuosity, prominence and wide spacing, and dilation of the vasa recta (so-called comb sign) are all suggestive of an acute exacerbation in patients with CD [48] (Fig. 6). These extramural findings are associated with active inflammation but they are not consistently present and are best used as supportive evidence in addition to mucosal or mural abnormalities.
EMERGING ROLE AND NEW
PERSPECTIVES OF MRE IN THE
EVALUATION OF CLINICAL ACTIVITY
1) Quantitative assessment of bowel inflammation severity
Quantitative assessment of bowel inflammation is an innovative biotechnological approach in patients with CD.
Fig. 2. Pattern of active inflammation. A: Axial T1-weighted image after i.v. injection of contrast medium shows mural thickening of the distal ileum with target sign (white arrow); B: Endoscopy shows multiple aphthous ulcers.
Quantitative analyses of enhancement kinetics have also been shown to be effective predictors of active CD but are not currently used in clinical practice [37, 47].
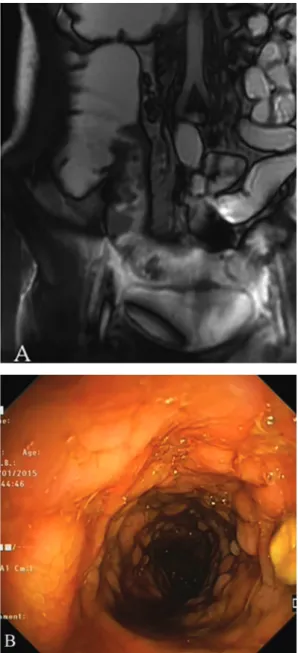
Presence of mucosal ulcers is another MRE finding of active disease in CD (Fig. 4) and is usually seen in more severe cases of inflammation [32], but an adequate distension of the small bowel is necessary for their reliable detection [20].
Fig. 3. Pattern of fibrosis. A: Coronal T2-weighted image shows hypointense mural thickening of the last ileal loop; B: T1-weighted axial image after IV injection of contrast medium shows homogeneous attenuation of the intestinal wall.
Moreover, a periodic evaluation of CD activity is crucial in order to adequately plan therapy and to monitor drug effects. In recent years, studies have evaluated the usefulness of the
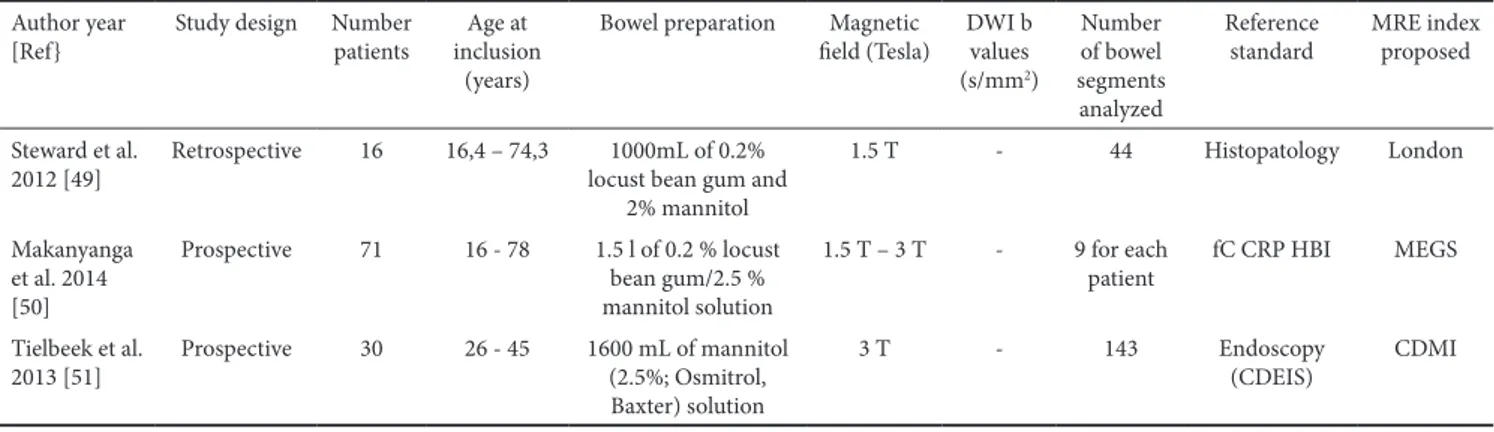
CT and MRE in detecting changes induced by therapy. In particular, recently studies were performed to select the most appropriate index for identifying active disease or severe inflammation in MRE imaging in order to apply a personalized medicine in patients with active CD (Table I).
1.1 Crohn’s disease MRI index (CDMI), also called London index or Crohn’s disease activity score (CDAS)
In 2012 Steward et al. [49] studied 16 patients who had undergone a terminal ileal resection, and developed another MRE index, the Crohn’s disease MRI index (CDMI), also called the London index or Crohn’s disease activity score (CDAS) (Table I, Fig. 7). Mural thickness, T2 signal, contrast enhancement, and perimural edema were scored qualitatively (0–3) using the acute inflammation score (AIS), a histopathological grading system, as reference. Mural thickness and T2 signal were shown to correlate best with the AIS. There was a significant correlation between the MR index and AIS. The model achieved a sensitivity of 0.81 and specificity of 0.70 for predicting acute inflammation.
1.2. Magnetic Resonance Enterography Global Score (MEGS)
In 2014 Makanyanga et al. [50] modified the CDMI to include length of pathological loop, loss of colonic haustra and presence of extra-enteric complications such as enlarged lymph nodes, abscesses and fistulae (Table I, Fig. 7). In detail, the small bowel (jejunum, ileum) and the colon (rectum, sigmoid, descending, transverse, ascending colon and caecum) were divided into nine segments and each segment was scored independently. For each patient the total CD activity score was calculated by summing the scores for all nine segments. The region of the segment exhibiting the highest score was used to assign the score for that particular segment. This new score, called Magnetic Resonance Enterography Global Score (MEGS), has been validated in CD patients and has been shown to be useful in demonstrating a good response to medical therapy. Faecal calprotectin, C-reactive protein, HBI,
Fig. 4. Radiological and endoscopic aspects of ulcers. A: Coronal Fiesta-image shows deep ulcers of the last ileal loop; B: Endoscopy shows deep ulcers with cobblestone appearance of the same last ileal loop.
Fig. 5. Axial Fiesta-image shows focal alteration of mesenteric fat near the last ileal loop.
Fig. 6. Coronal T1-weighted image after IV injection of contrast medium shows mural thickening of the distal ileum with target sign (black arrow) and comb sign (white arrow).
were used as reference standards in this study [50], however the same group validated the index in subsequent studies also comparing it to endoscopic assessments [51].
The main characteristics used to propose and validate the above scores in each of the three studies are summarized in Table II.
1.3. Magnetic Resonance Index of Activity (MaRIA)
In 2009 Rimola et al. [32] proposed and validated a simplified Magnetic Resonance Index of Activity (MaRIA) score that quantifies CD-related inflammatory activity in each ileo-colonic segment (Table I, Fig. 7). A segmental MaRIA score was calculated using the following formula: MaRIA = 1.5 × wall thickness (mm) + 0.02 × relative contrast enhancement
+ 5 × edema + 10 × ulcers. The MaRIA score is calculated in each colonic segment and in the distal ileum according to the established formula. The global MaRIA score is calculated as the sum of the MaRIA in each colonic segment and the distal ileum. In MRE examinations, mucosal healing in a particular segment can be defined as a MaRIA score < 7, with a cut off point for severe inflammation of 11 [32].
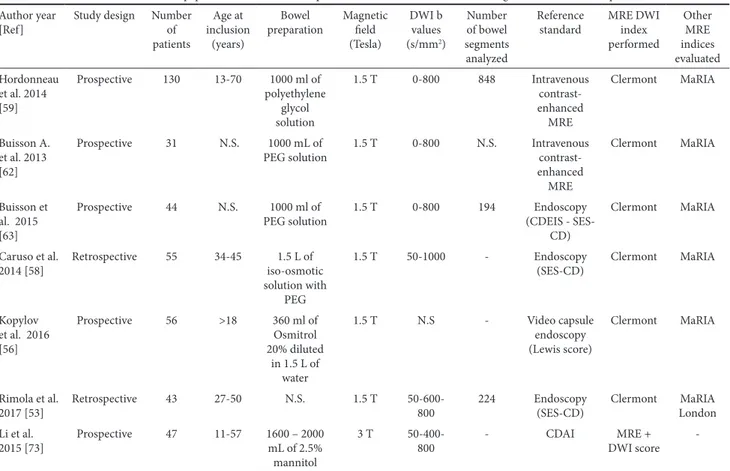
The main characteristics of each of the studies [32, 52-60] evaluating the ability of the MaRIA score to diagnose active bowel disease in CD are summarized in Table III.
Recently, Erden et al [60] have evaluated the MaRIA score in patients with entero-enteric fistulas and found no significant difference between patients with fistulas from those without fistulas. A potential limitation of the MaRIA is that it does not
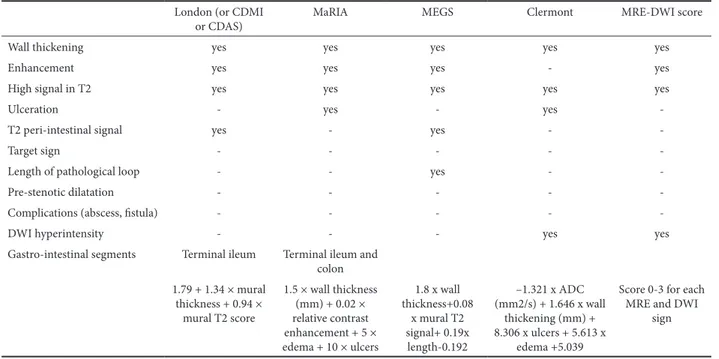
Table I. Magnetic resonance imaging features evaluted for each MRE score in CD London (or CDMI
or CDAS) MaRIA MEGS Clermont MRE-DWI score
Wall thickening yes yes yes yes yes
Enhancement yes yes yes - yes
High signal in T2 yes yes yes yes yes
Ulceration - yes - yes
-T2 peri-intestinal signal yes - yes -
-Target sign - - - -
-Length of pathological loop - - yes -
-Pre-stenotic dilatation - - - -
-Complications (abscess, fistula) - - - -
-DWI hyperintensity - - - yes yes
Gastro-intestinal segments Terminal ileum Terminal ileum and colon 1.79 + 1.34 × mural thickness + 0.94 × mural T2 score 1.5 × wall thickness (mm) + 0.02 × relative contrast enhancement + 5 × edema + 10 × ulcers 1.8 x wall thickness+0.08 x mural T2 signal+ 0.19x length-0.192 –1.321 x ADC (mm2/s) + 1.646 x wall thickening (mm) + 8.306 x ulcers + 5.613 x edema +5.039
Score 0-3 for each MRE and DWI
sign
Fig. 7. Patient with mural thickening of the distal ileum. We have calculated the most important indices of disease activity. These explanations are in the text.
take into account the overall length of inflamed segments, even in the small bowel where extensive disease can occur.
1.4. Diffusion-weighted imaging scores (DWI-MaRIA score or Clermont score, MRE-DWI score)
DWI is an innovative sequence performed in patients with CD. Recent data suggests that DWI provides information
regarding the presence of inflammation by reflecting biological activity. DWI is performed by using a T2-weighted fat-suppressed MR sequence with the addition of a diffusion gradient, which is quantified by a diffusion coefficient called b-values. Diffusion MR creates an image contrast contingent on the movement of water and other small molecules within the tissue. By increasing the diffusion coefficient, the signal
Table II. Main characteristics of papers which proposed the London Index (or CDMI index) and MEGS Author year
[Ref} Study design Number patients inclusion Age at (years)
Bowel preparation Magnetic
field (Tesla) DWI b values (s/mm2) Number of bowel segments analyzed Reference
standard MRE index proposed Steward et al.
2012 [49] Retrospective 16 16,4 – 74,3 locust bean gum and 1000mL of 0.2% 2% mannitol 1.5 T - 44 Histopatology London Makanyanga et al. 2014 [50] Prospective 71 16 - 78 1.5 l of 0.2 % locust bean gum/2.5 % mannitol solution 1.5 T – 3 T - 9 for each
patient fC CRP HBI MEGS Tielbeek et al.
2013 [51] Prospective 30 26 - 45 1600 mL of mannitol (2.5%; Osmitrol, Baxter) solution
3 T - 143 Endoscopy
(CDEIS) CDMI
Table III. The main characteristics of papers which evaluated the performance of MaRIA score in detecting active lesions in CD patients Author year
[Ref] Study design Number patients Age at inclusion (years)
Bowel preparation Magnetic field (Tesla) DWI b values (s/mm2) Number of bowel segments analyzed Reference
standard Other MRE indices evaluated Rimola et al.
2009 [32] Prospective 50 20-35 1500 ml of iso-osmotic PEG and electrolyte solution + water enema
3 T - 213 Endoscopy
(CDEIS) -Rimola et al.
2011 [52] Prospective 48 - 1500 mL of a 2.5% mannitol solution + water enema
3 T - 258 Endoscopy
(CDEIS) -Rimola et al.
2017 [53] Retrospective 43 27-50 N.S. 1.5 T 50-600-800 224 Endoscopy (SES-CD) Clermont London Rimola et al.
2017 [54] Retrospective 43 27-50 1000–1500 mL oral solution with mannitol at 2.5% 1.5 T 50-600-800 224 Endoscopy (CDEIS - SES-CD) -Coimbra et
al. 2016 [55] Prospective 20 24-63 1500 mL of an oral non-absorbable bowel preparation solution + water enema
N.S. - 9 for each
patient Endoscopy (CDEIS - SES-CD)
-Kopylov et
al. 2016 [56] Prospective 56 >18 360 ml of Osmitrol 20% diluted in 1.5 L of water 1.5 T N.S. - Video capsule endoscopy (Lewis score)
Clermont
Kim et al.
2017 [57] Prospective 42 18-42 1500 mL of 2.5% sorbitol 3 T 0-900 79 Endoscopy (CDEIS) -Caruso et al.
2014 [58] Retrospective 55 34-45 1.5 L of iso-osmotic solution with PEG + further 1.5 L 45 min before exam 1.5 T 50-1000 - Endoscopy (SES-CD) Clermont Hordonneau et al. 2014 [59] Prospective 130 13-70 1000 ml of polyethylene
glycol solution 1.5 T 0-800 848 Intravenous contrast- enhanced MRE
Clermont
Erden et al.
2017 [60] Retrospective 38 + 48 > 18 1.5-2 L water containing osmotic agent (125 cc Osmolac preparation)
-in areas of free diffusion decreases rapidly, while -in regions where diffusion is restricted, the signal decreases more slowly. The optimal b-values to be used for DWI of the bowel are not clearly defined. The use of at least two b-values is required, a low value (b=50 or 0) and a high b-value (800 or 1000 s/mm2)
[61]. The acquired images must be further processed to obtain a parametric map called the apparent diffusion coefficient (ADC) map. This map produces numerical values, which facilitate the quantification of diffusion restriction. Cellular infiltration associated with acute inflammation may alter DWI signal via restriction, and in this case the image contrast may be related to disease activity [62-66]. In patients with active CD the intestinal wall shows diffusion restriction and a low ADC with high signal intensity on DWI using low and high b-values. Several studies have evaluated the efficacy of DWI in detecting active CD in comparison with ileocolonoscopy [58, 63], videocapsule endoscopy [56], laboratory tests or other modalities of assessment [58, 67]. DWI has been shown to have a high sensitivity for the detection of small bowel inflammatory disease, although the majority of the studies included small numbers of patients. Accuracy of DWI was heterogeneous and was likely to have been overestimated in some studies [68]. Accuracy of DWI is usually lower in colonic evaluation than in the small bowel. The artefacts generated by air in the colon may explain this discrepancy; and furthermore, water enema was not used in a few of the studies [59, 65].
DWI does not need bowel preparation and contrast enhancement, so it could be useful for patients who cannot
receive contrast due to renal failure, pregnancy, or allergy, and it has been proposed as an alternative to the use of intravenous gadolinium-based contrast agents [66, 69].
Quantification using the ADC may have value as a biomarker of CD activity and has shown innovative promise [61, 70-72]. In some studies [53, 58, 62] an ADC threshold value between 1.2 x 10⁻³ and 2.4 x 10⁻³ s/mm2 was calculated to
discriminate between active and non-active disease.
Recently, Hordonneau et al. [59] validated a new score called the DWI-MaRIA or Clermont score. The Clermont score is calculated using the following equation: –1.321 x ADC (mm2/s) + 1.646 x wall thickening (mm) + 8.306 x ulcers +
5.613 x edema +5.039 (Table I, Fig. 7). They found an excellent correlation between the MaRIA and the Clermont Score, but confirmatory studies are currently lacking. So far, a quantitative evaluation of the ADC value is barely reproducible, although the overall ADC value seems to be decreased in inflammatory lesions. Table IV summarises the most important studies evaluating the use of DWI scores in the assessment of activity of CD with MRE.
In 2015, Li et al. [73] validated an MRE-DWI score based on thickness, T2 signal intensity, enhancement and DWI hyperintensity of bowel wall. In this study, diffusion-weighted MR imaging and MRE + DWI scores of active CD were significantly higher than that of inactive CD. Apparent diffusion coefficients in inflamed segments of active CD were lower than that of inactive CD. The DWI scores, ADC, MRE scores, and MRE + DWI scores were all correlated with CDAI. However, no comparison with endoscopy was performed in this study.
Table IV. The main characteristics of papers which evaluated the performance of DWI scores in detecting active lesions in CD patients Author year
[Ref] Study design Number of patients
Age at inclusion
(years)
Bowel
preparation Magnetic field (Tesla) DWI b values (s/mm2) Number of bowel segments analyzed Reference
standard MRE DWI index performed Other MRE indices evaluated Hordonneau et al. 2014 [59] Prospective 130 13-70 1000 ml of polyethylene glycol solution 1.5 T 0-800 848 Intravenous contrast- enhanced MRE Clermont MaRIA Buisson A. et al. 2013 [62] Prospective 31 N.S. 1000 mL of
PEG solution 1.5 T 0-800 N.S. Intravenous contrast- enhanced MRE Clermont MaRIA Buisson et al. 2015 [63] Prospective 44 N.S. 1000 ml of
PEG solution 1.5 T 0-800 194 (CDEIS - SES-Endoscopy CD) Clermont MaRIA Caruso et al. 2014 [58] Retrospective 55 34-45 iso-osmotic 1.5 L of solution with PEG 1.5 T 50-1000 - Endoscopy
(SES-CD) Clermont MaRIA Kopylov et al. 2016 [56] Prospective 56 >18 360 ml of Osmitrol 20% diluted in 1.5 L of water 1.5 T N.S - Video capsule endoscopy (Lewis score) Clermont MaRIA Rimola et al.
2017 [53] Retrospective 43 27-50 N.S. 1.5 T 50-600-800 224 Endoscopy (SES-CD) Clermont LondonMaRIA Li et al.
2015 [73] Prospective 47 11-57 1600 – 2000 mL of 2.5% mannitol
3 T
-1.5. Comparison between MRE scores for CD
Recently, Rimola et al. [53] compared the diagnostic accuracy of MaRIA, Clermont, and London indices for each colonic segment and the terminal ileum, in detecting and grading disease activity in CD, using endoscopy as a standard reference. In this study, the three MRE indices of disease activity were calculated in each segment. The cut-off points previously established for differentiating active from inactive disease were 7 for MaRIA, 8.4 for Clermont index, and 4.1 for London index. The cut-off points for severe inflammation were 11 for MaRIA and 12.5 for Clermont index. The three MRE indices evaluated in this study had a high diagnostic accuracy for the assessment of disease activity. The MaRIA index was found to have the best functional assessment ability, not only for detecting disease activity but also for grading severity.
1.6. Limitations of MRE scores
These MRE scores have some limitations. Most of the MR scores have been validated against endoscopic scores and are calculated using four colonic segments and one ileal segment, so MRE could potentially underestimate the small bowel inflammation if there is extensive small bowel disease. Further problems include the reproducibility and the practicality of using these scores outside academic centres, especially as they can be very time-consuming.
2) MRE as an alternative technique to endoscopy Endoscopy is the gold standard for the assessment of luminal alterations in CD. However, complete endoscopy is not always feasible, and there are several disadvantages related to the invasiveness, patient discomfort and the risk of intestinal perforation. This fact has led to the search for an alternative technique. A good correlation between the presence and severity of endoscopic lesions and MRE signs of inflammatory activity in the bowel has been reported [32, 49, 52, 66]. However, the parameters used to diagnose inflammatory activity are different. Endoscopy bases the evaluation of disease activity on the presence of erythema, swollen mucosa, superficial, deep, or healed ulcers and pseudopolyps. Magnetic resonance enterography evaluates wall thickness, enhancement after intra-venous contrast administration, the presence of oedema and ulcerations, or other measures, such as restriction at DWI [74]. While results described by Narin et al. [75] and Ajaj et al. [76] supported a good concordance of findings between MR and endoscopy for the detection of disease activity (sensitivity of 87–89% and specificity of 85–100%), Schreyer et al. [77] and Dinter et al. [78] reported discordant results (sensitivity of 32–64% and specificity of 81–100%), suggesting that the technique may not be accurate for the evaluation of CD lesions.
Rimola et al., in 2011 [52] evaluated the MRE predictors of active and severe CD, using colonoscopy as a reference. In this study, independent MRE predictors of disease severity were wall thickness, relative contrast enhancement, presence of edema, and ulcers. The estimation of activity using the MaRIA score also correlated with endoscopy findings. More recently, in 2017, the same group [54] compared the accuracy of MRE and MaRIA score versus ileocolonoscopy performed within 1 month. For detecting active disease, a combination of T2-weighted and DWI sequences resulted in the highest specificity and most
accurate sequence combination, and had similar sensitivity to those of the MaRIA but a lower specificity and accuracy than the MaRIA score. For detecting severe lesions, T2-weighted sequences alone had a greater accuracy, similar to that of the MaRIA score, than other non-contrast approaches. Overall, they concluded that T2-weighted sequences should be used as a first step, and followed by contrast-enhanced T1-weighted sequences only when abnormal findings are identified; in this study, adding DWI did not improve the accuracy of MRE.
Finally, some studies [79-80] suggest that bowel wall healing after medical therapy assessed using MRI is predictive of long-term favorable outcomes such as sustained clinical remission and decreased risk of surgery in patients with CD and suggest to use these definitions as therapeutic goals.
CONCLUSIONS
The combination of MR with clinical and endoscopic evaluations plays an important role in the evaluation of CD patients in order to allow a personalized medicine, to obtain an accurate assessment of the disease stage, which is indispensable in deciding the appropriateness of medical or surgical therapy. The availability of different protocols requires an in-depth knowledge of their diagnostic advantages, so as to select the best method to specifically reveal the presence of a lesion suspected based on clinical and laboratory findings.
Conflicts of interest: No conflict to declare.
Authors’ contributions: L.M.M.: conception and design of the review; L.M.M, L.La: literature search and manuscript drafting; V.B., L.Lo: summary of the relevant data in tables; G.H: language editing; L.M.M, L.La., A.P., A.G., R.M.: critical review of the manuscript. All authors read and approved the final version of the manuscript.
REFERENCES
1. Crohn BB, Ginzburg L, Oppenheimer GD. Regional ileitis: A pathologic and clinical entity. JAMA 1932;99:1323–1329. doi:10.1001/ jama.1932.02740680019005
2. Flamant M, Roblin X. Inflammatory bowel disease: towards a personalized medicine. Therap Adv Gastroenterol 2018;11:1756283X17745029. doi:10.1177/1756283X17745029
3. Hommes DW, Van Deventer SJ. Endoscopy in inflammatory bowel diseases. Gastroenterology 2004;126:1561–1573. doi:10.1053/j. gastro.2004.03.023
4. Minordi LM, Scaldaferri F, Marra RS, et al. Enterography CT without and with water enema in patients with Crohn’s disease: Results from a comparative observational study in comparison with endoscopy. Eur J Radiol 2016;85:404–413. doi:10.1016/j.ejrad.2015.11.028
5. Best WR, Becktel JM, Singleton JW, Kern F Jr. Development of a Crohn’s disease activity index. National Cooperative Crohn’s Disease Study. Gastroenterology 1976;70:439–444. doi:10.1016/S0016-5085(76)80163-1 6. Harvey RF, Bradshaw JM. A simple index of Crohn’s-disease activity.
Lancet 1980;315:514. doi:10.1016/S0140-6736(80)92767-1
7. Gajendran M, Loganathan P, Catinella AP, Hashash JG. A comprehensive review and update on Crohn’s disease. Dis Mon 2018;64:20-57. doi:10.1016/j.disamonth.2017.07.001
8. Peyrin-Biroulet L, Reinisch W, Colombel JF, et al. Clinical disease activity, C-reactive protein normalisation and mucosal healing in Crohn’s disease in the SONIC trial. Gut 2014;63:88–95. 10.1136/ gutjnl-2013-304984
9. Mary JY, Modigliani R. Development and validation of an endoscopic index of the severity for Crohn’s disease:a prospective multicentre study. Groupe d’Etudes Therapeutiques des Affections Inflammatoires du Tube Digestif (GETAID). Gut 1989;30:983–989. doi:10.1136/gut.30.7.983 10. Daperno M, D’Haens G, Van Assche G, et al. Development and
validation of a new, simplified endoscopic activity score for Crohn’s disease: The SES-CD. Gastrointest Endosc 2004;60:505–512. doi:10.1016/S0016-5107(04)01878-4
11. Annese V, Daperno M, Rutter MD, et al. European evidence based consensus for endoscopy in inflammatory bowel disease. J Crohn’s Colitis 2013;7:982–1018. doi:10.1016/j.crohns.2013.09.016
12. Sostegni R, Daperno M, Scaglione N, Lavagna A, Rocca R, Pera A. Review article: Crohn’s disease: monitoring disease activity. Aliment Pharmacol Ther 2003;17 Suppl 2:11–17. doi:10.1046/j.1365-2036.17. s2.17.x
13. Daperno M, Castiglione F, de Ridder L, et al. Results of the 2nd part Scientific Workshop of the ECCO (II): Measures and markers of prediction to achieve, detect, and monitor intestinal healing in Inflammatory Bowel Disease. J Crohn’s Colitis 2011;5:484–498. doi:10.1016/j.crohns.2011.07.003
14. Sipponen T, Nuutinen H, Turunen U, Farkkila M. Endoscopic evaluation of Crohn’s disease activity: comparison of the CDEIS and the SES-CD. Inflamm Bowel Dis 2010;16:2131–2136. doi:10.1002/ibd.21300 15. Rutgeerts P, Geboes K, Vantrappen G, Beyls J, Kerremans R, Hiele
M. Predictability of the postoperative course of Crohn’s disease. Gastroenterology 1990;99:956–963.
16. Rutgeerts P, Geboes K, Vantrappen G, Kerremans R, Coenegrachts JL, Coremans G. Natural history of recurrent Crohn’s disease at the ileocolonic anastomosis after curative surgery. Gut 1984;25:665–672. doi:10.1136/gut.25.6.665
17. Pineton De Chambrun G, Peyrin-Biroulet L, Lémann M, Colombel JF. Clinical implications of mucosal healing for the management of IBD. Nat Rev Gastroenterol Hepatol 2010;7:15–29. doi:10.1038/ nrgastro.2009.203
18. Modigliani R, Mary JY, Simon JF, et al. Clinical, biological, and endoscopic picture of attacks of Crohn’s disease. Evolution on prednisolone. Groupe d’Etude Thérapeutique des Affections Inflammatoires Digestives. Gastroenterology 1990;98:811–818. doi:10.1016/0016-5085(90)90002-I
19. Baert F, Moortgat L, Van Assche G, et al. Mucosal healing predicts sustained clinical remission in patients with early-stage Crohn’s Disease. Gastroenterology 2010;138:463–468. doi:10.1053/j.gastro.2009.09.056 20. Moy MP, Sauk J, Gee MS. The role of MR enterography in assessing
Crohn’s disease activity and treatment response. Gastroenterol Res Pract 2016;2016:8168695. doi:10.1155/2016/8168695
21. Neurath MF, Travis SP. Mucosal healing in inflammatory bowel diseases: a systematic review. Gut 2012;61:1619–1635. doi:10.1136/ gutjnl-2012-302830
22. Rutgeerts P, Van Assche G, Sandborn WJ, et al. Adalimumab induces and maintains mucosal healing in patients with Crohn’s disease:Data from the EXTEND trial. Gastroenterology 2012;142:1102–1111. doi:10.1053/j.gastro.2012.01.035
23. Bourreille A, Ignjatovic A, Aabakken L, et al. Role of small-bowel endoscopy in the management of patients with inflammatory bowel
disease:An international OMED-ECCO consensus. Endoscopy 2009;41:618–637. doi:10.1055/s-0029-1214790
24. Niv Y, Ilani S, Levi Z, et al. Validation of the Capsule Endoscopy Crohn’s Disease Activity Index (CECDAI or Niv score): A multicenter prospective study. Endoscopy 2012;44:21–26. doi:10.1055/s-0031-1291385 25. Gralnek IM, Defranchis R, Seidman E, Leighton JA, Legnani P, Lewis
BS. Development of a capsule endoscopy scoring index for small bowel mucosal inflammatory change. Aliment Pharmacol Ther 2008;27:146– 154. doi:10.1111/j.1365-2036.2007.03556.x
26. Gurudu SR, Leighton JA. Correlation of two capsule endoscopy scoring systems with fecal calprotectin: Does it really matter? Dig Dis Sci 2012;57:827–829. doi:10.1007/s10620-012-2079-6
27. Tontini GE, Bisschops R, Neumann H. Endoscopic scoring systems for inflammatory bowel disease: pros and cons. Expert Rev Gastroenterol Hepatol 2014;8:543–554. doi:10.1586/17474124.2014.899899 28. Bender GN, Timmons JH, Williard WC, Carter J. Computed
tomographic enteroclysis: One methodology. Invest Radiol 1996;31:43– 49.
29. Fidler JL, Guimaraes L, Einstein DM. MR Imaging of the small bowel. Radiographics 2009;29:1811–1825. doi:10.1148/rg.296095507 30. Masselli G, Gualdi G. MR Imaging of the Small Bowel. Radiology
2012;264:333–348. doi:10.1148/radiol.12111658
31. Umschaden HW, Gasser J. MR enteroclysis. Radiol Clin North Am 2003;41:231–248.
32. Rimola J, Rodriguez S, García-Bosch O, et al. Magnetic resonance for assessment of disease activity and severity in ileocolonic Crohn’s disease. Gut 2009;58:1113–1120. doi:10.1136/gut.2008.167957
33. Ziech ML, Bipat S, Roelofs JJ, et al. Retrospective comparison of magnetic resonance imaging features and histopathology in Crohn’s disease patients. Eur J Radiol 2011;80:e299-e305. doi:10.1016/j. ejrad.2010.12.075
34. Gourtsoyiannis N, Papanikolaou N, Grammatikakis J, Papamastorakis G, Prassopoulos P, Roussomoustakaki M. Assessment of Crohn’s disease activity in the small bowel with MR and conventional enteroclysis: Preliminary results. Eur Radiol 2004;14:1017–1024. doi:10.1007/ s00330-004-2302-8
35. Florie J, Wasser MN, Arts-Cieslik K, Akkerman EM, Siersema PD, Stoker J. Dynamic contrast-enhanced MRI of the bowel wall for assessment of disease activity in Crohn’s disease. AJR Am J Roentgenol 2006;186:1384–1392. doi:10.2214/AJR.04.1454
36. Punwani S, Rodriguez-Justo M, Bainbridge A, et al. Mural inflammation in Crohn disease:Location-matched histologic validation of MR imaging features. Radiology 2009;252:712–720. doi:10.1148/radiol.2523082167 37. Oto A, Kayhan A, Williams JT, et al. Active Crohn’s Disease in the
small bowel:Evaluation by diffusion weighted imaging and quantitative dynamic contrast enhanced MR imaging. J Magn Reson Imaging 2011;33:615–24. doi:10.1002/jmri.22435
38. Lasocki A, Pitman A, Williams R, Lui B, Kalade AV, Farish S. Relative efficacy of different MRI signs in diagnosing active Crohn’s disease, compared against a histological gold standard. J Med Imaging Radiat Oncol 2011;55:11–19. doi:10.1111/j.1754-9485.2010.02223.x 39. Zappa M, Stefanescu C, Cazals-Hatem D, et al. Which magnetic
resonance imaging findings accurately evaluate inflammation in small bowel Crohn’s disease? A retrospective comparison with surgical pathologic analysis. Inflamm Bowel Dis 2011;17:984–993. doi:10.1002/ ibd.21414
40. Maccioni F, Bruni A, Viscido A, et al. MR Imaging in patients with Crohn disease: value of T2- versus T1-weighted gadolinium-enhanced
MR sequences with use of an oral superparamagnetic contrast agent. Radiology 2006;238:517–530. doi:10.1148/radiol.2381040244 41. Taylor SA, Punwani S, Rodriguez-Justo M, et al. Mural Crohn disease:
correlation of dynamic contrast-enhanced MR imaging findings with angiogenesis and inflammation at histologic examination--pilot study. Radiology 2009;251:369–379. doi:0.1148/radiol.2512081292 42. Rodriguez P, Mendez R, Matute F, Hernandez P, Mendoza JL. Imaging
Crohn disease: MR enterography. J Comput Assist Tomogr 2014;38:219– 227. doi:10.1097/RCT.0000000000000020
43. Rimola J, Planell N, Rodríguez S, et al. Characterization of inflammation and fibrosis in crohn’s disease lesions by magnetic resonance imaging. Am J Gastroenterol 2015;110:432–440. doi:10.1038/ajg.2014.424 44. Bettenworth D, Bokemeyer A, Baker M, et al. Assessment of Crohn’s
disease-associated small bowel strictures and fibrosis on cross-sectional imaging:a systematic review. Gut 2019 April 03. doi:10.1136/ gutjnl-2018-318081
45. Birnbaum BA. Computed tomography of the small bowel. Technique and principles of interpretation. In: Herlinger H, Maglinte DDT, Birnbaum BA. Clinical imaging of the small intestine. Berlin: Springer; 1999:153–166.
46. Kelvin FM, Herlinger H. Crohn’s disease. In: Herlinger H, Maglinte DDT, Birnbaum BA. Clinical imaging of the small intestine. Berlin: Springer; 1999:259–289.
47. Del Vescovo R, Sansoni I, Caviglia R, et al. Dynamic contrast enhanced magnetic resonance imaging of the terminal ileum: differentiation of activity of Crohn’s disease. Abdom Imaging 2008;33:417–424. doi:10.1007/s00261-007-9267-4
48. Lee SS, Ha HK, Yang SK, et al. CT of prominent pericolic or perienteric vasculature in patients with Crohn’s disease: Correlation with clinical disease activity and findings on barium studies. AJR Am J Roentgenol 2002;179:1029–1036. doi:10.2214/ajr.179.4.1791029
49. Steward MJ, Punwani S, Proctor I, et al. Non-perforating small bowel Crohn’s disease assessed by MRI enterography: Derivation and histopathological validation of an MR-based activity index. Eur J Radiol 2012;81:2080–2088. doi:10.1016/j.ejrad.2011.07.013
50. Makanyanga JC, Pendsé D, Dikaios N, et al. Evaluation of Crohn’s disease activity:Initial validation of a magnetic resonance enterography global score (MEGS) against faecal calprotectin. Eur Radiol 2014;24:277–287. doi:10.1007/s00330-013-3010-z
51. Tielbeek JAW, Makanyanga JC, Bipat S, et al. Grading Crohn disease activity with MRI: interobserver variability of MRI features, MRI scoring of severity, and correlation with Crohn disease endoscopic index of severity. AJR Am J Roentgenol 2013;201:1220–1228. doi:10.2214/ AJR.12.10341
52. Rimola J, Ordás I, Rodriguez S, et al. Magnetic resonance imaging for evaluation of Crohn’s disease:Validation of parameters of severity and quantitative index of activity. Inflamm Bowel Dis 2011;17:1759–1768. doi:10.1002/ibd.21551
53. Rimola J, Alvarez-Cofiño A, Pérez-Jeldres T, et al. Comparison of three magnetic resonance enterography indices for grading activity in Crohn’s disease. J Gastroenterol 2017;52:585–593. doi:10.1007/s00535-016-1253-6
54. Rimola J, Alvarez-Cofiño A, Pérez-Jeldres T, et al. Increasing efficiency of MRE for diagnosis of Crohn’s disease activity through proper sequence selection: a practical approach for clinical trials. Abdom Radiol 2017;42:2783–2791. doi:10.1007/s00261-017-1203-7
55. Coimbra AJ, Rimola J, O’Byrne S, et al. Magnetic resonance enterography is feasible and reliable in multicenter clinical trials in patients with Crohn’s disease, and may help select subjects with active
inflammation. Aliment Pharmacol Ther 2016;43:61–72. doi:10.1111/ apt.13453
56. Kopylov U, Klang E, Yablecovitch D, et al. Magnetic resonance enterography versus capsule endoscopy activity indices for quantification of small bowel inflammation in Crohn’s disease. Therap Adv Gastroenterol 2016;9:655–663. doi:10.1177/1756283X16649143 57. Kim JS, Jang HY, Park SH, et al. MR enterography assessment of bowel
inflammation severity in Crohn disease using the MR index of activity score:Modifying roles of DWI and effects of contrast phases. AJR Am J Roentgenol 2017;208:1022–1029. doi:10.2214/AJR.16.17324 58. Caruso A, D’Incà R, Scarpa M, et al. Diffusion-weighted magnetic
resonance for assessing ileal Crohn’s disease activity. Inflamm Bowel Dis 2014;20:1575-1583. doi:10.1097/MIB.0000000000000128 59. Hordonneau C, Buisson A, Scanzi J, et al. Diffusion-weighted magnetic
resonance imaging in ileocolonic Crohn’s disease: Validation of quantitative index of activity. Am J Gastroenterol 2014;109:89–98. doi:10.1038/ajg.2013.385
60. Erden A, Ünal S, Akkaya HE, et al. MR Enterography in Crohn’s disease complicated with enteroenteric fistula. Eur J Radiol 2017;94:101–106. doi:10.1016/j.ejrad.2017.06.012
61. Dohan A, Taylor S, Hoeffel C, et al. Diffusion-weighted MRI in Crohn’s disease:Current status and recommendations. J Magn Reson Imaging 2016;44:1381–1396. doi:10.1002/jmri.25325
62. Buisson A, Joubert A, Montoriol PF et al. Diffusion-weighted magnetic resonance imaging for detecting and assessing ileal inflammation in Crohn’s disease. Aliment Pharmacol Ther 2013;37:537–545. doi:10.1111/apt.12201
63. Buisson A, Hordonneau C, Goutte M, Boyer L, Pereira B, Bommelaer G. Diffusion-weighted magnetic resonance imaging is effective to detect ileocolonic ulcerations in Crohn’s disease. Aliment Pharmacol Ther 2015;42:452–460. doi:10.1111/apt.13287
64. Freiman M, Perez-Rossello JM, Callahan MJ, et al. Characterization of fast and slow diffusion from diffusion-weighted MRI of pediatric Crohn’s disease. J Magn Reson Imaging 2013;37:156–163. doi:10.1002/ jmri.23781
65. Kiryu S, Dodanuki K, Takao H, et al. Free-breathing diffusion-weighted imaging for the assessment of inflammatory activity in Crohn’s disease. J Magn Reson Imaging 2009;29:880–886. doi:10.1002/jmri.21725 66. Oussalah A, Laurent V, Bruot O, et al. Diffusion-weighted
magnetic resonance without bowel preparation for detecting colonic inflammation in inflammatory bowel disease. Gut 2010;59:1056–1065. doi:10.1136/gut.2009.197665
67. Pendsé DA, Makanyanga JC, Plumb AA, et al. Diffusion-weighted imaging for evaluating inflammatory activity in Crohn’s disease: comparison with histopathology, conventional MRI activity scores, and faecal calprotectin. Abdom Radiol 2017;42:115–123. doi:10.1007/ s00261-016-0863-z
68. Choi SH, Kim KW, Lee JY, Kim KJ, Park SH. Diffusion-weighted Magnetic Resonance Enterography for Evaluating Bowel Inflammation in Crohn’s Disease: A Systematic Review and Meta-analysis. Inflamm Bowel Dis 2015;22:669–679. doi:10.1097/MIB.0000000000000607 69. Ohtsuka K, Takenaka K, Kitazume Y, et al. Magnetic Resonance
enterography for the evaluation of the deep small intestine in Crohn’s disease. Intest Res 2016;14:120–126. doi:10.5217/ir.2016.14.2.120 70. Park SH. DWI at MR enterography for evaluating bowel inflammation
in Crohn disease. AJR Am J Roentgenol 2016;207:40–48. doi:10.2214/ AJR.15.15862
71. Bhatnagar G, Dikaios N, Prezzi D, Vega R, Halligan S, Taylor SA. Changes in dynamic contrast-enhanced pharmacokinetic and
diffusion-weighted imaging parameters reflect response to anti-TNF therapy in Crohn’s disease. Br J Radiol 2015;88:20150547. doi:10.1259/ bjr.20150547
72. Foti PV, Farina R, Coronella M, et al. Crohn’s disease of the small bowel:evaluation of ileal inflammation by diffusion-weighted MR imaging and correlation with the Harvey-Bradshaw index. Radiol Med 2015;120:585–594. doi:10.1007/s11547-015-0502-8
73. Li X, Sun C, Mao R, et al. Assessment of Activity of Crohn Disease by Diffusion-Weighted Magnetic Resonance Imaging. Medicine (Baltimore) 2015;94:e1819. doi:10.1097/MD.0000000000001819 74. Church PC, Turner D, Feldman BM, et al. Systematic review with
meta-analysis:Magnetic resonance enterography signs for the detection of inflammation and intestinal damage in Crohn’s disease. Aliment Pharmacol Ther 2015;41:153–166. doi:10.1111/apt.13024
75. Narin B, Ajaj W, Göhde S, et al. Combined small and large bowel MR imaging in patients with Crohn’s disease: A feasibility study. Eur Radiol 2004;14:1535–1542. doi:10.1007/s00330-004-2364-7
76. Ajaj WM, Lauenstein TC, Feister G, et al. Magnetic resonance colonography for the detection of inflammatory diseases of the large
bowel: Quantifying the inflammatory activity. Gut 2005;54:257–263. doi:10.1136/gut.2003.037085
77. Schreyer AG, Rath HC, Kikinis R, et al. Comparison of magnetic resonance imaging colonography with conventional colonoscopy for the assessment of intestinal inflammation in patients with inflammatory bowel disease: a feasibility study. Gut 2005;54:250–256. doi:10.1136/ gut.2003.037390
78. Dinter DJ, Chakraborty A, Brade J, et al. Endoscopy and magnetic resonance imaging in patients with Crohn’s disease: A retrospective single-centre comparative study. Scand J Gastroenterol 2008;43:207– 216. doi:10.1080/00365520701676021
79. Fernandes SR, Rodrigues RV, Bernardo S, et al. Transmural Healing Is Associated with Improved Long-term Outcomes of Patients with Crohn’s Disease. Inflamm Bowel Dis 2017;23:1403–1409. doi:10.1097/ MIB.0000000000001143
80 Buisson A, Hordonneau C, Goutorbe F, et al. Bowel wall healing assessed using magnetic resonance imaging predicts sustained clinical remission and decreased risk of surgery in Crohn’s disease. J Gastroenterol 2019;54:312-320. doi:10.1007/s00535-018-1505-8