climatici
Atti del XIII Convegno della Rete Italiana LCA -VIII Convegno dell'Associazione Rete Italiana LCA Roma, 13-14 giugno 2019
A cura di Gabriella Arcese, Maurizio Cellura, Sara Cortesi, Laura Cutaia, Maria Claudia Lucchetti, Erika Mancuso, Marina Mistretta, Chiara Montauti, Simona Scalbi
ISBN: 978-88-8286-389-0
2019 ENEA
Agenzia nazionale per le nuove tecnologie, l'energia e lo sviluppo economico sostenibile
Revisione editoriale: Giuliano Ghisu Copertina: Cristina Lanari
Indice
Comitato scientifico 7
Comitato organizzatore 8
Programma 9
PREFAZIONE ... 13
METODI E STRUMENTI LCT- BASED NELLE POLITICHE AMBIENTALI ... 15
The effectiveness of LCA-based emissions policies against carbon leakage: theory and application ... 16
La tossicità dei metalli pesanti nei metodi LCIA: gli effetti delle incertezze sui fattori di caratterizzazione ... 24
Towards the harmonization of the environmental footprint methodology of construction products: insights from the experiences on EPDs ... 31
Social Life Cycle Assessment: past, present and future initiatives ... 37
Funzionalità e applicabilità del modello LANCA a scala regionale: un caso studio in Emilia-Romagna ... 42
METODI E STRUMENTI LCT: ESPERIENZE E CASI STUDIO ... 51
Process modelling-supported LCA: flue gas cleaning of a waste-to-energy plant ... 52
Sviluppo di una PEFCR applicata ai servizi ... 60
Sustainable recovery of phenolic compounds from olive mill wastewater: an LCA evaluation ... 67
Valutazione LCA di pavimentazioni stradali contenenti plastiche da riciclo come materia prima seconda ... 75
Enhancing the environmental performance in the hollow glass production. A case study ... 82
Comparison of Carbon Footprint of the Italian LCA Network Conferences 2017-18: lesson learnt to mitigate and compensate emissions for the future ... 90
PREMIAZIONE CONCORSO GIOVANI RICERCATORI LCA ... 99
La Life Cycle Assessment applicata alla valutazione della sostenibilità ambientale del riuso delle batterie da trazione ... 100
Development and testing of a new life cycle assessment method for the monetary evaluation of water scarcity impacts ... 107
Application of a decision framework to explore stakeholders’ opinions for comparative LCA and LCC studies ... 115
ENERGIA ... 123 Applicazione della metodologia LCA all’eco-design del dispositivo WaveSAX di
generazione dal moto ondoso ... 124 Environmental effectiveness of the Solar Home Systems based on LCA ... 132 Carbon footprint di impianti modello per la produzione di energia dal mare ... 140 Analisi del ciclo di vita e monetizzazione dei costi esterni: un’applicazione
al confronto tra auto ... 149 Ottimizzazione Multi-Obiettivo delle Prestazioni Energetiche e Ambientali
di un Edificio Residenziale ... 156 Life Cycle Analysis applications for Nearly Zero Energy Buildings ... 163 Literature review on Remanufacturing strategies and LCA forward the building sector 171 Miglioramento del profilo energetico-ambientale dell’involucro edilizio verticale opaco attraverso l’adozione di componenti con matrice materica da riciclo ... 179
LCT ED ECONOMIA CIRCOLARE ... 187 LCA e LCC a supporto dell’economia circolare: proposta di integrazione. ... 188 End-of-life management of photovoltaic modules from a circular economy
perspective ... 195 Towards the accounting of resource dissipation in LCA ... 202 Life Cycle Assessment for measuring Circular Economy at company level:
is it suitable? ... 209 LCA delle casse del sistema “usa e recupera”. Un esempio di “closed loop”
in economia circolare ... 216 Introducing the Plastic Leak Project: a pre-competitive initiative to harmonize
plastic indicators in Life Cycle Assessment ... 223
ESPERIENZE E CASI STUDIO NEL SETTORE AGRO-ALIMENTARE... 229 Carne coltivata in laboratorio e climate change: un’analisi critica ... 230 Il metodo PEFMED a supporto dell’eco-innovazione nel settore agroalimentare
mediterraneo: il caso del Taleggio DOP ... 237 Gestione dei residui di potatura del vigneto: impatto ambientale di diversi scenari
gestionali... 244 Eco-design per il miglioramento dell’impronta ambientale: il Passaporto Ambientale per i prodotti agroalimentari della Montagna Vicentina ... 251 Valorizzazione dei sottoprodotti di una filiera agroalimentare: co-frangitura di olive
POSTER ... 265
Functional unit selection for Life Cycle Assessment in mixes with Supplementary Cementitious Materials: a literature review ... 266
Carbon Footprint della Birra Ichnusa in bottiglia di vetro: i vantaggi della filiera del vuoto a rendere ... 273
Carbon Capture and Storage – A Review of Life Cycle Assessment of the Transportation and Storage Phases ... 281
Life Cycle Thinking and waste prevention activities: the case of Emilia-Romagna region ... 289
SLCA per il settore vitivinicolo: integrazione degli indicatori territoriali VIVA alle sotto-categorie di impatto ... 294
Carbon Footprint di prodotti innovativi per il settore delle imbarcazioni: focus sugli scenari di fine vita ... 300
LCA di un sistema di illuminazione adattivo: il caso del quartiere EUR di Roma ... 306
Application of the Life Cycle Thinking in Eni for the achievement of EU Sustainable Development Goals:Green Refinery enhancements. ... 314
Life Cycle Assessment del processo di produzione di PHA da coltura pura di Pseudomonas putida ... 321
Luminescent Solar Concentrator (LSC): principio di funzionamento e fasi preliminari dell’analisi LCA applicata alla Smart Window-LSC ... 328
Analisi LCA della produzione di metanolo dai gas di acciaieria: il progetto europeo FReSMe... 336
Life cycle assessment approaches applied to energy modelling of urban building stocks: a literature review ... 343
Il ciclo antropogenico dell’europio e la domanda di risorse critiche nel settore dell’illuminazione ... 351
TOLLY®: l'olio rosso di oliva e pomodoro, ottenuto applicando l'economia circolare ... 358
La valutazione d’impatto ambientale delle organizzazioni. Una review della letteratura ... 367
Life Cycle Assessment and Organisation Environmental Footprint di un’impresa polisettoriale della Provincia di Taranto ... 376
Spreco alimentare: un pericoloso ostacolo ai SDGs ... 384
Evaluation of sustainable use of RAP from LCA perspective: a literature review ... 391
Life Cycle Assessments of bio-based insulating materials. A literature review ... 400
The impact assessment of extending of products: a methodological framework ... 410
A literature review of the integration of optimization algorithms and LCA for microgrid design: a replicable model for off-grid systems in developing countries ... 418
Carbon footprint and energy requirement of the biopolymers polyhydroxyalkanoates: a review ... 425
Life Cycle Interpretation nella Social Life Cycle Assessment: spunti di riflessione ... 432 The evaluation of the environmental sustainability of circular solutions:
the treatment of landfill leachate ... 441 Subjectivity in the consequential approach to LCA: a review about the interpretation of the concept in literature ... 447 Second-hand consumption: the environmental benefits of the reuse strategy in
the context of Circular Economy ... 453 Environmental LCA for maintenance and rehabilitation activities on structures
under risk: a literature review ... 462 Assessment framework to improve and manage LCT into building design practice ... 470 LCA del nuovo servizio ospedaliero da remoto DAPHNE ... 477 Analisi preliminare degli impatti ambientali della movimentazione delle macerie da
terremoto in Provincia di Macerata ... 484 Variazione del quadro di incentivazione delle fonti elettriche rinnovabili: analisi
consequenziale della produzione di elettricità da impianti di biogas ... 491 Confronto tra le PEFCR e il metodo SALCA nella LCA della pasta ... 498
Enhancing the environmental performance in the hollow
glass production. A case study
Teodoro Gallucci1, Giovanni Lagioia 1, Paolo Piccinno 2, Amedeo Lacalamita2, Andrea Pontrandolfo 1 and
Annarita Paiano 1
1Department of Economics, Management and Business Law
University of Bari Aldo Moro, Largo Abbazia Santa Scolastica, 53-70124 Bari
2 P&R Project via Martinelli Diego, 24 - 70018 Rutigliano (BA)
Email: [email protected]
Abstract
In Italy the production of hollow glass represents more than 82% of the total glass production and recycled glass is one of the most important materials, as it allows to obtain great environmental benefits as well as a reduction in energy consumption. The present paper has carried out an LCA study. The goal of the analysis has been to analise the environmental performance within the whole life cycle system of the hollow glass production to identify possible alternative scenario for reducing the environmental impacts, in particular the global warming potential emissions. The scenario has considered the hypothesis to increase cullet post consumer use in the current production system from regional supply.
1. Introduction
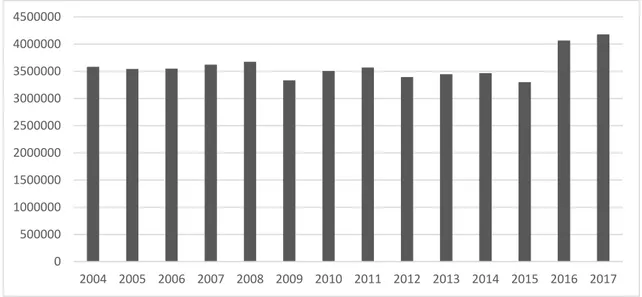
In Italy the production of hollow glass represents more than 82% of the total glass production, which is equal to over 5,000,000 t (Assovetro, 2018); commodities from the hollow glass include bottles, glasses, containers, which are uses in many sectors as the food, pharmaceutical and cosmetic ones. In the analysis of the Italian hollow glass market, fig. 1, the trend of production over the years has been constant over time.
Figure 1: Hollow Glass Production in Italy (t).
Source: Personal elaboration by Author on Feve, 2015 and Assovetro, 2018
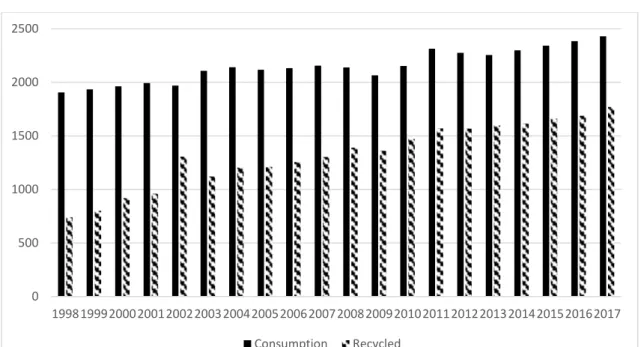
To better understand this market, it is necessary to focus attention also on the consumption of this sector in Italy. Analyzing fig.2, it is possible to highlight how the consumption of hollow glass, which have shown a slow but significant increase in the decade 2007-2017, increased hollow glass consumption of 12.70%.
0 500000 1000000 1500000 2000000 2500000 3000000 3500000 4000000 4500000 2004 2005 2006 2007 2008 2009 2010 2011 2012 2013 2014 2015 2016 2017
Figure 2: Historical Series of consumption and recycling of glass packaging in Italy (kt) Source: Grisan, 2018 and Feve, 2015
With the increasing use of glass, it was necessary to increase the recycling of this material guaranteeing a reduction in the use of virgin raw materials. It is important to highlight how over the years the recycling of this material has increased, going from 740 kt in 1998 to 1,769 kt in 2017, which is 72.80% of the glass consumption and over 42% of the hollow glass production. In Europe, the average recycling rate for glass packaging is steady at 74%. This figure is in line with Italian performance, but significantly lower than countries such as Belgium, Switzerland, Finland or Sweden, where this rate is around 95%. Currently, recycled glass is one of the most important materials, as it allows to obtain great environmental benefits as well as a reduction in energy consumption. The relevance of container glass sector, which could increase its importance in replacement of some plastic by single use together with its environmental impacts, suggests studies and analysis for enhancing the technical, environmental, economic, performances of this industry.
The present LCA study has been twofold: a) to analyze the environmental performance within the life cycle system of the hollow glass production from a plant and b) to identify a possible alternative scenario for reducing the environmental impacts, and the global warming potential emissions. The scenario has considered the hypothesis to increase cullet post consumer use from regional supply within the current production system.
2. Materials and Methods
Data and relative documents come from Vetrerie Meridionali (VeMe) S.p.a. plant located in Castellana Grotte (BA) Italy. This company, which is the object of the LCA study, has been working in the automatic hollow glass sector for over 40 years. Its annual production is equal to 130,000 - 140,000 tons with a workforce of 210 units.
An LCA was performed based on current production cycle of the company, concerning the container glass for beverage and food. Based on the analysis of the worst environmental performance of the stages within the entire cycle, best practices were applied to improve the performance. Finally, a comparison of environmental impacts has been made between
0 500 1000 1500 2000 2500 19981999200020012002200320042005200620072008200920102011201220132014201520162017 Consumption Recycled
1.1. LCA
The LCA study has been elaborated according to the ISO 14040:2006 and 14044:2018, to the PCR basic module CPC 37 “glass and glass products and other non-metallic products n.e.c. v 3.0” (Environdec, 2018). Software used is GaBi thinkstep AG version 8.7.0.18 ecoinvent integrated 3.3 database. All the data used in the present analysis are “primary data” or “site specific data” that are data collected within the production plant where the specific product processes are performed and data from other parts of the cycle of life brought back to the specific product system under examination, for example materials or electricity supplied by a contractual supplier who is able to provide data for the services actually delivered. No allocations or parameterizations have been made.
The functional unit was identified in 1 kg of finished hollow glass. The energy data used refers to the domestic energy mix. The method used to assess the environmental impact is the latest available version of CML 2001 (January 2016 version).
2.1.2. Life cycle impact assessment
The calculated impact categories are as follows:
• Greenhouse gas emissions (expressed as the sum of global warming potential, GWP, 100 years), in carbon dioxide equivalents (CO2).
• Emission of acidifying gases (expressed as the sum of the acidification potential, AP) in sulfur dioxide (SO2) equivalent.
• Gas emissions that contribute to the creation of tropospheric ozone (expressed as the sum of potential ozonation, POCP), in C2H4 (ethylene) equivalent.
• Emission of substances in water that contribute to the reduction of oxygen (expressed as a sum of potential eutrophication, EP), in phosphate (PO4) equivalent.
•Abiotic depletion potential is calculated and displayed as two separate indicators. The first is Abiotic Depletion Potential – Elements (ADP-Elements), which includes all non-renewable material resources, in kg Sb equivalent.
• The second is Abiotic Depletion Potential – Fossil fuels, (ADP-fossil fuels) including all fossil resources, in MJ (net calorific value).
• Water depletion (WD), which is equal to water use (only water input flows are considered), in m3.
2. LCA inventory
2.1. System boundaries
The analysis concerns the “from cradle to grave” methodology, excluding the final consumption phase are divided into three phases called UPSTREAM, CORE and DOWNSTREAM. The system boundaries are those identified by the CPC 37 PCR and by other typologies of studies (Vinci et al, 2019; Auer et al, 2017; Avery, et al. 2017).
Figure 3: The life cycle stage
2.2. Inventory
It was decided to carry out a cut-off of 1% in relation to the masses of incoming and outgoing flows (raw materials, primary packaging, waste products and substances for maintenance and treatment). It was also verified that the flows excluded for cut-off participated in less than 1% of the environmental impacts calculated as required in the reference PCR.
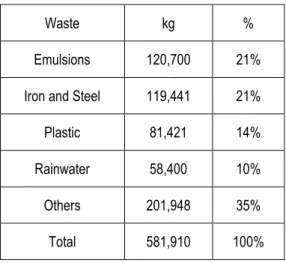
Table 2 shows data concerning the waste generated during the core, upstream and downstream phases. The most important waste categories are emulsions, steel and iron waste: these two categories together represent more than 40% of the total amount of produced waste. Among the categories identified, another important consideration is characterised by rainwater, representing 10% of the total waste produced.
Table 1: Quantity of the main raw material used per year and their percentage
Raw material kg % Cullet 57,536,013.11 32 Sands 60,479,030.70 34 Soda 20,813,685.60 12 Calcium carbonate 14,747,711.18 8 Dolomite 10,198,933.70 6 Yellow sands 15,289,920.50 8 Total 179,773,043 100
Table 2:. The main categories of waste
Waste kg %
Emulsions 120,700 21% Iron and Steel 119,441 21%
Plastic 81,421 14%
Rainwater 58,400 10%
Others 201,948 35%
Total 581,910 100%
2.3. Transport carriers
The other data entered in the process flow concerns: transport of raw material (sand and soda) on a ship transport packaging, energy carriers used in the production process, finished product, transport of waste to landfills, finished product transport to customer companies, raw material transport. The transport values are the following: ship transport: 1.610 ton/km; road transport: 0.047 tons/km; Packaging transport: 0.001 ton/km; Waste transport value to landfill: 0.00104 ton/km; Finished product transport to the customer companies: 0.00007 ton/km. The waste transported to the landfill are of two types: those deriving from the production process and those extrapolated by the EUROSTAT data in which the data of glass taken to landfill and not recovered has a value equal to 23.1%.
The data related to diesel consumption comes from the meter placed at the service of the supply tank. The data measured by the meter is expressed in liters; the conversion factor defined by ENEA with reference to Legislative Decree 102/2014 and equal to 0.833 kg / liter was used for the conversion into kg.
2.4. The life cycle stage
The main process includes the three main phases, UPSTREAM, CORE and DOWNSTREAM. The CORE input and output flows are the VeMe materials (raw material and primary packaging material) and the hollow finished glass respectively.
UPSTREAM PHASE
The UPSTREAM phase includes the procurement of raw materials and material for the primary packaging, all contributing to making up the material entering the production process inserted in the CORE phase.
CORE PHASE
The CORE phase includes the consumption of energy carriers (electricity, natural gas and diesel) according to the domestic energy mix, the consumption of substances for maintenance and treatments, the transport of the incoming raw material the waste produced for recovery and the waste produced. sent to the landfill.
DOWNSTREAM PHASE
The DOWNSTREAM phase includes the transport of the finished product to the customer companies and the recycling and unloading phase of the glass, following its use, once thrown into the recycling bins or into undifferentiated bins, the percentage used to calculate the value of waste-recycled glass.
3. Results and Discussion
Figure 4 shows the results of the environmental performance splitting the main environmental indicators between PRE phase and POST phase. PRE phase refers to the LCA of the whole current production process; POST phase refers to the scenario with the increasing of 50% of cullet post consumer from regional supply. This means that from 57,536,013,11 kg (as reported in table 1) of cullet current used in the production activity it has gone to 115,072,027,40 equal to 64% of the total of raw materials.The other raw materials have been reduced in proportion with the average composition of the raw material used by the company. From techonological point of view this scenario is plausible given that the furnace can be fed with more than 70 % of cullet (personal communication by the plant manager of the VeMe company). This hypothesys is valid considering that are over 84,000 t of post- consumer cullet is available in the Apulia region from the separate collection. This is equal to 21 kg/per person of cullet yearly collected in this region.
For the GWP environmental indicator, the greater weight of the impact is represented almost equally using energy vectors (CORE phase) and by the supply of the raw material calcium carbonate (UPSTREAM phase), followed by the supply of soda always relative to the UPSTREAM phase.
These results can be useful for a pre-revamping analysis to implement some technological innovations. As above underlined, on the basis on our hypothesis (increasing share of cullet to more than 60%), the environmental impacts have been calculated for comparison with the current data.
Figure 4: LCA comparison between scenario PRE (current production system) and POST (scenario with the increasing of 50% of cullet post consumer from regional supply)
It emerges a GWP reduction, due to a decrease of raw materials and road transport and to the energy requirements for glass melting (Blengini et al, 2012), above all in the upstream and core phases, as figure 4 shows. The results related to energy savings are in line with other studies, which illustrated that every 10% replacement of the sand mixture, soda and some oxides with glass cullet saves 2.5% of the energy needed for the chemical transformation that takes place in the melting furnace (Gallego-Schmid et. al, 2018; Vellini et al, 2009).
It must be stressed as the improvement of the separated collection rate can useful affect the regional supply of the glass cullet. So, the challenge will be to implement the circular economy cluster at regional or provincial level, where the urban waste become the inputs of the production cycles.
4. Conclusions
The carried-out analyses show that the use of glass cullet instead of raw materials ehances the main environmental performance indicators, above all if cullet is recovered in the regional territory. Furthermore, the reduced use of soda (sodium carbonate), calcium carbonate and dolomite (calcium carbonate and magnesium) thanks to the proportional increasing of the cullets materials saves the amount of “indirect” energy required for preparation of the vitrifiable mixture. Other important aspect is related to reduction of the transport of raw material (sand and soda) by the ship. The advantage of the cullet from regional supply reduces dramatically the ratio tons/km with important benefits on the environment. The main disadvantage of cullet procurement is the associated with the quality of the product. It is important to select cullet without contamination avoiding glass from solar panels or flat glass because if not removed could affect negatively the batch stream.
Aknowledgement
A special thanks to Dr. Leonardo Spinelli (plant manager) and Dr. Vito Nicola Tatone (EHS Coordinator & Energy Team Leader) who greatly assisted the research study.
5. References
Assovetro, 2018. Dati di settore, http://www.assovetro.it/dati-di-settore/, accessed 12 Mar 2019
Auer J, Bey N, Chafer JM, 2017. Combined Life Cycle Assessment and Life Cycle Costing in the Eco-Care-Matrix: A case study on the performance of a modernized manufacturing system for glass container. Journal of Cleaner Production. 141, 99-109.
Avery, G, Bhaduri, S, Nordmeyer, J, 2017. Life cycle analysis of Glass Containers prepared by Owens – Illinois, US.
Blengini, GA, Busto, M, Fantoni, M, Fino D, 2012. Eco-efficient waste glass recycling: Integrated waste management and green product development through LCA. Waste Management. 32, 1000–1008.
FEVE, 2015. Eu Container Glass Production Growth Shows Industry Resilience, < https://feve.org/wp-content/uploads/2016/04/EU-container-glass-production-growth-shows-industry-resilience.pdf>, accessed 10 Mar 2019
ISO 14040, 2006. Environmental management e Life cycle assessment. Principles and framework-Requirements and Guidelines.
ISO 14044, 2018. Environmental management e Life cycle assessment. Requirements and Guidelines. Fondazione per lo sviluppo sostenibile, Unione Nazionale Imprese Recupero, 2017. L’Italia del Riciclo 2017, <https://www.fondazionesvilupposostenibile.org/wpcontent/uploads/dlm_
uploads/2017/12/Rapporto_Italia_del_riciclo_2017.pdf>, accessed 12 Mar 2019
Gallego-Schmid, A, Mendoza, JMF, Azapagic, A, 2018. Improving the environmental sustainability of reusable food containers in Europe. Science of the Total Environment. 628–629: 979–989.
Grisan, 2018. Gli imballaggi nell’economia circolare,
<http://www.conai.org/wpcontent/uploads/dlm_uploads/2018/11/CONAI_Report_Sostenibilit%C3%A0_2018. pdf>, accessed 1 April 2019.
Environdec (2018). Product Category Rules (PCR), PCR Basic Module CPC 37 Glass and glass products and other non-metallic products n.e.v 3.0,Version 3.0
Vellini, M, Savioli, M, 2009. Energy and environmental analysis of glass container production and recycling. Energy. 34, 2137–2143.
Vinci, G, D’Ascenzo, F, Esposito, E, Musarra M, 2019. A sustainable innovation in the Italian glass production: LCA and Eco-Care Matrix evaluation. Journal of Cleaner Production DOI:10.1016/j.jclepro.2019.03.124 (accepted manuscript)